


To determine the best propofol pharmacokinetic model that meets patient requirements and is devoid of major haemodynamic side effects.
Material and methodsProspective, randomised, open-label, clinical trial was performed on an intention to treat basis. It included 280 patients with ASA physical status I–III, aged 18–80 years and a weight range between 45 and 100kg, scheduled for surgery under general anaesthesia. They were randomised into two groups according to the pharmacokinetic model: Modified Marsh group and Schnider group. The haemodynamic changes that occurred during the induction and intubation were analysed. A propofol target-controlled infusion was started to achieve and maintain a bispectral index value between 35 and 55. At minute 6, orotracheal intubation was performed and the study finished at minute 11.
Heart rate, mean arterial pressure and their product (HR×MAP) were measured and recorded every minute throughout the study. Every HR×MAP value was compared to its baseline value to determine the minimum value before intubation, the maximum value after intubation, the maximum variation after intubation, and its final value. The GRADIENTE (MIN, MAX) variable (primary endpoint of this study) analyses the difference between maximal and minimal values related to intubation. Propofol doses and calculated concentrations and any hypotensive events were also recorded.
ResultsNo differences were found between groups regarding haemodynamic performance. GRADIENTE (MIN, MAX) values and the percentage of hypotensive events were: Modified Marsh group median 77.41% vs. Schnider group 84.86% (p=0.821) and 17.3% vs. 12.8% (p=0.292), respectively.
ConclusionThe study failed to demonstrate any haemodynamic difference between the two groups, even though the Modified Marsh group received a larger dose of propofol.
Determinar qué modelo farmacocinético para propofol proporciona una mayor estabilidad hemodinámica durante la inducción anestésica.
Material y métodosEnsayo clínico prospectivo, aleatorizado, no ciego y por intención de tratar donde se incluyeron 280 pacientes ASA I–III, 18–80 años de edad y 45–100kg de peso, programados para cirugía bajo anestesia general. Los pacientes se distribuyeron aleatoriamente en 2 grupos, dependiendo del modelo farmacodinámico para propofol empleado (Marsh Modificado o Schnider), para analizar el comportamiento hemodinámico durante la inducción y la intubación. Se administró una infusión controlada por objetivo de propofol para mantener un índice biespectral de 35–55. En el minuto 6 se realizó la intubación orotraqueal, finalizando el estudio a los 11min del comienzo.
Fueron recogidos cada minuto la frecuencia cardiaca, la tensión arterial media, las dosis, las concentraciones de propofol y la aparición de hipotensión. El producto de la frecuencia cardiaca y la tensión arterial media (FC×TAM) fue calculado cada minuto y analizado pormenorizadamente, determinando, entre otros, el valor mínimo antes de la intubación, el máximo tras ella, y la relación entre estos 2 valores (GRADIENTE [MÍN, MÁX], variable principal del estudio).
ResultadosNo hubo diferencias significativas en el comportamiento hemodinámico entre los grupos del estudio. GRADIENTE (MÍN, MÁX): 77,41 vs. 84,86% (p=0,821); hipotensión: 17,3 vs. 12,8% (p=0,292); Marsh Modificado y Schnider, respectivamente.
ConclusiónNo se han podido demostrar diferencias en el comportamiento hemodinámico, a pesar de que el grupo del Marsh Modificado recibió una dosis mayor de propofol.
Haemodynamic changes during general anaesthesia have a poor prognosis, and should be avoided. Most variations are secondary to anaesthesia induction and orotrachael intubation (OTI).1,2
The decline in heart rate (HR) and blood pressure (BP) during anaesthesia induction is dependent on a variety of factors, including the anaesthetic dose used, high ASA (American Society of Anaesthesia) physical status, and certain diseases (anaemia, hypovolaemia, or ventricular dysfunction).3–7 OTI, however, is accompanied by an increase in these haemodynamic parameters.3,8,9 Correct analgesic management can minimise this response.
The decline in blood pressure during anaesthesia induction with propofol is due to a loss of systemic vascular resistance10,11 or a decline in cardiac output, which can be aggravated by the addition of other drugs, such as fentanyl.12,13 However, the haemodynamic response to intubation is milder with propofol than with other hypnotic agents.8,14 Correct analgesic management can minimise this response.
Target-controlled infusion (TCI) and the use of parameters such as the bispectral index (BIS) to measure depth of anaesthesia can help anaesthesiologists adjust the dosage to the needs of each patient over time, thus giving better control over haemodynamic changes.15
Different TCI models for propofol have previously been compared to evaluate pharmacological aspects such as the accuracy of the calculated concentration, the pharmacokinetic and pharmacodynamic properties, and the safety of the drug.16,17 Different forms of administration (manual infusion), different types of general anaesthetic,18–21 and even different effect-site concentration (Ec) TCI models have been compared.22 In all these studies, the most predominant side effect was haemodynamic compromise.
Currently, the most widely used Ec models for propofol are Modified Marsh17,23 and Schnider.24,25
The Modified marsh model delivers a higher dose than the Schnider model,26 and can therefore cause greater changes in haemodynamic variables (decline in HR and mean arterial pressure [MAP]) during induction, and achieve greater stability of these parameters during OTI.
In this study, we compared these two BIS-guided Ec TCI models for propofol during anaesthesia induction and OTI to determine which model provides the greatest haemodynamic stability.
Material and methodsThis was a prospective, randomised, non-blind study in 280 patients. The study was approved by the Clinical Research Ethics Committee of the Hospital Universitario Severo Ochoa in Leganes (Madrid, Spain) in June 2009, and all patients signed an informed consent form prior to inclusion. All study patients were scheduled for surgery under general anaesthesia with OTI. All were classified ASA I–III, with a weight range of 45–100kg and an age range of 18–80 years. Patients were randomised to one of two study groups, MM or S, depending on the mathematical model used for propofol TCI infusion: Modified Marsh17,23 or Schnider.24,25 We decided against conducting a blinded study, because the difference between the models is so evident that they can be easily identified. Study groups were formed using a web-based randomisation table downloaded from: http://www.random.org (Mads Haahr School of Computer Science and Statistics, Trinity College, Dublin, Ireland).
Patients with any of the following characteristics were excluded from the study: allergy to any study drug; pregnancy; treatment with opioids; drug addiction; uncontrolled systemic disease (for example, hypertension, diabetes mellitus or kidney disease); heart disease; haemodynamic instability; neurological disease; treatment that could alter the electroencephalogram; difficulty with intubation; insufficient premedication or preoperative anxiolysis (insufficient being a Ramsay Scale score of 2 and a Riker Sedation-Agitation Scale score of 4); and failure to obtain adequate depth of anaesthesia (BIS values outside the 35–55 range at 3 or more measurements taken at 6 and 11min). ASA III patients were excluded if they scored higher than II on the New York Heart Association functional classification scale.
All patients were premedicated with 10mg diazepam 2h before the procedure. A peripheral venous catheter was placed, and they were monitored with electrocardiography, pulse oximetry, non-invasive arterial pressure, and a BIS monitor (XP®, version 2.01; Aspect Medical Systems, Natick, MA, USA). All patients received preoxygenation (100% oxygen) through a facemask for 2min before anaesthesia induction. During the study, patients received only the i.v. fluids required for administration of study drugs.
The study started with anaesthesia induction; OTI was performed at 6min and finalised at 11min.
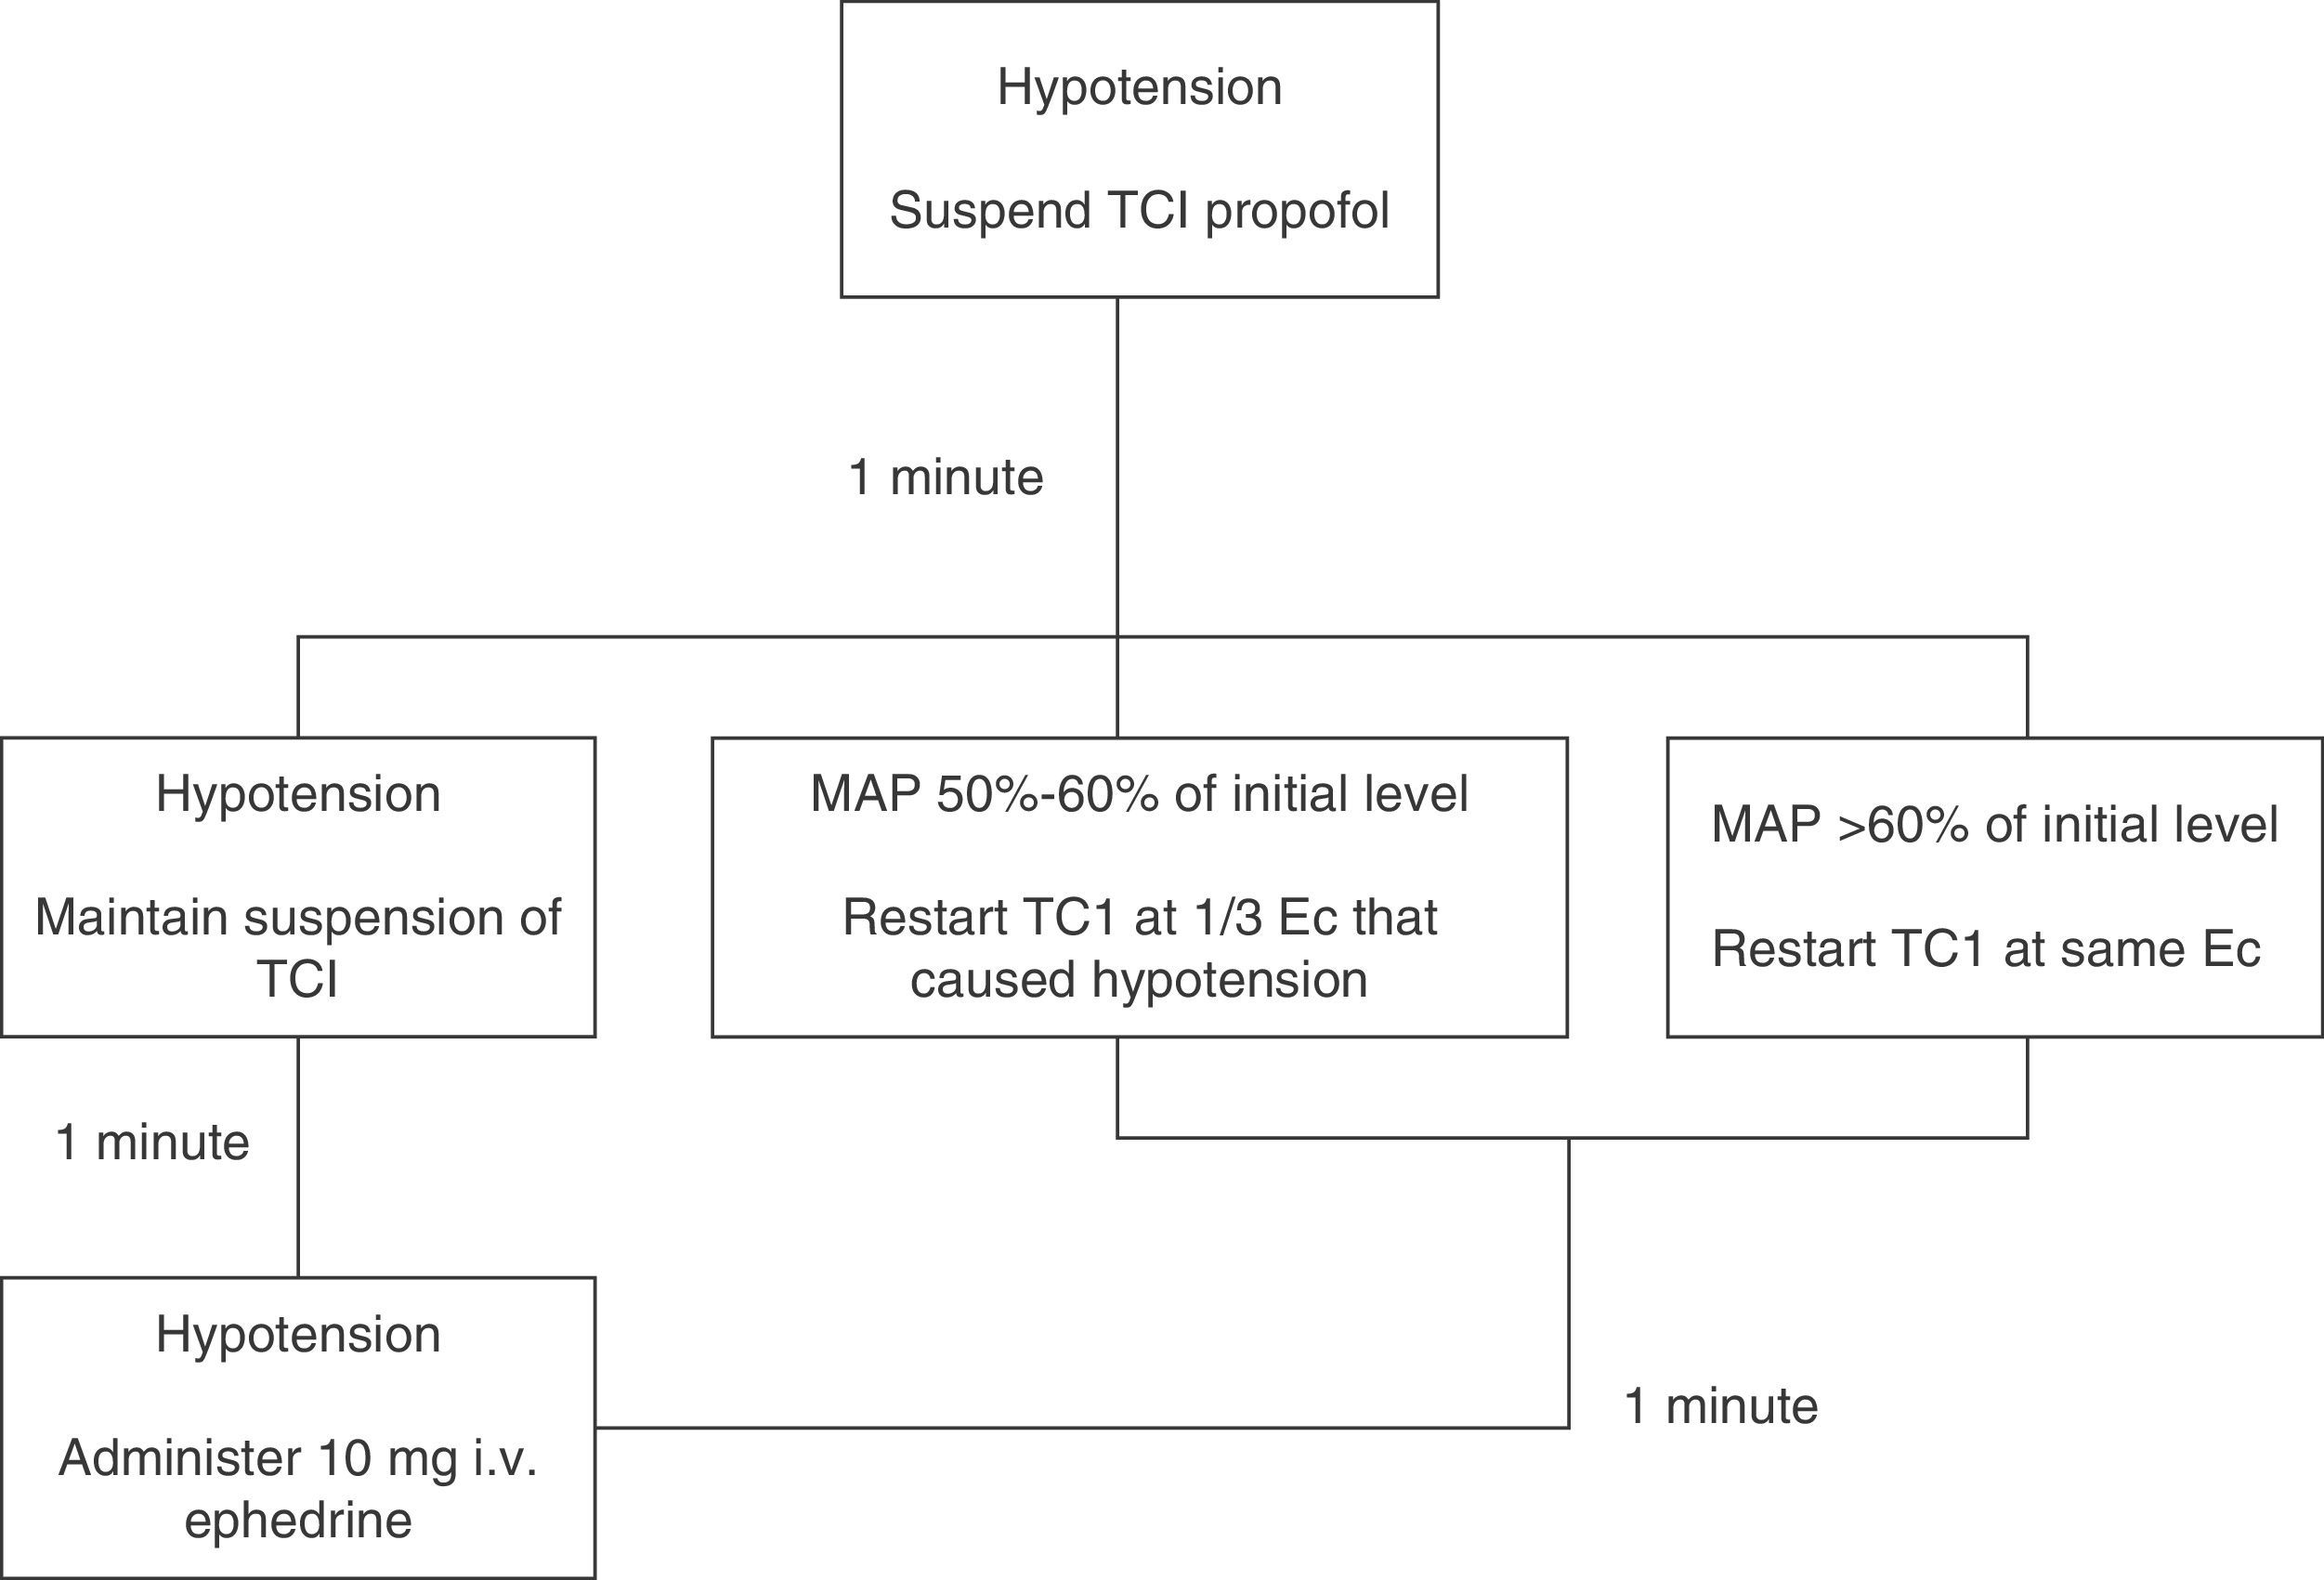
Induction (minute 0) was achieved with 3μgkg−1 fentanyl and propofol. The Base Primea de Orchestra® (Fresenius-Kabi, Brezins, France) TCI pump for propofol was used. Depending on the patient's study group, the pump was programmed according to the Modified Marsh17,23 (MM group) or Schnider24,25 (S group) model. In both cases, the initial target Ec was 6μgmL−1, which was later modified to achieve and maintain a BIS anaesthesia depth of 35–55, unless hypotension was observed. If MAP fell below 50% of baseline value, propofol infusion was changed according to the algorithm shown in Figure 1.
. If hypotension occurred, propofol infusion was suspended. The situation was re-assessed after waiting for 1min: if MAP increased to >60% of baseline MAP, TCI was restarted with the same Ec; if MAP remained between 50% and 60% of baseline level, TCI was restarted with Ec one-third lower than prehypotension; if hypotension persisted, infusion was suspended for a further minute. After the second waiting period, the situation was re-assessed: if MAP increased, we proceeded as described above; if hypotension persisted, infusion was not restarted and the patient was given 10mg of i.v. ephedrine, after which the situation was re-assessed minute by minute until hypotension was resolved.")
Hypotension algorithm. Hypotension management algorithm (MAP<50% of baseline level). If hypotension occurred, propofol infusion was suspended. The situation was re-assessed after waiting for 1min: if MAP increased to >60% of baseline MAP, TCI was restarted with the same Ec; if MAP remained between 50% and 60% of baseline level, TCI was restarted with Ec one-third lower than prehypotension; if hypotension persisted, infusion was suspended for a further minute. After the second waiting period, the situation was re-assessed: if MAP increased, we proceeded as described above; if hypotension persisted, infusion was not restarted and the patient was given 10mg of i.v. ephedrine, after which the situation was re-assessed minute by minute until hypotension was resolved.
OTI was facilitated with 0.15mgkg−1 cisatracurium, administered after an adequate depth of anaesthesia had been achieved (BIS<60).
The following variables were recorded: age, sex, weight, height, body mass index, lean body mass, body surface area, and ASA physical status. Depth of anaesthesia was determined by BIS level every minute, the time required to achieve target sedation (BIS 35–55), and the BIS level at the start of OTI. The time taken to perform OTI was also recorded. The propofol dose, plasma and Se concentrations were recorded at three time points during the study: when target sedation had been achieved, during OTI (minute 6), and at the end of the study (minute 11).
Haemodynamic changes were evaluated on the basis of HR, MAP, and the product of these (HR×MAP) at each minute during the study. All these measurements were non-invasive. HR×MAP was calculated by multiplying HR by MAP and dividing by 100.
The arithmetic mean of the difference between HR×MAP at each minute and its baseline value (MD HR×MAP), and the arithmetic mean of the absolute value of the difference between HR×MAP at each minute and its baseline value (MAD HR×MAP) were calculated.
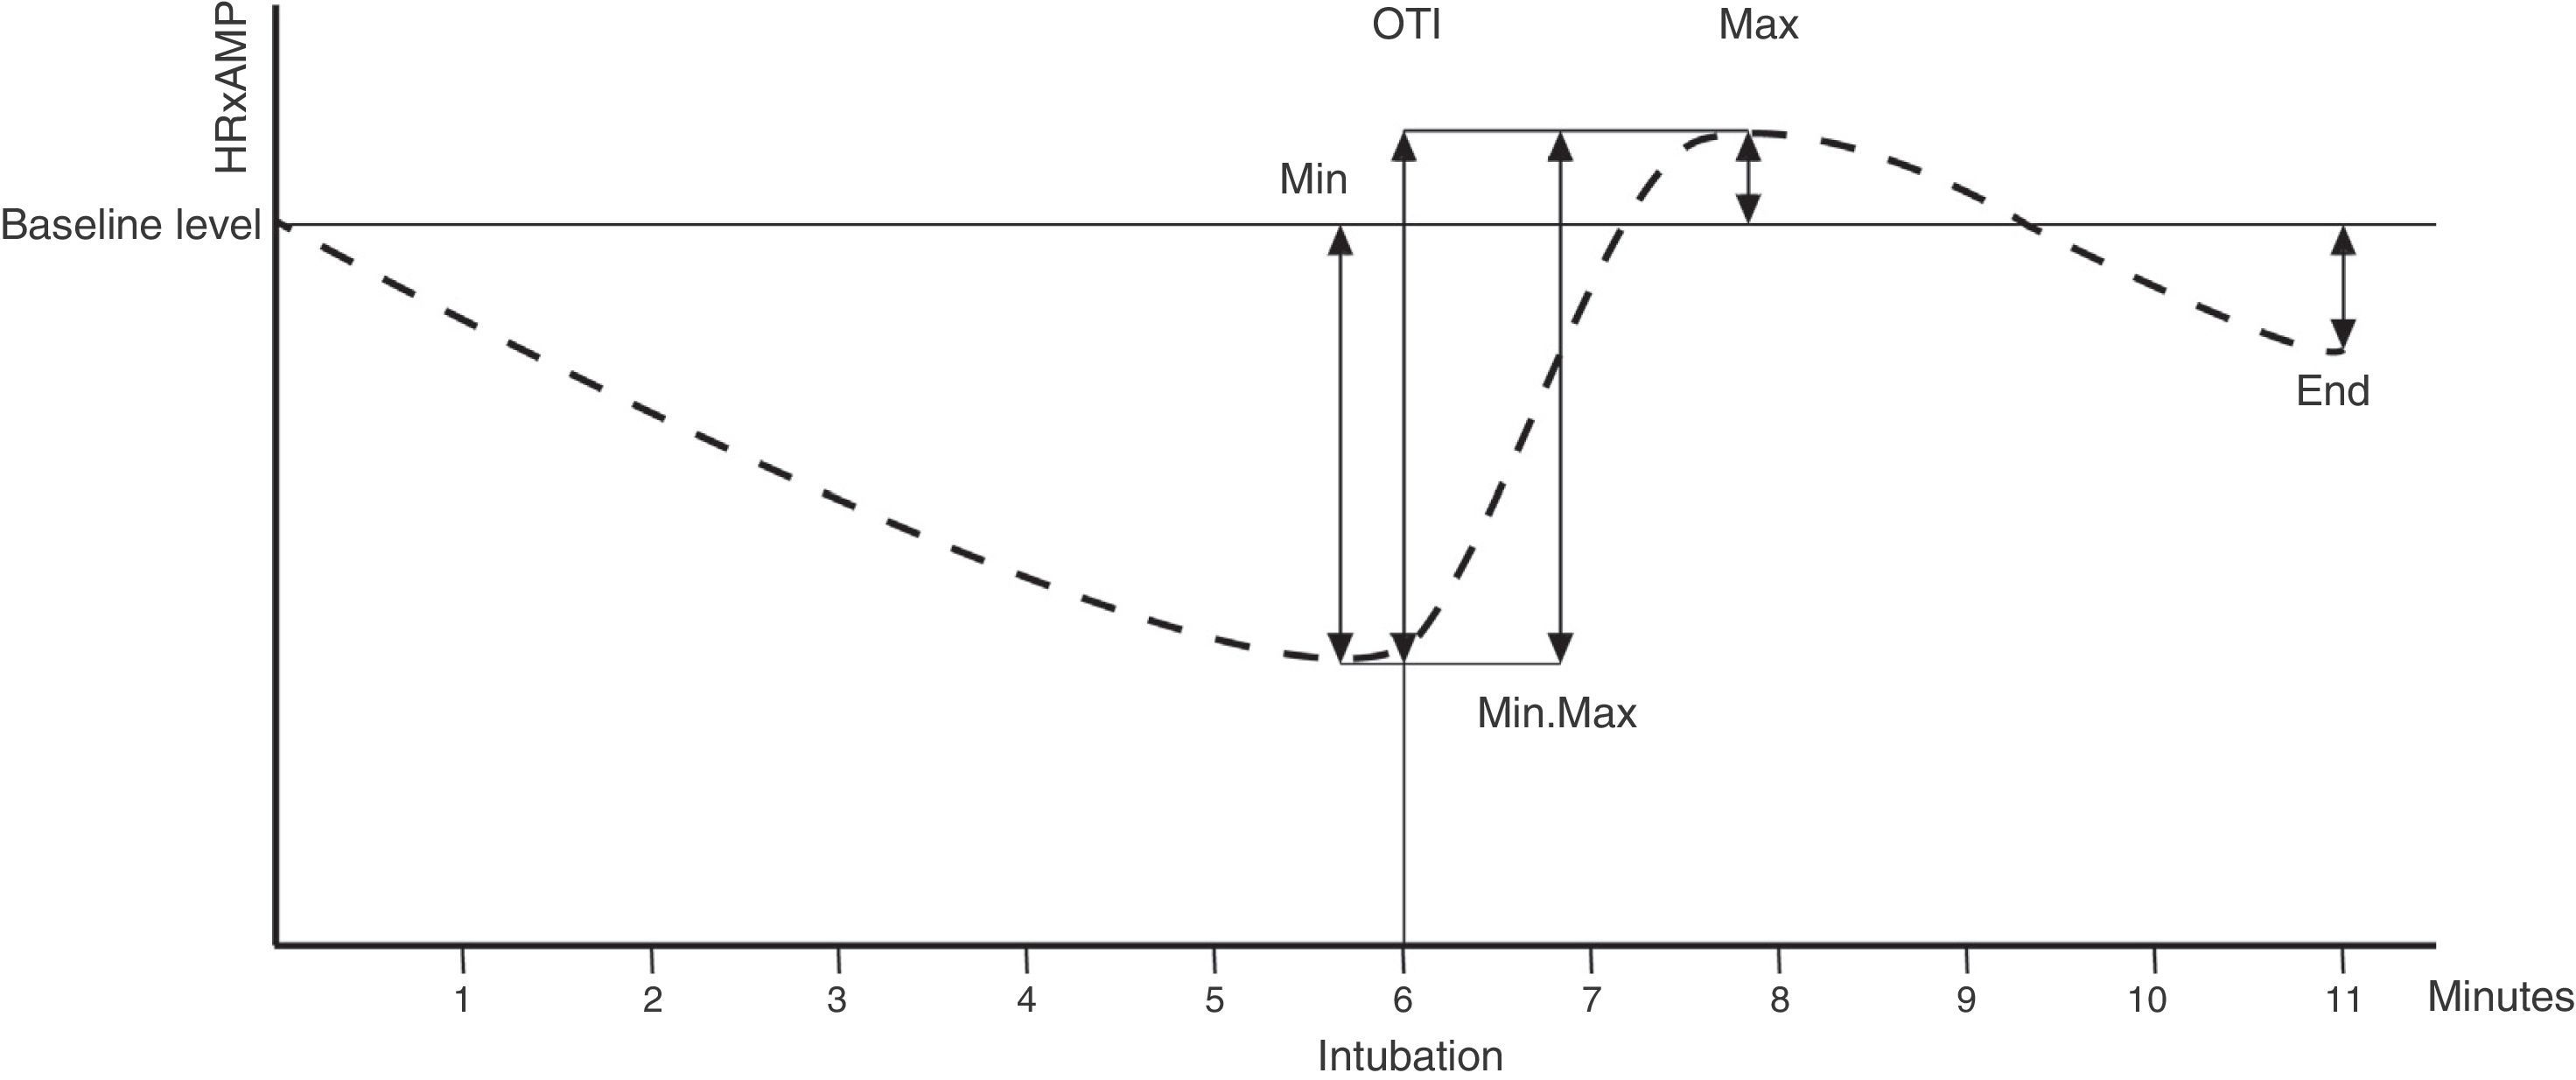
The MIN, MAX, GRADIENT, (MIN, MAX), INTUBATION AND END variables were defined by analysing the percentage variations of HR×MAP with respect to baseline at various time points: before and after intubation, and at the end of the study (see Figure 2)
![Haemodynamic variables. X axis: time in minutes. Y axis: value of HR×MAP (product of heart rate [HR] multiplied by mean arterial pressure [MAP]). Thin horizontal line: baseline HR×MAP. Thin vertical line: orotrachael intubation (OTI), at 6min. Dotted line: evolution of HR×MAP over study time. Arrows: HR×MAP values compared to calculate each variable. MIN: minimum pre-OIT level. MAX: maximum post-OTI level. END: level at end of study (minute 11). MIN.MAX: percentage difference between the lowest pre-OTI level and the highest post-OTI level. INTUBATION: percentage difference between the immediate pre-OTI level (minute 6) and the post-OTI level.](https://static.elsevier.es/multimedia/23411929/0000006200000009/v1_201510250028/S2341192915000591/v1_201510250028/en/main.assets/gr2.jpeg?xkr=ue/ImdikoIMrsJoerZ+w997EogCnBdOOD93cPFbanNd2Vt2E9KIXSbfPNY5VCUB4RA3JJZRYqSM9Oc+pC3l/QhwSFxEt+yjRLpCCm4jnxWgSrzkY/oNKPbIJcXK1RbHOl0SkUnu6S4y6Fctxv7vBtoGNIHUrszbNTuI37VJETnc7v0pW92zIKvulje3hs9HTsveTD58DqjPJskNzhDANkVkIFtmjlsC4Au0UNb5q9tZruGIVWXLHduw+ffpFI4JyMTP/KFzUOoHUYP45Cs0dhgsH8okl6qJaKpYSA9YfQpNw6qS36U2rEpS/65mpFIwES4JvwJ471DFMUQwgydlg0+W3fQ+zx14QQ8rJPJz7z5s= "Haemodynamic variables. X axis: time in minutes. Y axis: value of HR×MAP (product of heart rate [HR] multiplied by mean arterial pressure [MAP]). Thin horizontal line: baseline HR×MAP. Thin vertical line: orotrachael intubation (OTI), at 6min. Dotted line: evolution of HR×MAP over study time. Arrows: HR×MAP values compared to calculate each variable. MIN: minimum pre-OIT level. MAX: maximum post-OTI level. END: level at end of study (minute 11). MIN.MAX: percentage difference between the lowest pre-OTI level and the highest post-OTI level. INTUBATION: percentage difference between the immediate pre-OTI level (minute 6) and the post-OTI level.")
Haemodynamic variables. X axis: time in minutes. Y axis: value of HR×MAP (product of heart rate [HR] multiplied by mean arterial pressure [MAP]). Thin horizontal line: baseline HR×MAP. Thin vertical line: orotrachael intubation (OTI), at 6min. Dotted line: evolution of HR×MAP over study time. Arrows: HR×MAP values compared to calculate each variable. MIN: minimum pre-OIT level. MAX: maximum post-OTI level. END: level at end of study (minute 11). MIN.MAX: percentage difference between the lowest pre-OTI level and the highest post-OTI level. INTUBATION: percentage difference between the immediate pre-OTI level (minute 6) and the post-OTI level.
The variables for haemodynamic changes at each stage of the study were grouped into a single variable (SUM) by means of the following formula:
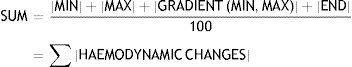
The percentage of patients with values of over 150% in the GRADIENT (MIN, MAX) (main study variable) and INTUBATION variables, or below 50% in the END variable was, also recorded.
Hypotension events were recorded (defined as MAP below 50mmHg and/or 50% below baseline levels).
Statistical analysisThe sample size (at least 137 patients per group) was based on the findings of a pilot project in 65 patients randomised into two parallel groups to achieve a confidence interval of 95% and a statistical power of 80%.
Data are expressed as mean±standard deviation or median (interquartile range). Variables were tested for normal distribution with the Kolmogorov–Smirnov–Lilliefors test. The Student's t test was used to compare quantitative variables, and the chi-square test was used for qualitative variables. The GRADIENT (MIN, MAX) varied in each group, and was therefore analysed using the U Mann–Whitney test. A p value of <0.05 was considered statistically significant. Statistical analysis was performed on SPSS® version 15.0. (SPSS Inc., Chicago, IL, USA).
ResultsA total of 280 patients were included in the study: 139 in group S and 137 in group MM. Four patients abandoned the study (two prior to randomisation, and one patient from each group after randomisation).
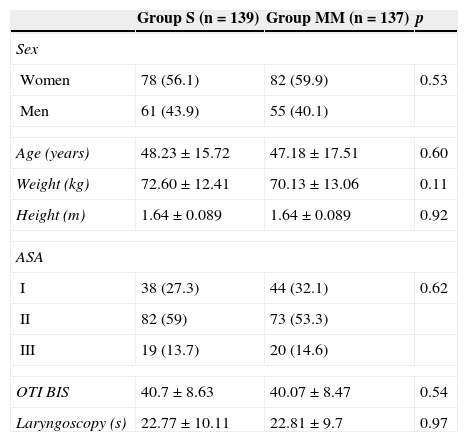
The demographic data, ASA, duration of OTI manoeuvres, and level of sedation during OTI (both related to the intensity of nociceptive pain during OTI) were all comparable between groups (Table 1). The target sedation level (BIS 35–55) was achieved earlier in the MM vs the S group (1.92±0.6 vs 2.39±0.96min; p<0.001).
Characteristics of the study population and of intubation.
| Group S (n=139) | Group MM (n=137) | p | |
|---|---|---|---|
| Sex | |||
| Women | 78 (56.1) | 82 (59.9) | 0.53 |
| Men | 61 (43.9) | 55 (40.1) | |
| Age (years) | 48.23±15.72 | 47.18±17.51 | 0.60 |
| Weight (kg) | 72.60±12.41 | 70.13±13.06 | 0.11 |
| Height (m) | 1.64±0.089 | 1.64±0.089 | 0.92 |
| ASA | |||
| I | 38 (27.3) | 44 (32.1) | 0.62 |
| II | 82 (59) | 73 (53.3) | |
| III | 19 (13.7) | 20 (14.6) | |
| OTI BIS | 40.7±8.63 | 40.07±8.47 | 0.54 |
| Laryngoscopy (s) | 22.77±10.11 | 22.81±9.7 | 0.97 |
ASA: American Society of Anaesthesia; OTI BIS: bispectral index level immediately prior to orotrachael intubation; Laryngoscopy: duration (in seconds) of intubation manoeuvres; MM: Modified Marsh; S: Schnider.
Values expressed a mean±standard deviation or n (percentage). The p values show no statistically significant inter-group differences in any of the variables.
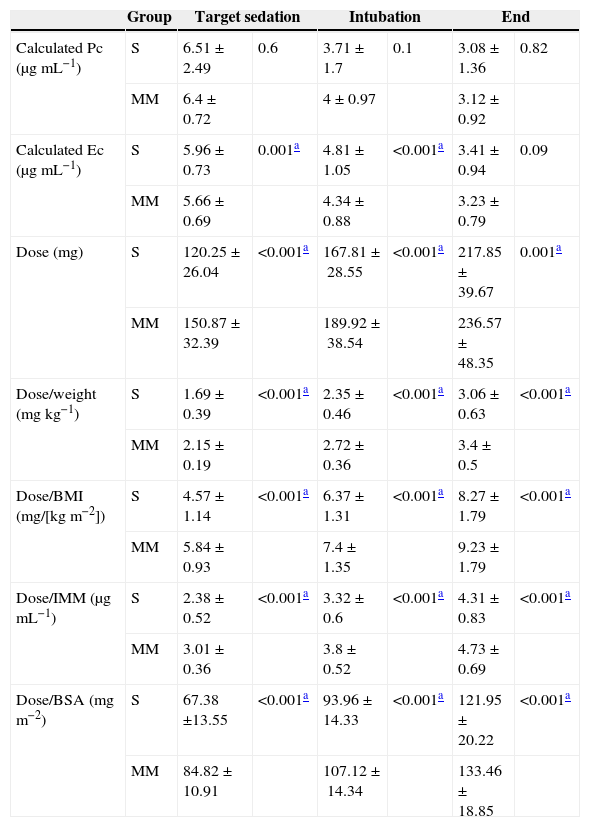
Propofol dose was significantly higher in the MM group at the time of target sedation, during OTI, and at the end of the study. Calculated Ec was significantly higher in the S group at the time of target sedation and during OTI (Table 2).
Propofol dose and concentrations.
| Group | Target sedation | Intubation | End | ||||
|---|---|---|---|---|---|---|---|
| Calculated Pc (μgmL−1) | S | 6.51±2.49 | 0.6 | 3.71±1.7 | 0.1 | 3.08±1.36 | 0.82 |
| MM | 6.4±0.72 | 4±0.97 | 3.12±0.92 | ||||
| Calculated Ec (μgmL−1) | S | 5.96±0.73 | 0.001a | 4.81±1.05 | <0.001a | 3.41±0.94 | 0.09 |
| MM | 5.66±0.69 | 4.34±0.88 | 3.23±0.79 | ||||
| Dose (mg) | S | 120.25±26.04 | <0.001a | 167.81±28.55 | <0.001a | 217.85±39.67 | 0.001a |
| MM | 150.87±32.39 | 189.92±38.54 | 236.57±48.35 | ||||
| Dose/weight (mgkg−1) | S | 1.69±0.39 | <0.001a | 2.35±0.46 | <0.001a | 3.06±0.63 | <0.001a |
| MM | 2.15±0.19 | 2.72±0.36 | 3.4±0.5 | ||||
| Dose/BMI (mg/[kgm−2]) | S | 4.57±1.14 | <0.001a | 6.37±1.31 | <0.001a | 8.27±1.79 | <0.001a |
| MM | 5.84±0.93 | 7.4±1.35 | 9.23±1.79 | ||||
| Dose/IMM (μgmL−1) | S | 2.38±0.52 | <0.001a | 3.32±0.6 | <0.001a | 4.31±0.83 | <0.001a |
| MM | 3.01±0.36 | 3.8±0.52 | 4.73±0.69 | ||||
| Dose/BSA (mgm−2) | S | 67.38 ±13.55 | <0.001a | 93.96±14.33 | <0.001a | 121.95±20.22 | <0.001a |
| MM | 84.82±10.91 | 107.12±14.34 | 133.46±18.85 | ||||
MM: Modified Marsh; S: Schnider.
Calculated proposal dose and concentrations at three key study time points: at bispectral sedation level of 25–55 (target sedation), at intubation (intubation), and at study end (end). Values expressed a mean±standard deviation.
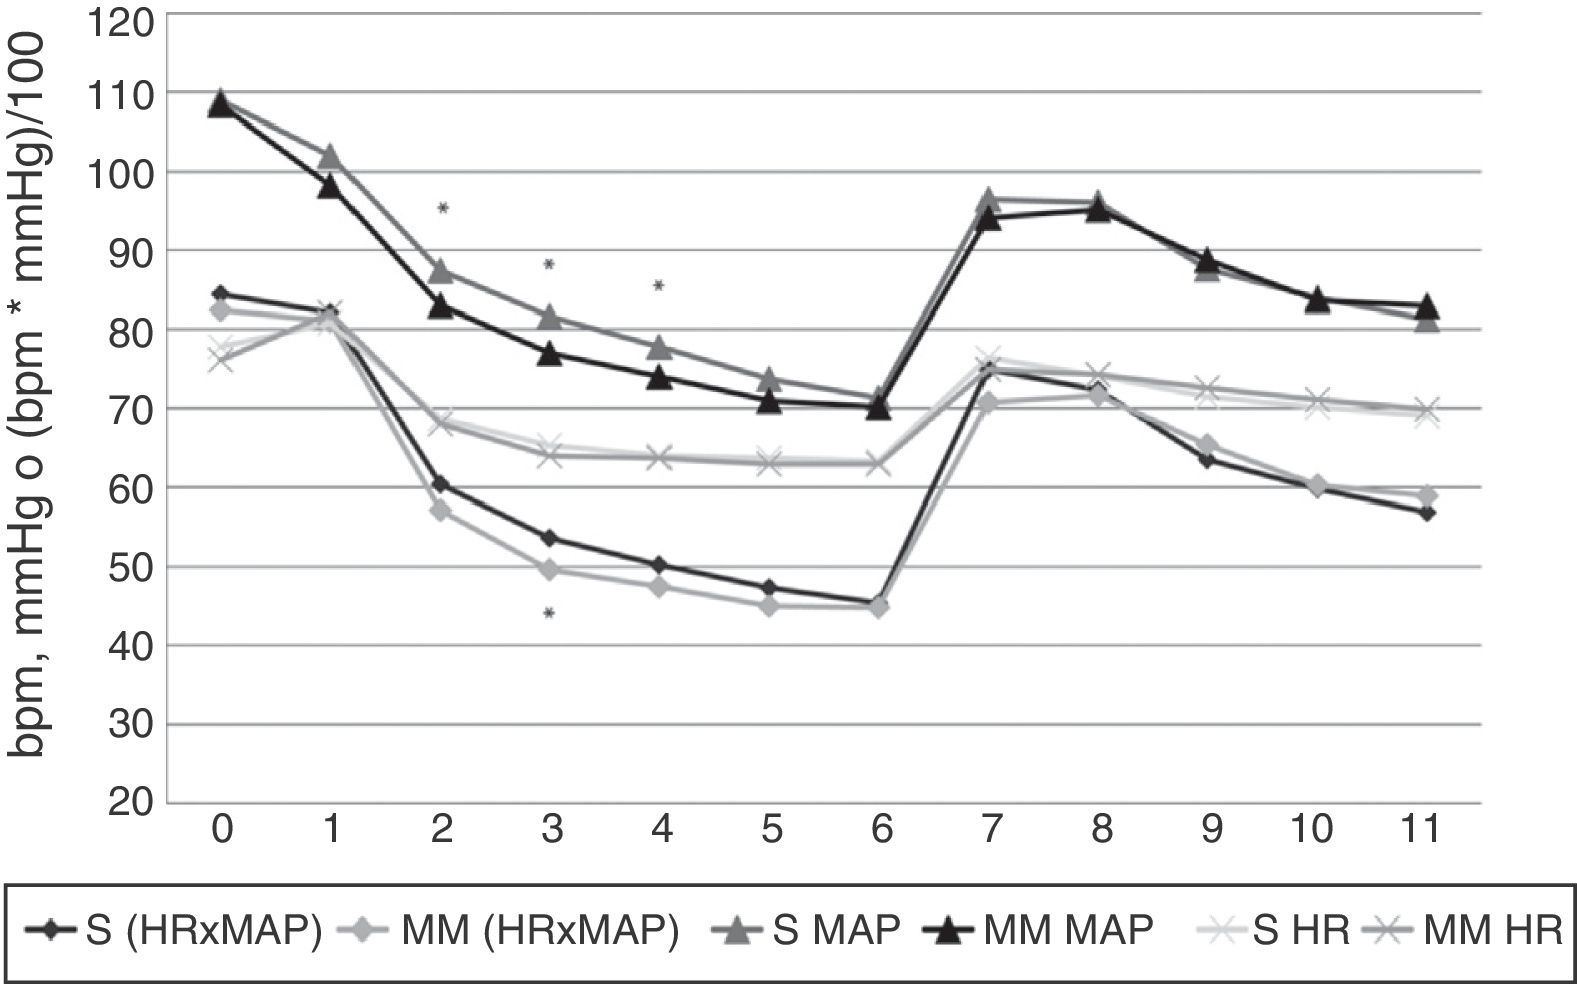
Significant differences in haemodynamic parameters were only observed in MAP at 2, 3 and 4min, and in HR×MAP at 3min, where they were significantly lower in the MM group (Figures 3 and 4). Hypotension events were also more frequent in this group, although this was not statistically significant (17.3% vs 12.8%, respectively).
 in beats per minute (bpm), mean arterial pressure (MAP) in mmHg or product of HR by MAP (HR×MAP) in bmp by mmHg divided by 100. S: Schnider group values. MM: Modified Marsh group values. Values correspond to the arithmetic mean. Statistically significant differences were found, marked with an asterisk, in HR×MAP (p=0.022) at minute 3, and MAP at minutes 2, 3 and 4 (with p values of 0.02, 0.01 and 0.025, respectively); all the MM group values were lower than those of the S group.")
Heart rate, mean arterial pressure and HR×MAP findings. X axis: time in minutes. Y axis: heart rate (HR) in beats per minute (bpm), mean arterial pressure (MAP) in mmHg or product of HR by MAP (HR×MAP) in bmp by mmHg divided by 100. S: Schnider group values. MM: Modified Marsh group values. Values correspond to the arithmetic mean. Statistically significant differences were found, marked with an asterisk, in HR×MAP (p=0.022) at minute 3, and MAP at minutes 2, 3 and 4 (with p values of 0.02, 0.01 and 0.025, respectively); all the MM group values were lower than those of the S group.
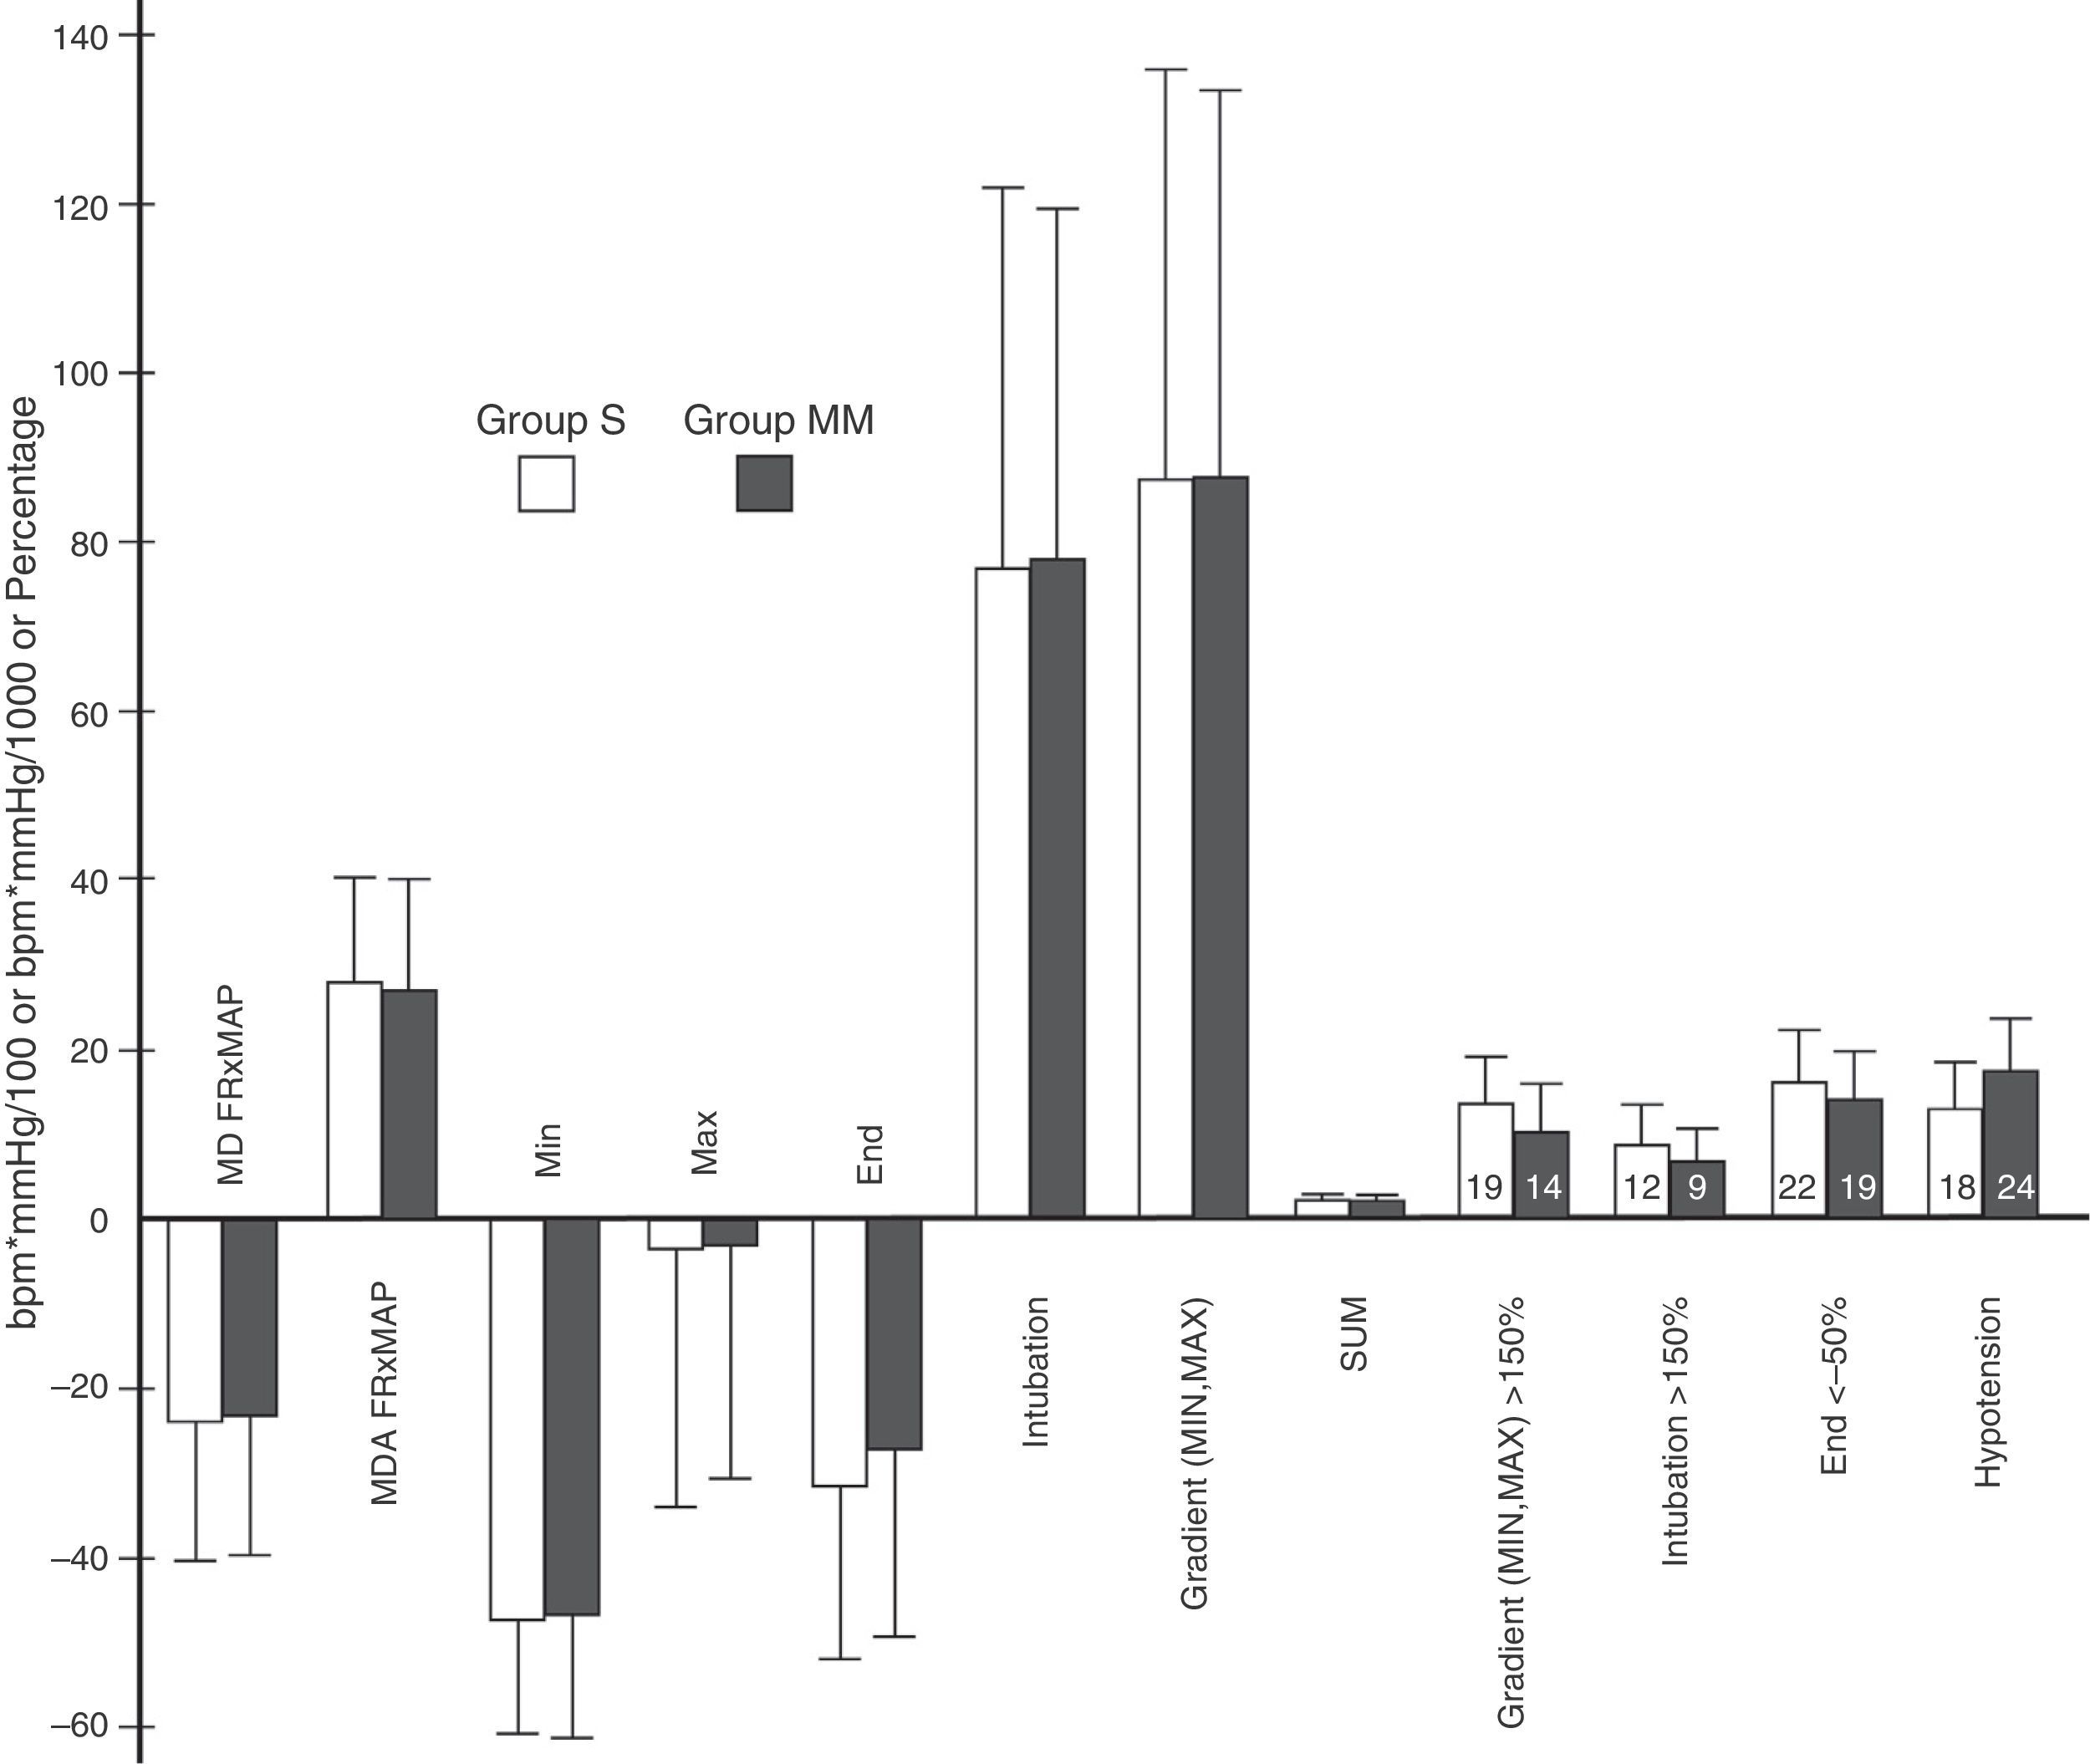
 multiplied by mean arterial pressure in mmHg divided by 100 or by 1000 in the case of the SUM variable or percentage. The height of the rectangle represents the mean or percentage, and the error bars represent the standard deviation or 95% confidence interval. The number inside each rectangle refers to the number of patients. MD, HR×MAP: mean difference between HR×MAP at each time point (minute) and baseline value. MAD, HR×MAP: mean of the absolute difference between HR×MAP at each time point (minute) and at baseline. MIN: difference between lowest pre-OTI HR×MAP value and baseline. MAX: difference between highest post-OTI HR×MAP value and baseline. END: difference between study-end OTI HR×MAP value (minute 11) and baseline. INTUBATION: difference between the immediate pre-OTI value (minute 6) and the post-OTI value. MIN.MAX: percentage difference between the lowest preintubation and the highest postintubation values. SUM: sum of the absolute values of MIN, MAX, MIN.MAX and END, divided by 100. The variables GRADIENT (MIN, MAX)>150% INTUBATION>150% and END<50% represent the percentage of patients presenting values above 150% in the first 2, and 1 below 50% in the last. The variable HYPOTENSION represents the percentage of patients presenting hypotension, by group. No statistically significant inter-group differences were found in these variables. p values were, respectively: 0.72, 0.54, 0.7, 0.91, 0.91, 0.84, 0.96, 0.54, 0.46, 0.65, 0.75 and 0.29.")
Variables obtained from heart rate×mean arterial pressure. Variables derived from HR×MAP. Y axis: heart rate in beats per minute (bpm) multiplied by mean arterial pressure in mmHg divided by 100 or by 1000 in the case of the SUM variable or percentage. The height of the rectangle represents the mean or percentage, and the error bars represent the standard deviation or 95% confidence interval. The number inside each rectangle refers to the number of patients. MD, HR×MAP: mean difference between HR×MAP at each time point (minute) and baseline value. MAD, HR×MAP: mean of the absolute difference between HR×MAP at each time point (minute) and at baseline. MIN: difference between lowest pre-OTI HR×MAP value and baseline. MAX: difference between highest post-OTI HR×MAP value and baseline. END: difference between study-end OTI HR×MAP value (minute 11) and baseline. INTUBATION: difference between the immediate pre-OTI value (minute 6) and the post-OTI value. MIN.MAX: percentage difference between the lowest preintubation and the highest postintubation values. SUM: sum of the absolute values of MIN, MAX, MIN.MAX and END, divided by 100. The variables GRADIENT (MIN, MAX)>150% INTUBATION>150% and END<50% represent the percentage of patients presenting values above 150% in the first 2, and 1 below 50% in the last. The variable HYPOTENSION represents the percentage of patients presenting hypotension, by group. No statistically significant inter-group differences were found in these variables. p values were, respectively: 0.72, 0.54, 0.7, 0.91, 0.91, 0.84, 0.96, 0.54, 0.46, 0.65, 0.75 and 0.29.
Our main aim in this study was to show that haemodynamic changes during anaesthesia induction and intubation depend on the Ec TCI model for propofol used. However, we found no relevant differences between our two study groups.
The Ec TCI models for propofol used in the study differ insofar as the calculation on which the Schnider24,25 model is based takes into account patient weight, height, lean body mass and age, while the Modified Marsh17,23 model (derived from the Marsh model27) only takes into account patient weight. The dose, delivery rate (particularly at the start of infusion) and calculated concentrations also differ in these models; the Modified Marsh17,23 model delivers a higher dose at a faster rate, for lower effect-site concentrations.
The only statistically significant differences observed between groups were a decline in MAP (at 2, 3 and 4min) and HR×MAP (at 3min) in the MM group. These differences, however, are not clinically relevant, since the greatest decline in levels was recorded at 6min (immediately prior to OTI), and at this time point, both models tend to converge, with identical HR, MAP and HR×MAP curves (Figure 3).
Throughout the study, HR, MAP and HR×MAP followed the same trend; decline from the start of infusion until OIT, rapid increase immediately prior to OIT to levels only slight below baseline, followed by a decline to levels only slightly above pre-OIT.
No significant differences were observed in HR×MAP variables (Figure 4). GRADIENT (MIN, MAX) and SUM variables were also comparable between groups. These are extremely significant, since GRADIENT (MIN, MAX) measures the maximum variation in HR×MAP (comparing the highest post-OTI level with the lowest pre-OTI level), and SUM summarises the changes during the process, taking into account key study time points (pre- and post-OTI, and end of OIT).
Overall, hypotension occurred in 15% of patients, a finding that is largely in line with other studies.9 Although the frequency of hypotension events was slightly higher in the MM group, this was not statistically significant (Figure 4).
The similarity between the haemodynamic patterns in both groups echo the findings of Viterbo et al.,22 although in our study the theoretical differences in administered dose described in the studies developing these TCI models for propofol17,23–25 were maintained. This is probably due to the fact that Viterbo et al. used an initial target Ec of just 1.5μgmL−1. This was gradually increased until a BIS level of 50 was reached, by which time the difference between models had been minimised.
The dose, calculated concentration, and rate of administration were similar to the values previously described in the literature,26 therefore, any differences between the models were minimised at the end of the study. This was probably due to the fact that we were approaching the maintenance infusion rate stage of anaesthesia, in which the differences between models are less evident.
We also observed that variations in target Ec needed to maintain sedation levels differed between groups. The MM group usually required less Ec than initial levels, while in the S group this initial Ec concentration of 6μgmL−1 needed to be maintained, and even increased. In other words, in the Schnider model more time is needed to deliver the doss required to achieve the target level of sedation. However, although the MM group received a higher dose at a faster rate of administration than the S group, haemodynamic patterns between the two were largely similar.
We decided to use the product of MAP and of HR to represent haemodynamic changes. This also allowed us to define a series of variables that measured certain key time points that were later analysed in more detail.
Our study has two limitations: it was not a blinded study, and invasive haemodynamic monitoring was not used. The steps needed to blind the attending anaesthesiologist to the TCI method would have been complicated, and probably unsafe. We did not use invasive monitoring since neither the status of the patients nor the surgery performed justified this approach.
Another drawback was our inability to adjust the anaesthetic dose to the specific needs of each patient, a factor that could in some cases have affected haemodynamics. In the future, we hope to be able to use validated analgesia monitors. Despite this, we believe that our results can be extrapolated to routine clinical practice due to our large sample size and the wide variety of patients and surgical procedures.
To conclude, we cannot recommend one model as being superior to the other in terms of improving haemodynamic changes during anaesthesia induction and intubation, since haemodynamic patterns were similar in both TCI models for propofol studied. Nevertheless, the Modified Marsh model could be the better option for faster, more comfortable induction. We believe that our study can be of interest for future researchers engaged in the development of the type of closed anaesthesia circuits that have recently been introduced.28–30
FundingThe study has not received any kind of funding or grants.
Conflict of interestThe authors declare they have no conflicts of interest.
Please cite this article as: Ramos Luengo P, Asensio Merino F, Castilla MS, Alonso Rodriguez E. Comparación de la respuesta hemodinámica durante la inducción y la intubación con 2 modelos de infusión controlada por objetivo en el sitio de efecto para propofol: estudio prospectivo y aleatorizado. Rev Esp Anestesiol Reanim. 2015;62:487–494.
