


Cardiac magnetic resonance imaging (cMRI) provides abundant morphological and functional information in the study of congenital heart disease. The functional information includes pulmonary output and systemic output; the ratio between these two (Qp/Qs) is the shunt fraction. After birth, in normal conditions the pulmonary output is practically identical to the systemic output, so Qp/Qs=1. In patients with “shunts” between the systemic and pulmonary circulations, the ratio changes, and the interpretation of these findings varies in function of the location of the shunt (intracardiac or extracardiac) and of the associated structural or postsurgical changes. We review the concept of Qp/Qs; the methods to calculate it, with special emphasis on cMRI; and the meaning of the results obtained. We place special emphasis on the relevance of these findings depending on the underlying disease and the treatment the patient has undergone.
La resonancia magnética cardiaca aporta abundante información morfológica y funcional al estudio de las cardiopatías congénitas. Entre los datos funcionales se encuentran el gasto pulmonar y el gasto sistémico; el cociente entre ambos es el cociente Qp/Qs. Después del nacimiento, en condiciones normales el gasto pulmonar y el sistémico son prácticamente iguales, y el cociente Qp/Qs=1. En los pacientes con cortocircuitos entre la circulación sistémica y la pulmonar este cociente se altera. Dependiendo de la localización del cortocircuito (intra o extracardiaco), y de las alteraciones estructurales o posquirúrgicas asociadas, la interpretación de los hallazgos es diferente. Revisamos el concepto de Qp/Qs, los métodos para calcularlo con especial énfasis en la RM, y el significado de los resultados obtenidos, haciendo hincapié en la relevancia de estos datos dependiendo de la patología de base y los procedimientos terapéuticos que se hayan realizado al paciente.
Cardiac output (CO) can be defined as the volume pumped by the heart per unit of time.1 It is made up by the systemic and pulmonary blood flows. There are small physiological differences between both flows for instance bronchial circulation, insignificant in practice and thus the ratio between both equals 1. This is called the pulmonary–systemic ratio or Qp/Qs ratio. If >1 the pulmonary flow is greater than the systemic one, and the opposite is true if it is <1. We reviewed the concept of Qp/Qs, how to calculate it, especially through magnetic resonance (MR), the meaning of the findings and its repercussions on the prognosis and management of patients.
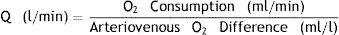
Measuring the Qp/Qs ratioThe reference method from the beginning of the 20th century is Fick's method1 consisting on measuring the concentration of oxygen in blood samples obtained with a catheter at different points of the pulmonary and systemic circulation after 10min of breathing with oxygen at 100%. It is calculated through the following formula:
This way it is possible to characterize the decrease in oxygen concentration as due to intrapulmonary or intracardiac shunts or due to hypoventilation or ventilation/perfusion impairments. Although it implies making some physiological assumptions not fully correct – above all that oxygen consumption is homogeneous it is the standard modality by which all other modalities are measured. Other modalities are thermodilution2 or the measurement of dye dilution3 (indocyanine) based on variations or changes of concentration of indicators proximal and distal to the shunt for the measuring of shunts.4 They are invasive modalities of a low sensitivity to measure small-sized shunts.
Image modalities to calculate the Qp/QsThe first image modality used to calculate Qp/Qs was nuclear medicine5,6 through the endovascular administration of an isotope and the subsequent measurement of its activity. Although it measures the shunts relatively accurate it contributes ionizing radiations not allowing the identification of the location of the shunt.
Echocardiography is the modality of choice for the initial diagnosis of most cardiac shunts. It is innocuous and non-invasive, and it allows a complete morphological study of the heart. The use of Doppler is very well-known for the quantification of shunts7–11 though the calculation of Qp/Qs through Doppler ultrasound has some limitations: the operator dependence typical of ultrasound studies and the limitations of the acoustic window for an adequate assessment of the right ventricular outflow tract and the pulmonary trunk.
Cardiac magnetic resonance images (MRI) were first used in the 1990s to estimate the Qp/Qs with the use of phase contrast sequences. In addition to its excellent spatial and contrast resolution and accuracy in calculating ventricular function, it is extremely good for the study of vascular flow both for assessing gradients and stenosis and for calculating Qp/Qs.
Measuring Qp/Qs through an MRIThere are two methods to measure Qp/Qs through an MRI:
Calculation of the CO through Simpson's method. It deals with obtaining the ventricular volumes along the cardiac cycle through cine-MRIs.12 If we know the telediastolic volume (tdV), the telesystolic volume (tsV) and the heart rate it is possible to the calculate cardiac output easily:

The ratio between the right and left CO will correspond to the Qp/Qs ratio.
There are several setbacks inherent to this modality and these are non-specific for the calculation of Qp/Qs: anatomical complexity for the accurate calculation of the right ventricle volumes or the inclusion of papillary muscles. An accurate calculation of the Qp/Qs through this modality requires the integrity of the four (4) ventricular valves. Failure in any of the four will add the regurgitating volume to the telediastolic one and will invalidate results. We need to bear in mind that tricuspid failure is common in patients with right overload.
Calculation of the CO through phase contrast sequences/images. Although its clinical use began at the end of the 1980s13–15 it was first described in 1959 in the field of animal experimentation.16 It is based on the phase change undergone by moving protons (coming from another location) with respect to stationary tissues. These sequences/images are very similar to the Doppler effect though its physical principles are totally different.
Phase contrast sequences make two different measurements, one with a bipolar gradient (of identical magnitude, on the same plane/view but in opposite directions) and the other one without this gradient. With the two packages of data and through mathematical calculations, the MRI machine determines which protons (voxels) have not changed their position (the signal is identical in the two measurements), which ones move in the same direction as the gradient (in the negative or positive direction) and how fast they move. The MRI operator must determine the direction of the flow she/he wants to measure (craniocaudal, anterior–posterior or right–left), which indicates to the machine the direction of the bipolar gradient that needs to be applied. The sequence is made contributing as a parameter the expected blood velocity in that vessel (in cm/s) that the machine calculates as gradient intensity. For an in-depth reading of the physics and the technique of this sequence we will refer the reader to specific articles.17 The MRI machine offers one package of anatomical images (of magnitude) and another package of the velocity (or phase) representing the flow in a similar way to the Doppler ultrasound (Fig. 1). Usually the flow is white in one direction and black in the other being the stationary tissue represented by a gray background and noise. It is a cyclical phenomenon that has nothing to do with the change of frequency but rather with the phase. Thus parameters need to be adjusted to the flow velocity to be studied, since it experiences aliasing artifacts if velocity is higher than expected and curves with not enough data (noise) if velocity is lower (Fig. 2).
 and phase image (B) in a phase contrast acquisition in the pulmonary artery trunk. In the phase image the ascending flow is white and the descending one is black. AoA: ascending aorta; AoD: descending aorta; AP: pulmonary artery.")
, 100m/s (B) and 50m/s speed sequences/images (C). With a very high speed selection (A) the sequence has a low signal and the curve is not very accurate. With an adequate speed selection (B), the ascending and descending flows can be easily identified and the curve shows adequate morphology and scale. If the speed selection is too low (C) then we are in the presence of aliasing and there is “descending” (black) flow in the aortic valve and a curve that cannot be interpreted with negative speed values in systole.")
Effect of the speed selection in the phase contrast image in the aortic valve; 400m/s (A), 100m/s (B) and 50m/s speed sequences/images (C). With a very high speed selection (A) the sequence has a low signal and the curve is not very accurate. With an adequate speed selection (B), the ascending and descending flows can be easily identified and the curve shows adequate morphology and scale. If the speed selection is too low (C) then we are in the presence of aliasing and there is “descending” (black) flow in the aortic valve and a curve that cannot be interpreted with negative speed values in systole.
Temporal resolution is also important,17 so at least 30 measurements should be obtained during the cardiac cycle. To have enough signal and data it cannot be applied to small caliber blood vessels (approximately <2mm in diameter) or to thicknesses of an excessively fine cut (at least 5mm). There are alterations in the output if the examination is performed in apnea, either in inspiration or in expiration. The error is considerably greater in inspiration. It is recommended that the acquisition is made with the patient breathing freely18 training them how to make soft, constant respiratory exchanges without sudden move, deep inhalations or coughing.
The contrast phase sequence is usually planned in the pulmonary artery trunk and the aortic root. The velocity to perform the sequence can be determined knowing echocardiography data from the patient's history or trying with a sequence at a very high velocity to estimate the approximate peak velocity and then repeating the sequence/image with this adjusted velocity. For measuring the Qp/Qs it is practical to initially obtain the sequence in the pulmonary artery at 150cm/s and in the aorta at 200cm/s that can vary in the presence of aliasing or poor signal. For the adequate planning of the cut plane/view two orthogonal locating planes should be used (Fig. 3). Although they can be used as reference or to locate the valvular veli, the cine MRI sequences of the right ventricle outflow tract and the aortic outflow (3 chambers) should not be used. The usual software for calculating the velocities does not have angle correction and this is why the acquisition plane/view needs to be perpendicular to the direction of flow.17,19 An inadequate acquisition view will lead to erroneous calculations of both the output and the Qp/Qs.
 in sagittal (A) and coronal (B) views; 2D-balanced image in a 3-chamber view (C) and phase image (D) of the aortic valve. The adequate planning takes place above the valve by placing the acquisition plane/view perpendicular to the direction of flow in two (2) orthogonal views (white lines in A and B). The 3-chamber view is used as the only reference and even though we can adequately see the valve the view will not be perpendicular to the flow (black lines in A and B), there will be an error of calculation in the speeds and therefore in the flow. Similarly this principle can be applied to all valves, vessels, and conduits.")
Steady-state images (3D-balanced FFE) in sagittal (A) and coronal (B) views; 2D-balanced image in a 3-chamber view (C) and phase image (D) of the aortic valve. The adequate planning takes place above the valve by placing the acquisition plane/view perpendicular to the direction of flow in two (2) orthogonal views (white lines in A and B). The 3-chamber view is used as the only reference and even though we can adequately see the valve the view will not be perpendicular to the flow (black lines in A and B), there will be an error of calculation in the speeds and therefore in the flow. Similarly this principle can be applied to all valves, vessels, and conduits.
Once the sequence is obtained, the measurement of flow is conducted with phase and magnitude images. It can be measured using the equipment software or the usual workstation or several other computer programs. It is important to check the vessel contour in all cuts and not just leave it exclusively to the automatic software of the workstations since flow is calculated based on the velocity and the area–an error in the calculation of flow will therefore be proportional to the square of the radius. The output data are obtained by multiplying the ejection volume (the volume circulating across the vessel in each heart beat) by the heart rate. In the pulmonary artery this number is the pulmonary output (Qp); in the aortic root the systemic output (Qs) and the ratio is Qp/Qs.
Although there are errors inherent to the modality and secondary to cardiac movement and physiology,12,20 phase contrast sequences are usually obtained in the pulmonary artery trunk and the aortic root above the aortic sinus. So there is a systematic error in the systemic measurement of flow due to the non-inclusion of the coronary flow that can be representative of around 1% of the output.21 Also there are differences ranging from 2% to 5% between systemic and pulmonary circulation when measured through phase contrast–a fact that should be recognized as an internal error of the test.17,22 Nevertheless its diagnostic accuracy has been validated vs the oximetry23–25 and other dilution modalities,26 nuclear medicine27 or ultrasound.28 As we will see later on in some special circumstances, such as univentricular surgery the systemic and pulmonary outputs are measured differently.
Clinical utility of the Qp/Qs ratioThe measurement of the pulmonary and systemic output ratio informs about the integrity of the independence of these two circulations. If >1 there is passage of systemic blood into the pulmonary circulation, and if <1 from pulmonary to systemic circulation. This is very helpful when quantifying shunts and studying associated complications. In the consensus guidelines on the use of cardiac MRIs the study of shunts is an established indication.29
Intra-cardiac shuntsThe Qp/Qs is a piece of information of great physiopathological and clinical importance in intracardiac shunts. Most of these malformations do not require MRIs when it comes to management. Nevertheless in some situations it is necessary to use image modalities to better describe the lesion anatomically and assess its functional repercussion especially for the quantification of the shunt. We describe the measurement of Qp/Qs in simple intracardiac shunts (septal defects). In complex malformations including univentricular heart, double outflow right ventricle, transposition with ventricular septal defect, etc. the analysis of both the systemic and pulmonary flows should include different variables.
Intra-atrial communication (IAC). During fetal life and the first moments after birth, pulmonary circulation shows high resistance and the right heart is less distensible than the left one and pressure on the right atrium is greater than that exerted on the left one. The foramen ovale is the physiological IAC during fetal life. The pressure falls within the right cavities when the neonate baby begins to breathe makes the foramen ovale to close. The IAC is an anomalous communication between the atria. Its clinical relevance, prognosis and treatment are based on the size and type of communication:
- 1.
Patent foramen ovale–usually small and self-limited. It can be identified in the majority of neonate babies though it is closed in 80% of adults. It does not usually have any clinical relevance.
- 2.
Ostium secundum IAC–due to a defect in the septum primum. It is the most common IAC after the foramen ovale in children and on a large extent prognosis depends on its size. Spontaneous closure occurs in more than half of those <5mm; it is variable between 5 and 10mm and almost never occurs in defects >10mm.30
- 3.
Ostium primum IAC–it is a variant of the common atrioventricular canal consisting of a defect between the foramen ovale and the atrioventricular valves. It is associated with other more serious malformations of the AV canal-type, anomalies in the circulatory system, etc., and requires treatment.
- 4.
Venous sinus type of intra-atrial communication (IAC). It is in an anomaly in the formation of the pulmonary veins at the entry of the left atrium associated with a septal defect posterior to the foramen ovale. The pulmonary veins enter the posterior side of the vena cava and leave an adjacent IAC. They require surgical correction since spontaneous closure will not happen and it is a shunt of considerable volume. There are two types: superior (associated with a partial anomalous pulmonary venous return of the right superior lobe and medium lobe veins) and inferior (with anomalous venous return of the right inferior lobe).
- 5.
Coronary sinus type of IAC. It is a very rare malformation. It can be defined as the absence of the coronary sinus roof that communicates with the left atrium floor. It is often associated with persistent left superior vena cava.
- 6.
Common atrium–usually associated with heterotaxy syndrome.
Clinical presentation, prognosis and treatment depend on the type and size of IAC. The ostium primum, sinus venosus, coronary sinus or common atrium type of IACs are malformations that require surgical treatment since they do not close spontaneously and can bring about long-term issues. Most IACs are asymptomatic until adulthood and they are usually found when performing an ECG on a patient with an incidental murmur. Long-term clinical complications are due to right chronic overload causing a series of changes in the right ventricle that can lead to ventricular failure, arrhythmias and pulmonary hypertension. These complications are exceptional in infants and young children.
The importance of calculating the Qp/Qs is based on supporting the indication or contraindication of the treatment whether it is surgical or percutaneous closure. The pulmonary flow (Qp) is measured in the pulmonary trunk above the valve while the systemic flow (Qs) is measured above the aortic sinus. Either the presence of hemodynamically significant defects or the existence of paradoxical embolisms is the main indication for treatment. Hemodynamically significant defects are those with Qp/Qs>1.5 (Fig. 4). Significant anatomical defects (large sinus venosus, ostium primum, ostium secundum type of IACs) are treated in the young child without the need for an MRI. Pulmonary hypertension is not a contraindication of the IAC closure as long as the pulmonary pressure is less than two thirds that of the systemic one. When pulmonary pressure surpasses the systemic one and the shunt is reversed (Eisenmenger syndrome) the shunt becomes the exhaust valve of a serious pulmonary hypertension. This is one of the most important aspects of Qp/Qs measurement in intracardiac shunts: with Qp/Qs<1 closure is contraindicated. The presence of clinical or radiological signs is a measurement indication of Qp/Qs through MRI (Fig. 5). Nevertheless shunt correction has been described in patients with Eisenmenger syndrome using pulmonary vasodilators such as sildenafil.31
 and anomalous pulmonary venous partial return of middle lobe and upper right return toward the superior cava. In the image of black blood in the axial view (A and B) one anomalous vessel can be seen entering the superior cava vein (arrow) as well as the IAC in a high position (arrow head). The anomalous pulmonary veins entering the cava vein (arrows) can be clearly seen in the processing of the contrast (C) angiography. The measurements of both the pulmonary (D) and aortic (E) flows were carried out multiplying the volume of ejection by the heart frequency (red circles). Qp=89.5cc/beat×94beat/min=8.413cc/min; Qs=27.1cc/beat×95beats/min=2.575cc/min; Qp/Qs=8.413/2.575=3.27.")
Patient with venous sinus type of intra-atrial communication (IAC) and anomalous pulmonary venous partial return of middle lobe and upper right return toward the superior cava. In the image of black blood in the axial view (A and B) one anomalous vessel can be seen entering the superior cava vein (arrow) as well as the IAC in a high position (arrow head). The anomalous pulmonary veins entering the cava vein (arrows) can be clearly seen in the processing of the contrast (C) angiography. The measurements of both the pulmonary (D) and aortic (E) flows were carried out multiplying the volume of ejection by the heart frequency (red circles). Qp=89.5cc/beat×94beat/min=8.413cc/min; Qs=27.1cc/beat×95beats/min=2.575cc/min; Qp/Qs=8.413/2.575=3.27.
 Cardiomegaly chest X-ray and larger caliber of pulmonary arteries suggestive of pulmonary hypertension. This finding should trigger all the alarms when it comes to the need for calculating the Qp/Qs before surgery. (B) Steady state image in a 4-chamber view/plane in ventricular systole showing a large IAC. The measurement of the Qp/Qs was 1.3–very low given the importance of the anatomic defect. Even though it is compatible with pulmonary hypertension this is not suggestive of shunt inversion (Eissenmenger syndrome).")
Fifty-two-year old patient with a late diagnosis of ostium secundum-type of IAC. (A) Cardiomegaly chest X-ray and larger caliber of pulmonary arteries suggestive of pulmonary hypertension. This finding should trigger all the alarms when it comes to the need for calculating the Qp/Qs before surgery. (B) Steady state image in a 4-chamber view/plane in ventricular systole showing a large IAC. The measurement of the Qp/Qs was 1.3–very low given the importance of the anatomic defect. Even though it is compatible with pulmonary hypertension this is not suggestive of shunt inversion (Eissenmenger syndrome).
Interventricular communication (IVC). Although the anatomy of IVC is relatively simple, its classification and the consequences of its different types are way more complex.32 Based on its location ICV is classified as:
- 1.
Muscular IVC. They are the most common ones and they are ever more diagnosed due to the generalization of the ECG. They are self-limited when they are small. They occur in any locations of the interventricular septum but they are more usually apical and mid-septal and frequently multiple.
- 2.
Perimembranous IVC. They can affect both the ventricular inflow and outflow and thus the aortic valve or the AV valves.
- 3.
Yuxta-arterial IVC (also called supracristal or subarterial). It is located at the infundibulum of the ventricular outflow which generates a single outflow of both ventricles and continuity between the aortic and pulmonary valves.
Large IVC are surgical when they affect the cardiac valves and when accompanied by recurrent endocarditis or if they present ventricular overload with hemodynamic repercussion. Small septal defects in asymptomatic patients without overload can be managed conservatively.33 The usual scenario is surgical repair though endovascular procedures have been developed during the last few years. Surgical correction is recommended with Qp/Qs>1.7. Hemodynamic repercussion that indicates surgery, the method to quantify Qp/Qs, and considerations with respect to Eisenmenger syndrome are similar to what has already been reported in the IAC.
Other significant circumstances are those in which, in addition to an IVC there is pulmonary stenosis or atresia (Fallot's syndrome). Due to the restriction in blood outflow toward the pulmonary tree, the pressure on the right ventricle surpasses the pressure on the left ventricular in such a way that the Qp/Qs is <1. This causes deoxygenated blood to enter the systemic circulation causing the cyanosis typical in these patients before treatment. However if pulmonary stenosis is very significant or in the presence of pulmonary atresia due to aorticopulmonary collaterals the Qp/Qs can be >1 reflecting the seriousness of the collaterals and can be of prognostic value.34 In this case the Qp is measured in the pulmonary veins (see “Aorticopulmonary Collaterals in univentricular correction”).
Extra-cardiac shuntsThe measurement of systemic and pulmonary flows and the calculation of Qp/Qs also contribute information on the hemodynamic repercussion of extra-cardiac shunts. In order to interpret the data of flow correctly it is necessary to understand the physiopathology of the shunt.
Patent Ductus Arteriosus (PDA). The ductus arteriosus normally closes during the first hours of life. In 60% of premature infants under 28 weeks there is confirmation of a PDA that when systemic output decreases is associated with a higher frequency of necrotizing enterocolitis, intraventricular hemorrhage, chronic pulmonary disease, pulmonary hemorrhage and death. The diagnosis of PDA is performed through ECG in neonate babies and infants. In older children and adults other image modalities can be required even it can be an incidental finding while carrying out the image modality (computed tomography–CT, etc.). The ductus patency causes a systemic–pulmonary shunt from the descending aorta to the left pulmonary artery. Quantification of Qp/Qs cannot be interpreted the same way it is interpreted in an intracardiac shunt. The flow will be greater in the aorta than in the pulmonary artery so that one way to calculate the shunt volume is to subtract the pulmonary flow from the systemic one (Qshunt=Qs−Qp).12 In the case of shunt reversal (Eisenmenger), the pulmonary flow is greater than the systemic one. Another method used is measurement through an MRI of the relation between flow in the superior cava, the left CO and the flow of the descending aorta in order to obtain information about the amount of flow subtracted from the inferior systemic circulation (distal to the ductus). This quantitative data about the steal to the descending aorta circulation that cannot be directly calculated through ultrasound can be relevant for the indication of PDA closure in premature infants in order to avoid complications.35
Anomalous pulmonary venous return (APVR). Anomalous pulmonary venous return is the connection of pulmonary veins to a structure other than the left atrium. It is divided into supracardiac, cardiac and infracardiac depending on where the venous connection occurs. Total APVR is usually a pre- or perinatal diagnosis. However partial APVR can be diagnosed during pediatric age and even in adulthood and image modalities such as CT and MRI play significant roles in its diagnosis. MRI is the modality of choice to quantify the hemodynamic significance of shunts.36 It is evaluated in a similar way than intracardiac shunts because even though the anatomy and treatment of the defect are different hemodynamic repercussion (right overload, pulmonary hypertension) are the same as in IAC and IVC.
Aorticopulmonary collaterals in univentricular correction (Glenn and Fontan procedures). Univentricular correction is a surgical procedure common to several heart conditions in which the functioning of the heart as a systemic and pulmonary pump is not possible. Depending on this or that heart condition there are different variants (Norwood, Damus-Stansel, Glenn, Fontan) but the common end to them all is total cavopulmonary connection (Fontan) in which the heart becomes a single systemic ventricle and the pulmonary arterial tree is directly irrigated by the cava veins. Usually in a first stage (at age 3 or 4 months) the superior cava vein is termino-laterally connected to the right pulmonary artery (Glenn procedure or partial cavopulmonary connection) (Fig. 6A). In a 2nd step approximately at the ages of 3–5 the inferior circulation is connected through one duct to the pulmonary artery (Fontan procedure or total cavopulmonary connection) (Fig. 6B). One of the complications of this procedure is the formation of aorto-pulmonary collaterals prior to the completion of the total correction during the years in which only partial cavopulmonary connection is in place (Glenn procedure). The physiopathology of this complication though not fully understood is attributed to the existence of a humoral factor (hepatic putative factor) that in these patients does not circulate across pulmonary vascularization when the inferior cava vein and the suprahepatic veins flow returns directly to the systemic arterial circulation without passing through the pulmonary blood vessels.
 the superior cava vein (thick arrow) anastomoses with the right pulmonary artery (pulmonary arteries highlighted with thin arrows). The heart receives blood from the pulmonary veins and the inferior cava vein while working as a systemic pump only. After the total pulmonary connection or Fontan proceeding (B) the whole systemic venous circulation (except for the coronary sinus) directly irrigates the lungs through the cava veins. The patient has a double superior cava vein (thick white arrows) thus showing bidirectional Glenn anastomosis. The inferior cava vein connects to the right pulmonary artery through one duct (black arrow). The pulmonary artery (thin arrows) receives all its blood support from the systemic venous territory. The heart is still one systemic pump only but now getting the blood from the pulmonary veins.")
Processing images of angiography volumes through MRI in patients with systemic–pulmonary connection. In the patient with partial cavopulmonary connection or Glenn surgery (A) the superior cava vein (thick arrow) anastomoses with the right pulmonary artery (pulmonary arteries highlighted with thin arrows). The heart receives blood from the pulmonary veins and the inferior cava vein while working as a systemic pump only. After the total pulmonary connection or Fontan proceeding (B) the whole systemic venous circulation (except for the coronary sinus) directly irrigates the lungs through the cava veins. The patient has a double superior cava vein (thick white arrows) thus showing bidirectional Glenn anastomosis. The inferior cava vein connects to the right pulmonary artery through one duct (black arrow). The pulmonary artery (thin arrows) receives all its blood support from the systemic venous territory. The heart is still one systemic pump only but now getting the blood from the pulmonary veins.
These collaterals affect the prognosis of the disease because they pose a systemic-pulmonary shunt with the overload of a univentricular pathologic heart. The method for the non-invasive quantification of the amount of shunt through MRIs has been recently described.37 In the partial cavopulmonary connection the usual measurement of the Qp/Qs using the aorta and the pulmonary is not useful since the pulmonary flow comes from the superior cava vein and the aorta sends both the flow coming from the pulmonary veins and the inferior cava and the coronary sinus to the systemic vascularization. The correct measurement of the total pulmonary flow Qp (that the lungs receive both from the pulmonary arteries and the aorticopulmonary collaterals) is obtained by adding the pulmonary vein flow. The aorto-pulmonary collateral flow is obtained subtracting the flow of both pulmonary arteries from the Qp.38 This modality has proven to be of diagnostic utility for the quantification of shunts19,38 (Fig. 7). Although it is known that in these patients up to about 15–20% of pulmonary circulation comes from the aorta through the collaterals it is still arguably what the repercussion of the shunt is in prognosis; 30% of the flow through the collaterals has been reported as an indicator of poor prognosis.39
 in a 6-year old kid with left hypoplastic heart syndrome. Flow measurement in pulmonary arteries (A), superior pulmonary veins (B), and inferior pulmonary veins (C). In the angiographic images (left column) we can see the stenosis of the left pulmonary artery and the aortopulmonary collaterals stemming from the aortic arch and the descending aorta. The white lines show the position of the cut view in the planning of the phase contrast sequence/image over the angio-MRI. We obtained a total pulmonary flow in pulmonary veins of 2.2l/min, and a pulmonary flow across the pulmonary arteries of 1.5l/min; the shunt volume is therefore 0.7l/min. Please note how the direction of flow (and therefore its color in phase sequences) is reversed between left and right blood vessels and between veins and arteries. RPA: right pulmonary artery; LPA: left pulmonary artery; LIPV: left inferior pulmonary vein; RIPV: right inferior pulmonary vein; RSPV: right superior pulmonary vein; LSPV: left superior pulmonary vein.")
Shunt flow measurement shunt in univentricular surgery (Glenn partial cavopulmonary connection) in a 6-year old kid with left hypoplastic heart syndrome. Flow measurement in pulmonary arteries (A), superior pulmonary veins (B), and inferior pulmonary veins (C). In the angiographic images (left column) we can see the stenosis of the left pulmonary artery and the aortopulmonary collaterals stemming from the aortic arch and the descending aorta. The white lines show the position of the cut view in the planning of the phase contrast sequence/image over the angio-MRI. We obtained a total pulmonary flow in pulmonary veins of 2.2l/min, and a pulmonary flow across the pulmonary arteries of 1.5l/min; the shunt volume is therefore 0.7l/min. Please note how the direction of flow (and therefore its color in phase sequences) is reversed between left and right blood vessels and between veins and arteries.
RPA: right pulmonary artery; LPA: left pulmonary artery; LIPV: left inferior pulmonary vein; RIPV: right inferior pulmonary vein; RSPV: right superior pulmonary vein; LSPV: left superior pulmonary vein.
Other shunts. The calculation of Qp/Qs is also used to calculate shunts due to fistulas or arterio-venous malformations40 or in anomalous coronaries.41
ConclusionThe ratio between pulmonary (Qp) and systemic flow (Qs) indicates the existence of some sort of shunt between the two circulations, either intra- or extracardiac. If the Qp/Qs ratio is >1, the shunt is from the systemic to the pulmonary circulation and if <1, from the pulmonary to the systemic circulation. Based on the patient's pathology and evolution this ratio can be interpreted differently.
The MRI is the non-invasive modality of choice for calculating Qp/Qs. It is very important to perform the test accurately obtaining the right view, cut thickness, number of phases and velocity. These parameters are modified by both the radiologist and the image technician during the test and they are the guarantee that we are obtaining reliable data.
In simple intracardiac shunts the interpretation of data is immediate. A high Qp/Qs means a significant shunt and a Qp/Qs <1 is suggestive of Eisenmenger syndrome. In other situations (patent ductus, pulmonary atresia, extracardiac shunts, univentricular correction, etc.), the measurements should be obtained and data interpreted based on the particular physiopathology.
Authors’ contributions- 1
Manager of the integrity of the study: CMR.
- 2
Study idea: CMR, MSA, ALZ and JAR.
- 3
Study design: CMR, MSA, ALZ and JAR.
- 4
Data mining: CMR and MSA.
- 5
Data analysis and Interpretation: CMR, MSA, ALZ and JAR.
- 6
Statistical analysis: N/A.
- 7
Reference search: CMR.
- 8
Writing: CMR, MSA and JAR.
- 9
Critical review of the manuscript with intellectually relevant remarks: CMR, MSA, ALZ and JAR.
- 10
Approval of final version: CMR, MSA, ALZ and JAR.
The authors declare that no experiments with human beings or animals have been performed while conducting this investigation.
Data confidentialityThe authors declare that in this article there are no data from patients.
Right to privacy and informed consentThe authors declare that in this article there are no data from patients.
Conflict of interestThe authors declare no conflict of interests.
Please cite this article as: Marín Rodríguez C, Sánchez Alegre ML, Lancharro Zapata Á, Alarcón Rodríguez J. Cuantificación de la circulación pulmonar y sistémica: Qp/Qs. Qué es, cómo se calcula y para qué sirve. Lo que el radiólogo debe saber. Radiología. 2015;57:369–79.

