


To prospectively evaluate the usefulness of dual-energy computed tomography (DECT) with and without dedicated software in identifying uric acid kidney stones in vivo.
Material and methodsWe studied 65 kidney stones in 63 patients. All stones were analyzed in vivo by DECT and ex vivo by spectrophotometry. We evaluated the diagnostic performance in identifying uric acid stones with DECT by analyzing the radiologic densities with dedicated software and without using it (through manual measurements) as well as by analyzing the attenuation ratios of the stones in both energies with and without the dedicated software.
ResultsThe six uric acid stones included were correctly identified by evaluating the attenuation ratios with a cutoff of 1.21, both with the dedicated software and without it, yielding perfect diagnostic performance without false positives or false negatives. The study of the attenuations of the stones obtained the following values on the receiver operating characteristic curves in the classification of the uric acid stones: 0.92 for the measurements done with the software and 0.89 for the manual measurements; a cutoff of 538HU yielded 84% (42/50) diagnostic accuracy for the software and 83.1% (54/65) for the manual measurements.
ConclusionsDECT enabled the uric acid stones to be identified correctly through the calculation of the ratio of the attenuations in the two energies. The results obtained with the dedicated software were similar to those obtained manually.
Valorar de manera prospectiva e in vivo la identificación de litiasis renales de ácido úrico con tomografía computarizada (TC) de doble energía (TCDE) con y sin software específico.
Material y métodosSe estudiaron 65 litiasis de 63 pacientes analizadas ex vivo con espectrofotometría y que habían sido estudiadas con una TCDE. Se valoró el rendimiento diagnóstico en identificar litiasis de ácido úrico con TCDE mediante el análisis de las densidades radiológicas de las litiasis utilizando el software específico, o sin utilizarlo (midiéndolo manualmente), y mediante el análisis de las ratios de densidad de las litiasis en ambas energías con o sin el software específico.
ResultadosLas seis litiasis de ácido úrico incluidas fueron correctamente identificadas mediante la valoración de la ratio de densidades con un punto de corte de 1,21, tanto con el software específico como sin él, con un rendimiento diagnóstico perfecto, sin presencia de falsos positivos ni negativos. El estudio de densidades de las litiasis obtuvo valores de las curvas COR en clasificación de litiasis de ácido úrico de 0,92 para medición con la aplicación informática y de 0,89 para las mediciones manuales y una precisión diagnóstica del 84% (42/50) con el software y del 83,1% (54/65) para las mediciones manuales para un punto de corte de 538 UH.
ConclusionesEl estudio de litiasis con TCDE permite identificar correctamente las litiasis de ácido úrico mediante el cálculo de la ratio de densidades en ambas energías. Los resultados obtenidos con y sin software específico son similares.
Urinary lithiasic disease affects up to 12% of men and 6% of women in their life time, and recurrently which means high healthcare costs and a potential cause for kidney failure. When it comes to deciding treatment, the main considerations are the patient's clinical signs and kidney stone sizes. In the context of a renal colic, most kidney stones are expelled spontaneously and the success of the expulsive medical treatment regardless of the density of the kidney stone.1 However, when an invasive treatment is considered, it is essential to know the composition, toughness or fragility of kidney stones. Uric acid kidney stones, whose incidence ranges from 6 to 10%,2 can be treated with urine alkalinization in many cases. On the other hand, patients with struvite kidney stones require an antibiotic treatment prior to the kidney stone treatment, and cystine, brushite and calcium oxalate monohydrate kidney stones, cannot be fragmented with extracorporeal lithotripsy.
Computed tomography (CT) without contrast is one of the most frequently used modalities in the initial assessment of urinary kidney stones, with sensitivity and specificity rates to detect them >90%.3 The densities of the different kidney stones measured with CT allow us estimate their composition, since uric acid kidney stones present a density that is lower than that of the rest of kidney stones. However, there is overlapping between the densities measured in uric acid kidney stones and the rest, which entails a low specificity and sensitivity in their diagnosis this is why the clinical application of the measurement of kidney stone densities has not been generalized.4–6
Dual-energy CT, whether with a single source (alternating the energy or performing a dual study at different energies) or with a dual source (double tube) allows us to differentiate materials of similar densities based on the differences in the variation of absorption at different energies using a decomposition algorithm in three materials.7–9 Dual-energy analysis of data, that is, the determination of densities and the density ratio at different energies, is made easier with softwares developed specifically for this purpose though it can be performed manually. Calcified kidney stones attenuate low-energy radiation even more, unlike uric acid kidney stones, which attenuate high-energy radiation even more with a resulting ratio that is lower than that of the remaining calcified kidney stones.
In vitro dual-energy studies have been performed for the analysis of kidney stones, and with the use of specific post-processing programs and in these studies it has been possible to demonstrate that double-energy studies allow us to identify uric acid kidney stones with great accuracy and in some of the studies with good in vivo results too.10–13
Our study, which is prospective and in vivo, intends to confirm the initial results which show a good differentiation between uric acid kidney stones and those which are not through dual-energy CTs (DECT) with and without specific post-processing software tools.
Material and methodsThe patients were informed about the study and prior written informed consent was obtained from the patients referred to CT kidney stone study. The design of the prospective study did not include pregnant patients or patients in pediatric age or with incomplete dual-energy studies, with contrast or unassessable patients for technical reasons. Hence, a case corresponding to an obese patient (BMI>35) with evident excess noise was excluded from the study since this fact was noticed before the composition was biochemically analyzed. The study has the approval of the hospital ethical committee.
Between December 2010 and October 2013, 64 consecutive patients with renal or urethral kidney stones were included prospectively and they underwent a DECT, and then it was possible to analyze the composition of the urinary calculi through a crystallographic biochemical and spectrophotometric study. The kidney stones were obtained through spontaneous expulsion or after treatment with extracorporeal lithotripsy or after invasive endoscopic treatment. The CT examination was performed within the care protocol for patients with suspicion of renal colic or for the management and control of urinary kidney stones.
DECT examinationPatients were not given any types of contrast; therefore, they did not require any preparations.
The DECT was performed with a dual energy machine (Siemens Definition Flash, Erlangen, Germany). A tube acquired at 80kV and a second tube acquired simultaneously at 140kV with a tin filter to attenuate low-energy radiation from this tube.
Attenuation-based dose modulation (CareDose4D, Siemens) was used with current reference values of 319mAs for the 80kV tube and 123mAs for the 140kV tube. Collimation for both tubes was 32mm×0.6mm, with a pitch of 0.7 and a rotation time of 0.5s. The mixed reconstructions with information from both tubes were made with a factor of 0.5 (50% of the information from the acquisition with the 80kV tube and the remaining 50% with the 140kV tube with tin filter).
Post-processing of the kidney stones after the DECT was done in two ways. On the one hand, using the software package Syngovia VA20B (Siemens, Germany) with the dual-energy CT applications and in particular a specific application for urinary kidney stones (Kidney Stones, Syngovia, Siemens Medical Solutions), which, once the kidney stone is indicated manually provides information about its size, lithiasic volume, densities for each energy, its mixture and ratio or relation of densities. The ratio is obtained from the quotient between kidney stone density in a low-energy tube and the density in a high-energy tube voxel to voxel.
On the other hand, DECT study without the specific software was assessed, measuring the kidney stone density for each energy source and their mixture by drawing manually the region of interest on each kidney stone to later calculate the relation between low and high energy densities (density in HU at 80kV/density in HU at 140kV) (Figs. 1 and 2).
 of 410, 507 and 351, respectively. The radiological density values <538HU suggest uric acid kidney stone; however this kidney stone shows one ratio resulting from 1.44 suggestive of ‘non-uric acid’ kidney stone. In the lower image the assessment of the kidney stone with software shows greater density values (661, 779 and 543) and density ratios (1.45) similar to those values obtained manually. The kidney stone can be seen in blue color corresponding to one calcium non-uric kidney stone. The kidney stone was obtained through ureteroendoscopy and was made out of calcium oxalate. The kidney stone was very well categorized by the density ratio both in the manual and automatic measurements and with density values measured with the automatic application too but not with those density values measured manually.")
Assessment of right distal ureteral 3mm kidney stone. The upper images correspond to the manual assessment of the regions of interest in the images of the mixture of 80kV and 140kV, with densities in Hounsfield units (HU) of 410, 507 and 351, respectively. The radiological density values <538HU suggest uric acid kidney stone; however this kidney stone shows one ratio resulting from 1.44 suggestive of ‘non-uric acid’ kidney stone. In the lower image the assessment of the kidney stone with software shows greater density values (661, 779 and 543) and density ratios (1.45) similar to those values obtained manually. The kidney stone can be seen in blue color corresponding to one calcium non-uric kidney stone. The kidney stone was obtained through ureteroendoscopy and was made out of calcium oxalate. The kidney stone was very well categorized by the density ratio both in the manual and automatic measurements and with density values measured with the automatic application too but not with those density values measured manually.
 of 565, 579 and 564, respectively. The radiologic density of the mixture (565HU), above 538HU, suggests “non uric acid” kidney stone; however it shows a ratio of 1.03 (579/564), indicative of uric acid kidney stone. In the lower images the kidney stone assessment using software shows similar density values (531, 552 and 510HU) and a density ratio of 1.08 corresponding to the uric acid red color for being below the threshold established at 1.21. The kidney stone was obtained through ureteroendoscopy and the spectrophotometry confirmed uric acid kidney stone. The kidney stone was very well categorized through its density measured both with the software and the density ratio both in the software and the manual measurements and it would have been poorly categorized using the manual measurement of its density.")
Assessment of kidney stones in middle third of ureter of 8mm size. The upper images correspond to the manual assessment with regions of interest in the images of the mixture of 80kV and 140kV with densities in Hounsfield units (HU) of 565, 579 and 564, respectively. The radiologic density of the mixture (565HU), above 538HU, suggests “non uric acid” kidney stone; however it shows a ratio of 1.03 (579/564), indicative of uric acid kidney stone. In the lower images the kidney stone assessment using software shows similar density values (531, 552 and 510HU) and a density ratio of 1.08 corresponding to the uric acid red color for being below the threshold established at 1.21. The kidney stone was obtained through ureteroendoscopy and the spectrophotometry confirmed uric acid kidney stone. The kidney stone was very well categorized through its density measured both with the software and the density ratio both in the software and the manual measurements and it would have been poorly categorized using the manual measurement of its density.
The specific application Kidney Stones analyzes the kidney stones that it identifies and based on the density ratio in the two tubes, it assigns a blue or red color if the kidney stone ratio is greater or lower than the one established, which in our study starting at the threshold used by the default software based on initial studies, is 1.21. In the analysis of manual measurements of the densities, the same cutoff value of the density was also established (1.21) in order to establish diagnosis of uric acid kidney stone through DECT when these measurements were lower than this value.
For the analysis of the density values of the kidney stones, the density values obtained in the mixture images of the two tubes were used, both the value obtained automatically and the one obtained through the manual ROI. 2mm-thick axial reconstructions were made with an extra 1mm with specific reconstruction algorithms for dual energy (D30f). From previous studies, the cut-off value was established at 538HU below which the kidney stones were classified as uric acid kidney stones.14,15
During the patient's clinical management, a radiologist provided information about the presence, number, size, location and composition of the kidney stones visualized after software post-processing.
For this study, a radiologist with at least 4 years of experience after residency in genitourinary radiology identified the kidney stone or kidney stones expelled or obtained and post-processed the images as described. To identify the kidney stones expelled at times a control study assessment was required after the expulsion or intervention. The density of kidney stone was recorded in each tube to obtain the relation of densities and the density value in the mixture, both manually and from the values obtained through the software application. The radiologist did not know the result of the kidney stone ex vivo study.
Ex vivo study of kidney stonesThe ex vivo crystallographic analysis of kidney stones was performed in a laboratory outside our institution that did not have the result of the radiologic analysis of the kidney stones. The analysis offers information about composition quantification through the study under stereoscopic microscopy and with infrared spectrophotometry.
After the biochemical study, the kidney stones were classified into uric acid kidney stones and “non-uric acid” kidney stones based on the composition percentage of the uric acid. To avoid possible confusion factors with kidney stones of mixed composition made up of different materials, all those kidney stones whose uric acid or potassium urate component>60% were considered uric acid kidney stones.6 The ex vivo biochemical study is considered the reference test to know the composition of the calculus.
Statistical analysisThe data were collected in a database created in Access® and they were processed using the statistic computer software SPSS v15. The numeric variables are expressed in median and typical deviation (TD) or range.
Four diagnostic performances have been assessed, obtaining for each the sensitivity, specificity and negative and positive predictive values. These four assessments are, on the one hand, the diagnostic yield of DECT for the identification of uric acid kidney stones by measuring the density of kidney stones with kidney stone-specific software and without it. On the other hand, the diagnostic yield of DECT analyzing density ratios obtained with and without specific software.
To assess diagnostic yield, contingency tables and ROC curves were made for each of the four assessments in the study: densities obtained automatically, densities obtained manually, density ratios obtained automatically and density ratios obtained manually.
ResultsThe 65 kidney stones ultimately included in the study corresponded to 63 patients, 40 men (63.5%) and 23 women (36.5%), with a mean age of 54 years (age range 23–83 years); 50.8% of patients presented with a first episode of symptomatic renal lithiasis. The mean radiation dose in the studies performed was 7.7mSv (DT 2.3mSv).
Of the total number of kidney stones, 32 (49.2%) were located at urethral level and the remaining 33 at the pyelocaliceal level or at the pyeloureteral junction. The size of the kidney stones studied ranges between 2 and 46mm, with a median of 8.42mm (DT=7.06mm).
Of the kidney stones studied, in 42 patients they were obtained through ureteroscopy (66.7%), eight through spontaneous expulsion (12.7%), seven through percutaneous nephrolithotomy (11.1%), three through open nephrolithotomy (4.8%) and three through expulsion after extracorporeal lithotripsy (4.8%).
Biochemical analysisOf the 65 kidney stones ultimately included in the data analysis, six showed mostly uric acid content (minimum in this group of 80%) and they were classified as uric acid kidney stones. Of the remaining 59 kidney stones classified as “non-uric acid”, three showed a certain percentage of uric acid (maximum of 15% of the composition). The six uric acid kidney stones represented an uric acid kidney stone prevalence in our series of 9.2%.
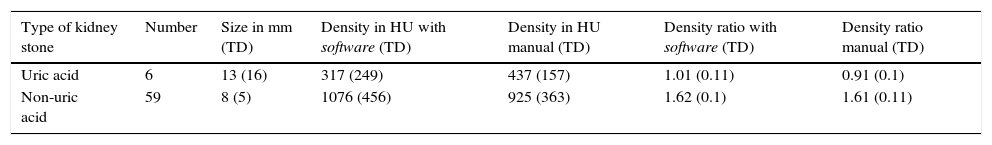
The characteristics of density and density ratio for the two kidney stone groups appear in Table 1.
Summary of data collected based on biochemical composition.
| Type of kidney stone | Number | Size in mm (TD) | Density in HU with software (TD) | Density in HU manual (TD) | Density ratio with software (TD) | Density ratio manual (TD) |
|---|---|---|---|---|---|---|
| Uric acid | 6 | 13 (16) | 317 (249) | 437 (157) | 1.01 (0.11) | 0.91 (0.1) |
| Non-uric acid | 59 | 8 (5) | 1076 (456) | 925 (363) | 1.62 (0.1) | 1.61 (0.11) |
TD: typical deviation; HU: Hounsfield units.
The distribution of densities measured both manually and with the software showed overlapping (Fig. 3). The uric acid kidney stone densities (range from 44 to 531HU in software measurements and from 157 to 580HU in manual measurements) are mostly within the range of “non uric acid” kidney stone densities (172–1798HU in software measurements and from 168 to 1411 in manual measurements).

Box distribution chart of radiological densities of kidney stones categorized based on their biochemical composition. The overlapping of densities is evident in such a way that nearly all the uric acid kidney stones densities are included in the range of non-uric acid kidney stone densities in its lower section both for automatic and manual measurements.
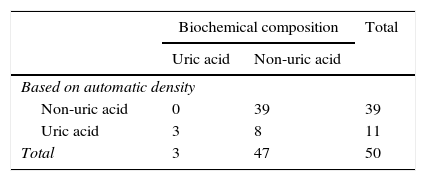
The diagnostic analysis of uric acid kidney stones with density values obtained ROC curve values in uric acid kidney stone classification of 0.92 for measurements taken with the use of the computer software and of 0.89 for measurements taken manually. With the density cut-off value established at 538HU, the values of sensitivity, specificity, positive and negative predictive values of the software measurements were 100%, 83%, 27.3% and 100%, and for the manual measurements 66.7%, 84%, 30.8% and 9.2% (Tables 2 and 3). These value show diagnostic accuracy of 84% (42/50) for the values obtained with the software and 83.1% (54/65) for those values obtained through manual measurements.
It should be pointed out that in three uric acid kidney stones and in twelve “non uric acid” kidney stones, the automatic software was unable to outline the edges of the kidney stone and failed to provide information about its density and size. The kidney stones without size or density measurements, with the exception of one, which due to its small size of <2mm was not processed by the software, were colored by the software and then classified in the uric acid category (red) or “non uric acid” category (blue) based on their density ratio.
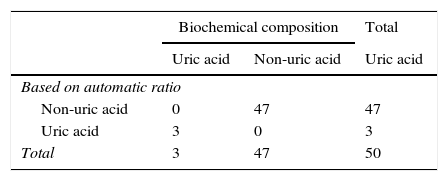
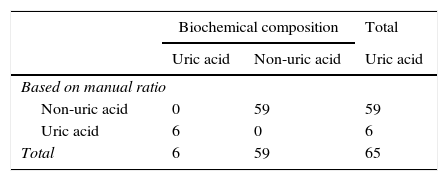
Density ratio analysisThe distribution of density ratios for uric acid and “non uric acid” kidney stones both of those obtained through manual measurements and through software (Fig. 4), is visually differentiated in the box distribution charts, without overlapping.

Box distribution chart of radiological densities of kidney stones categorized based on their biochemical composition. The chart shows the neat density ratio differentiation between both types of kidney stones without value overlapping of the density ratio both for automatic and manual measurements.
The density ratio or relation obtained from the DECT study both through the specific application and through the manual measurements identified correctly all the uric acid and “non uric acid” kidney stones with sensitivity, specificity, positive and negative predictive values and diagnostic accuracy in our series of 100% (Tables 4 and 5). The ROC curve values were 1 for both types of measurements (Fig. 5).

ROC curves of the analyses performed. The density correlations curves with manual and software measurements are overlapped while drawing one perfect curve that reaches out to the upper left corner with an area under the curve peak value of 1 since there are no errors in the categorization of kidney stones. The curves for categorization purposes using density values reach an area under the cure of 0.92 and 0.98 for those values acquired with the specific software and those obtained manually.
Our results are consistent with previous studies, with a prevalence of uric acid kidney stone in our series of 9.2%2 and with density overlapping between uric acid and non-uric acid kidney stones as can be seen in Fig. 3.4
In our study, the use of kidney stone density values to establish whether we are dealing with an uric acid kidney stone offers a diagnostic yield with 100% sensitivity for automatic measurement and 66.7% sensitivity with manual measurements though it is probably due to a selection bias that prevents small or poorly defined kidney stones or those in contact with catheters from being assessed with the software. However, positive predictive values are too low (27.3% with software measurements and 30.8% with manual measurements) to be able to use the determination of density as a useful measurement to classify uric acid kidney stones. Former studies have demonstrated that the mean density of a kidney stone in CT without contrast depends on its size, but also varies with the image cutting thickness and with the way in which the ROI is deployed.16 In order to improve kidney stone classification in conventional CT studies and identify the uric acid ones, other calculations were considered, such as the density ratio or the kidney stone density peak and its greatest diameter measured that offer better results somehow.4,5
The studies conducted with dual energy require post-processing to assess the attenuations in every energy to display the results visually, and this post-processing is conducted with dedicated software. In the specific case of the application used for renal kidney stones the software colors the kidney stones based on their ratio, automating the calculation of the ratio, facilitating and accelerating kidney stone classification visually. The time necessary to conduct the study with or without the software was not assessed, but we believe that the study using the automatic processing software is somehow faster.
Anyway we wanted to analyze the manual measurements to see if acquiring the specific software is really necessary and also extend the possible results to dual-energy studies that can be conducted with a single tube. The single-tube study can be performed with consecutive acquisitions with a tube that alternates the energy. In the first case, the results can be altered due to a poor correlation of the images due to movements between the two acquisitions in such a way that even though the initial in vitro studies were promising14 they were not confirmed in in vivo studies.17 The results in studies for the identification of uric acid kidney stones using single-tube DECT and simultaneous acquisition are promising and far better than conventional CT studies15,18 since they identify correctly all uric acid kidney stones.
Our study was performed with dual energy with double sources or tubes, and our results are consistent with studies already published that have been able to differentiate uric acid kidney stones from non uric acid kidney stones in DECT and double-source CT.
Initially the dual-energy assessment of urinary kidney stones was based on the double energy index to categorize them.19 This index is assessed based on the densities of kidney stone in the two tubes, but it is affected by the partial volume artifact. The results of the Graser study showed a 74% sensitivity and a 91% specificity. However, using ratio values in-between densities as we have done in our study the results were better with the correct identification of uric acid kidney stones12 also in vivo.
The Stolzman group published the results of an in vivo study with 89% sensitivity, 98% specificity, 88.9% positive predictive value and 96% overall diagnostic accuracy.10 Previously, Boll had already showed the capacity of adequately performing this in vitro identification.11 Other studies conducted with the same software we used, with only three uric acid kidney stones, also showed a correct identification of uric acid kidney stones with color, without analyzing the ratio values that support them.13
The software processed 64 of the 65 kidney stones included. In only one 2mm kidney stone the software failed to contribute data about its composition due to its small size, just as it had happened in a previous study.10 In 14 of the 64 kidney stones it adequately performed color assignation, but it failed to provide data about size, volume and specific ratio of the kidney stone since it could not outline its edges because it was in contact with catheters or other larger kidney stones.
In dual-energy studies a selective photon shield through a tin filter optimizes high-energy scanning (140kV) increasing the attenuation differences of the materials, which allows us to differentiate more groups of kidney stone.20,21 Another advantage of the shield is the theoretical reduction of the radiation dose that attenuates the fact of performing a double scanning reaching radiation doses similar to the single-energy study (conventional CT). Dual-energy protocols have been proposed with low radiation doses<3mSv corresponding to the dose of an IV urography reaching satisfactory results provided that it is avoided in obese patients.12,22 Our examinations conducted with the clinical protocol available were made with a radiation dose greater than the one proposed with the very low-dose protocols. Other modalities suggested to reduce the dose are performing ultralow directed studies with conventional CT and then a dual-energy acquisition focalized on the kidney stones.19
Even though the number of uric acid kidney stones included in our study with only six of major uric acid component maintains the proportion described in other series, is relatively low and this is why it limits our results. On the other hand, in three of the six uric acid kidney stones, the software did not contribute numeric data on density or ratio, and they could not be included in the statistical analysis. This fact could outline the 100% diagnostic values; however, the kidney stones were colored and the qualitative classification that the software provided was correct in all kidney stones, so it would not have altered the results.
Another limitation our study has is the fact that we have used the pre-established threshold by the software at 1.21 as the density ratio to categorize kidney stones; however, a recent study establishes that the cut-off value to be able to identify uric acid kidney stones can be established at 1.14 and another cut-off value at 1.29 to be able to identify calcium kidney stones in such a way that between both cut-off values it would be possible to identify cystine kidney stones.23 It has not been possible to confirm this since we did not have any cystine kidney stones in our study but in consistency with the study results no kidney stones included in our study showed ratios from 1.14 to 1.29.
The dual-energy study is limited in obese patients since the acquisition with the low-energy tube entails excessive noise thus preventing reliable measurements of the density of kidney stones. The noise generated by this type of patients leads to calculation errors in the analysis.24 The protocol in this type of patients needs to be modified and greater energy should be used with the tubes at 100 and 140kV.25,26
As a conclusion, the study of kidney stones through DECT allows us to identify correctly uric acid kidney stones by calculating the density ratio in both energies. The specific software facilitates and automates the calculation but similar results are obtained without it.
Ethical responsibilitiesProtection of people and animalsThe authors declare that no experiments with human beings or animals have been performed while conducting this investigation.
Data confidentialityThe authors confirm that in this article there are no data from patients.
Right to privacy and informed consentThe authors confirm that in this article there are no data from patients.
FundingArticle sponsored by an investigational grant granted by SERAM-Industria program of 2010: Analysis of urinary kidney stones through double-energy CT.
Authors contribution- 1.
Manager of the integrity of the study: RS.
- 2.
Study idea: RS, CN, BP, CS.
- 3.
Study design: RS, CN, LB.
- 4.
Data mining: RS, MPL, AC.
- 5.
Data analysis and interpretation: RS.
- 6.
Statistical analysis: RS.
- 7.
Reference search: RS, CN, MPL.
- 8.
Writing: RS, MPL, AC, CN.
- 9.
Critical review of the manuscript with intellectually relevant remarks: RS, CS, BP, LB, CN.
- 10.
Approval of final version: RS, MPL, AC, BP, LB, CS, CN.
The authors declare no conflict of interests associated with this article whatsoever.
Please cite this article as: Salvador R, Luque MP, Ciudin A, Paño B, Buñesch L, Sebastia C, et al. Utilidad de la tomografía computarizada de doble energía con un programa específico para la identificación de litiasis renales de ácido úrico. Radiología. 2016;58:120–128.
Article sponsored by an investigational grant granted by SERAM-Industria program of 2010: analysis of urinary kidney stones through double-energy CT.
articles

www.publicationethics.org.

Radiología (English Edition) follows the Recommendations for the Conduct, Reporting, Editing and Publication of Scholarly Work in Medical Journals