


Transabdominal ultrasonography (US) is the technique of choice for pelvis evaluation in paediatric population. The results of studies regarding US findings show a wide variation. The objectives of our study were: to estimate and correlate uterine and ovarian ultrasound measures (longitudinal diameter and volume) with chronological age, breast Tanner stage (TS) and gynaecological age (GA); to evaluate presence and size of follicles in patients according to their pubertal stage; and to determine the endometrial length in prepubertal and pubertal girls.
Material and methodsUnicentric, observational, retrospective, analytical study, conducted between 2010 and 2019. Healthy girls between 8.0 and 16.0 years, attended in the deparment of radiology were evaluated. Breast Tanner's stage (TS) was evaluated and gynaecological age was determined. Ultrasounds were performed by a paediatric diagnostic radiospecialist. Uterus length (UL) and ovarian length (OL) were measured; uterus and ovarian volume were calculated (UV and OV). Diameter of the largest follicle and endometrial thickness were measured.
Results292 patients were analyzed, mean age was 12.5 years (SD: 2.1). A significant correlation was observed between uterine and ovarian measurements with chronological age (CA), TS and GA (p < 0.0001). A significant increase in DLU and VU is described as the CA intervals increase, also in ovarian measurements. No significant differences in measurements were observed between TS I and II. An increase was evidenced at menarche. In 30.9% of pubertal patients and 11.8% of prepubertal patients showed ovarian follicles. The endometrium was not measurable in 88.24% of the pre-pubertal population and was always measurable in patients with TS IV and V.
ConclusionsUterine and ovarian measurements increased with CE and ET (except ETI and II). The greatest increase occurred with menarche. Ovarian follicles and endometrium thickness less than or equal to 1 mm were presented in prepubertal patients.
La ecografía transabdominal es el método de elección para el estudio de la pelvis en la población infanto-juvenil. Los estudios publicados referidos a esta población son variables. Los objetivos de nuestro trabajo fueron: medir y correlacionar las variables ecográficas uterinas y ováricas (diámetro longitudinal y volumen) con la edad cronológica, estadios de Tanner mamario y edad ginecológica; evaluar presencia y tamaño de folículos en las pacientes de acuerdo a su estadio puberal; y determinar el grosor endometrial en niñas prepuberales y puberales.
Material y métodosEstudio unicéntrico, observacional, retrospectivo, analítico. Se evaluaron niñas sanas entre 8,0 y 16,0 años que fueron atendidas en el consultorio de diagnóstico por imágenes entre 2010 y 2019. Se evaluó el estadio de Tanner (ET) mamario y se determinó la edad ginecológica (EG). Las ecografías se realizaron por profesional especialista en Radiodiagnóstico y Diagnóstico por Imágenes Pediátrico con dedicación exclusiva. Se midieron diámetro longitudinal de útero (DLU) y ovarios (DLO), y se calcularon ambos volúmenes (VU y VO). Se midió el folículo de mayor diámetro y el grosor endometrial.
ResultadosSe analizaron 292 pacientes, la edad promedio fue 12,5 años (D.E: 2,1). Se observó correlación significativa de medidas uterinas y ováricas con edad cronológica (EC), ET y EG (p < 0,0001). Se describe aumento significativo del DLU y VU a medida que aumentan los intervalos de EC, también en medidas del ovario. No se observaron diferencias significativas de las mediciones entre los ET I y II. Se evidenció un aumento al presentarse la menarca. El 30,9% de las pacientes puberales y el 11,8% de las prepuberales presentaron folículos ováricos. El endometrio no fue medible en 88,24% de la población prepuberal y siempre en pacientes con ET IV y V.
ConclusionesLas medidas uterinas y ováricas aumentaron con EC y ET (excepto ETI y II). El mayor incremento ocurrió con la menarca. Las pacientes prepuberales presentaron folículos ováricos y un grosor endometrial menor o igual a 1 mm.
Transabdominal ultrasound is the technique of choice for studying the pelvis in the child and adolescent population.1 It is a safe, non-invasive method, which provides information about the internal genitalia, their normal structure, hormonal status and congenital and acquired disease.2 It is commonly used in paediatric gynaecology practice to diagnose abdominal masses, to define causes of acute abdomen and guide therapeutic decision-making, to detect alterations in normal sexual development such as early and late puberty and its variants, and in the diagnosis of irregularities in the menstrual cycle. In many cases it is the only imaging method used to make the diagnosis.3
Puberty is characterised by a series of physical and psychological changes over a period of three to four years, induced by a gradual increase in sex steroids.4 It is a process with wide individual variability in both age of onset and progression; this is genetically determined, with ethnicity, nutritional status, and medical and environmental factors all having a large influence.5 The normal appearance of the internal genitalia changes throughout this process, largely as a result of hormonal effects.6
The experience of the sonographer performing and interpreting an ultrasound scan is very important for the quality of the examination. The paediatric radiologist must be well trained and knowledgeable about the appearance and size of the ovaries and uterus at different paediatric ages.3 The availability of quantitative ranges helps to objectively define normal parameters.
Although ultrasound is a routine method of assessment, there is wide variability in the results of studies in terms of pelvic findings in this population. There are a number of published studies describing the characteristics of the uterus and ovaries according to age and sexual development in the healthy population to provide reference values.7–12 There are, however, discrepancies among them due to methodological limitations, small populations, different age ranges considered and limited statistical analyses. The earlier onset of sexual development over the years,13,14 combined with technological advances that provide greater precision in measurements, further contribute to this variability.
The aim of our study was to characterise the ultrasound findings of the uterus and ovaries in girls and female adolescents according to chronological age, sexual development and gynaecological age.
Material and methodsThe study was approved by the Comité Institucional de Revisión de Protocolos de Investigación (CIRPI) [Institutional Review Board for Research Protocols] at Hospital de Niños Sor María Ludovica [Sor María Ludovica Children’s Hospital] (La Plata, province of Buenos Aires, Argentina).
The primary objective was to establish uterine and ovarian ultrasound measurements in healthy girls and female adolescents aged 8–16 years.
The secondary objectives were to correlate uterine and ovarian ultrasound variables (longitudinal diameter and volume) with chronological age, Tanner staging for breast development and gynaecological age, assess the presence of follicles and determine endometrial thickness in prepubertal and pubertal girls.
We conducted a single-centre, observational, retrospective analytical study. We examined the medical records of girls and female adolescents seen at the imaging clinic who had transabdominal ultrasound for assessment of the uterus and adnexa from May 2010 to December 2019. A total of 358 patients were recruited. Healthy patients aged from 8.0 to 16.0 years were included. Patients under eight years of age (8), over 16 years of age (7), those with a history of gynaecological (2) or endocrine (20) disorders or chronic disease (11), those with abnormal findings in the ultrasound report, such as cysts (7), ovarian tumours (3) or uterine malformations (2), and those with incomplete medical history (6) were excluded. The final sample analysed consisted of 292 patients.
The ultrasound scans were performed by a specialist in paediatric radiodiagnosis and diagnostic imaging, who had been working in this area since 1987. Transabdominal (TA) ultrasound scans were performed through a full bladder. We used the Toshiba Nemio XG, basic with Convex 3.7 MHZ, Microconvex6 MHz and Linear 12 Mhz transducer, depending on the patient's age, the extent of bladder filling and the difficulty in finding either of the ovaries. Ultrasound images were obtained in transverse and sagittal planes. The uterus and both ovaries were visualised in all patients. Patients were divided into four groups according to chronological age (CA): CA1 (8.0–9.9 years), CA2 (10.0–11.9 years), CA3 (12.0–13.9 years) and CA4 (14.0–16.0 years).
Sexual development was classified according to the Tanner breast development staging (I to V)15:
▪Stage 1. Prepubertal, elevation of papilla only.
▪Stage 2. Breast budding: elevation of breasts and papilla as small mounds.
▪Stage 3. Further enlargement and elevation of breasts and areolae, with no separation of their contours.
▪Stage 4. Projection of areolae and papilla to form a secondary mound above the contour of the breast.
▪Stage 5. Mature stage: projection of papilla only, due to recession of the areolae to the general contour of the breast.
The presence of thelarche (onset of breast development, Tanner stage 2) was the criterion for distinguishing prepubertal (Tanner 1) from pubertal (Tanner 2–5) patients.
Patients who had had their first menstrual bleeding (menarche) were divided according to gynaecological age (GA) (time since menarche) into: GA0 (no menarche); GA1 (0−0.5 years); GA2 (0.6 to 0.9 years); GA3 (1.0–1.9 years); GA4 (2.0–2.9 years); and GA5 (≥3.0 years). The uterine and ovarian parameters included were: longitudinal diameter (LD), anteroposterior diameter (APD) and transverse diameter (TD), expressed in millimetres (mm). The volume of these structures was calculated in cubic centimetres (cc) using the ellipse formula (LD × APD × TD × 0.5233). With regards to ovaries, the average volume and LD of each was considered. In the presence of ovarian follicles, the one with the largest diameter was measured. Endometrial thickness was determined in mm.
Uterine and ovarian measurements were studied according to patients' chronological age, Tanner breast development stage and gynaecological age.
Statistical analysisDue to the nature of the variables (nominal or ordinal) or the lack of fit to the normal distribution (p < 0.05), Spearman’s correlation was the method of choice.16 Correlation coefficients (r) were calculated and interpreted as: very weak (r ≤ 0.25); weak (0.26−0.50); moderate to strong (0.51−0.75); and strong to perfect (0.76–1).
The median of all uterine and ovarian measurements was calculated, due to the lack of fit to the normal distribution. Median uterine and ovarian variables between age groups, Tanner breast development stages and gynaecological age groups were compared using the Kruskal-Wallis test and the Bonferroni post hoc test. In all cases the significance level chosen was p < 0.05. The software used was Epidat version 4.2 and InfoStat 2018 version.
The right and left ovarian longitudinal diameter (OLD) were combined and the average OLD of both (right OLD + left OLD/2) was calculated. In the case of ovarian volume (OV), the volume of the right and left ovary were combined and the average volume of the two was calculated (right OV + left OV/2).
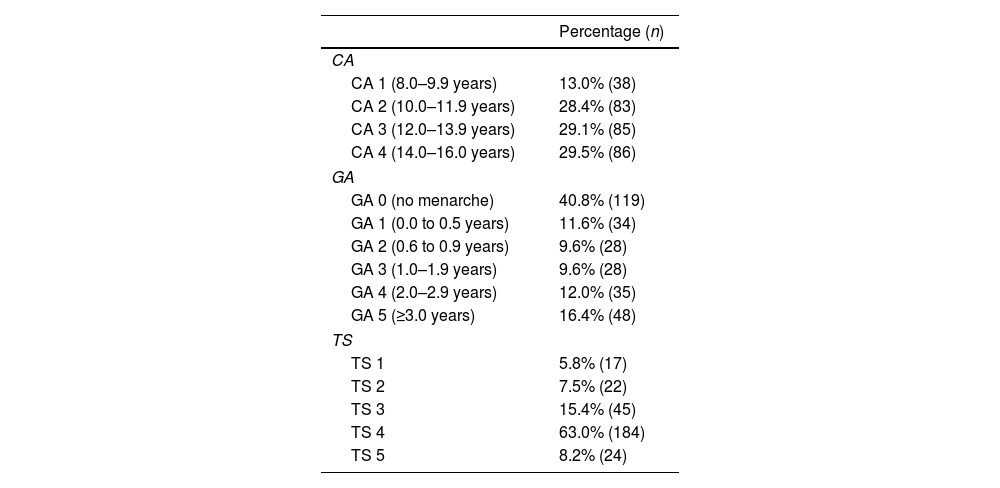
ResultsA total of 292 patients were analysed. The mean age was 12.5 years (SD: 2.1), ranging from eight to 16 years; 94.2% (n = 275) were pubertal and 5.8% (n = 17) were prepubertal. Table 1 shows the percentage of the total number of patients by chronological age (CA), Tanner stage (TS) and gynaecological age (GA).
Characteristics of the study population.
| Percentage (n) | |
|---|---|
| CA | |
| CA 1 (8.0–9.9 years) | 13.0% (38) |
| CA 2 (10.0–11.9 years) | 28.4% (83) |
| CA 3 (12.0–13.9 years) | 29.1% (85) |
| CA 4 (14.0–16.0 years) | 29.5% (86) |
| GA | |
| GA 0 (no menarche) | 40.8% (119) |
| GA 1 (0.0 to 0.5 years) | 11.6% (34) |
| GA 2 (0.6 to 0.9 years) | 9.6% (28) |
| GA 3 (1.0–1.9 years) | 9.6% (28) |
| GA 4 (2.0–2.9 years) | 12.0% (35) |
| GA 5 (≥3.0 years) | 16.4% (48) |
| TS | |
| TS 1 | 5.8% (17) |
| TS 2 | 7.5% (22) |
| TS 3 | 15.4% (45) |
| TS 4 | 63.0% (184) |
| TS 5 | 8.2% (24) |
CA: chronological age; GA: gynaecological age; n: cases assessed; TS: Tanner breast development stage (1–5).
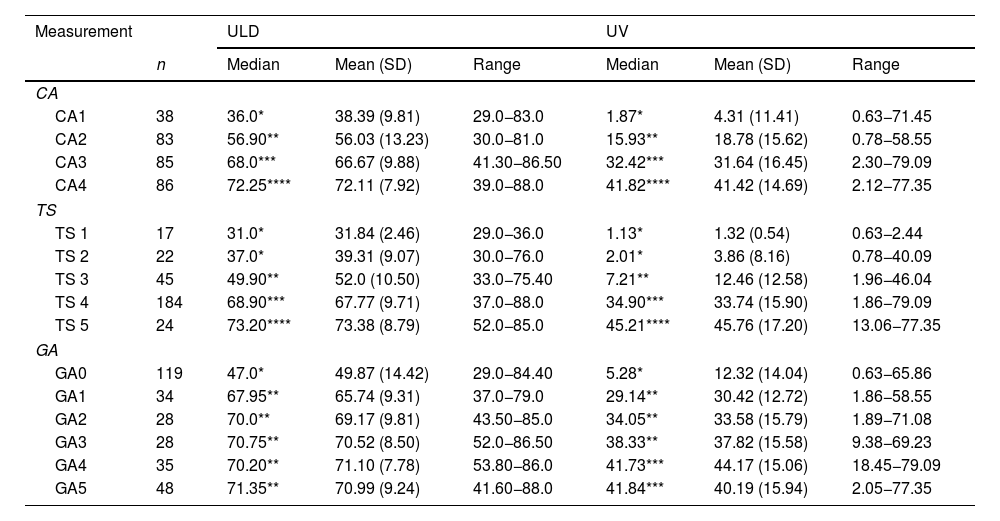
A statistically significant direct correlation (p < 0.0001) was found between ULD and CA (r = 0.66), TS (r = 0.67) and GA (r = 0.59), as well as between UV and CA (r = 0.67), TS (r = 0.68) and GA (r = 0.64). Table 2 shows a significant increase in ULD and UV as the CA ranges increase (Fig. 1A and B). No significant differences in ULD and UV were found between TS 1 and 2. However, they increased between TS 3 and 5 (Table 2 and Fig. 1 C and D). An increase in ULD was observed at menarche (GA1), which remained without significant differences with the other groups (GA2-GA5). With regards to UV, an increase was found at GA1 and another peak at GA4 (Table 2 and Fig. 1E and F).
Measurements of the uterus.
| Measurement | ULD | UV | |||||
|---|---|---|---|---|---|---|---|
| n | Median | Mean (SD) | Range | Median | Mean (SD) | Range | |
| CA | |||||||
| CA1 | 38 | 36.0* | 38.39 (9.81) | 29.0−83.0 | 1.87* | 4.31 (11.41) | 0.63−71.45 |
| CA2 | 83 | 56.90** | 56.03 (13.23) | 30.0−81.0 | 15.93** | 18.78 (15.62) | 0.78−58.55 |
| CA3 | 85 | 68.0*** | 66.67 (9.88) | 41.30−86.50 | 32.42*** | 31.64 (16.45) | 2.30−79.09 |
| CA4 | 86 | 72.25**** | 72.11 (7.92) | 39.0−88.0 | 41.82**** | 41.42 (14.69) | 2.12−77.35 |
| TS | |||||||
| TS 1 | 17 | 31.0* | 31.84 (2.46) | 29.0−36.0 | 1.13* | 1.32 (0.54) | 0.63−2.44 |
| TS 2 | 22 | 37.0* | 39.31 (9.07) | 30.0−76.0 | 2.01* | 3.86 (8.16) | 0.78−40.09 |
| TS 3 | 45 | 49.90** | 52.0 (10.50) | 33.0−75.40 | 7.21** | 12.46 (12.58) | 1.96−46.04 |
| TS 4 | 184 | 68.90*** | 67.77 (9.71) | 37.0−88.0 | 34.90*** | 33.74 (15.90) | 1.86−79.09 |
| TS 5 | 24 | 73.20**** | 73.38 (8.79) | 52.0−85.0 | 45.21**** | 45.76 (17.20) | 13.06−77.35 |
| GA | |||||||
| GA0 | 119 | 47.0* | 49.87 (14.42) | 29.0−84.40 | 5.28* | 12.32 (14.04) | 0.63−65.86 |
| GA1 | 34 | 67.95** | 65.74 (9.31) | 37.0−79.0 | 29.14** | 30.42 (12.72) | 1.86−58.55 |
| GA2 | 28 | 70.0** | 69.17 (9.81) | 43.50−85.0 | 34.05** | 33.58 (15.79) | 1.89−71.08 |
| GA3 | 28 | 70.75** | 70.52 (8.50) | 52.0−86.50 | 38.33** | 37.82 (15.58) | 9.38−69.23 |
| GA4 | 35 | 70.20** | 71.10 (7.78) | 53.80−86.0 | 41.73*** | 44.17 (15.06) | 18.45−79.09 |
| GA5 | 48 | 71.35** | 70.99 (9.24) | 41.60−88.0 | 41.84*** | 40.19 (15.94) | 2.05−77.35 |
CA: chronological age; GA: gynaecological age; SD: standard deviation; TS: Tanner breast development stage (1–5); n: cases assessed; ULD: uterine longitudinal diameter; UV: uterine volume.
The statistical tests used were Kruskal-Wallis and the Bonferroni post hoc test.
Groups differing in number of * show statistically significant differences.
 and uterine volume (UV) by chronological age (A and B), Tanner breast development stage (C and D) and gynaecological age (E and F). A and B: a gradual increase in ULD and UV can be seen with increasing chronological age ranges. C and D: between TS 1 and 2 the ULD and UV are maintained; thereafter they gradually increase (3–5). E: an increase in ULD can be seen at the onset of menarche (GA1); thereafter it remains unchanged through the other gynaecological age groups. F: two increases in UV can be seen, in categories GA1 and GA4.")
Uterine longitudinal diameter (ULD) and uterine volume (UV) by chronological age (A and B), Tanner breast development stage (C and D) and gynaecological age (E and F).
A and B: a gradual increase in ULD and UV can be seen with increasing chronological age ranges.
C and D: between TS 1 and 2 the ULD and UV are maintained; thereafter they gradually increase (3–5).
E: an increase in ULD can be seen at the onset of menarche (GA1); thereafter it remains unchanged through the other gynaecological age groups.
F: two increases in UV can be seen, in categories GA1 and GA4.
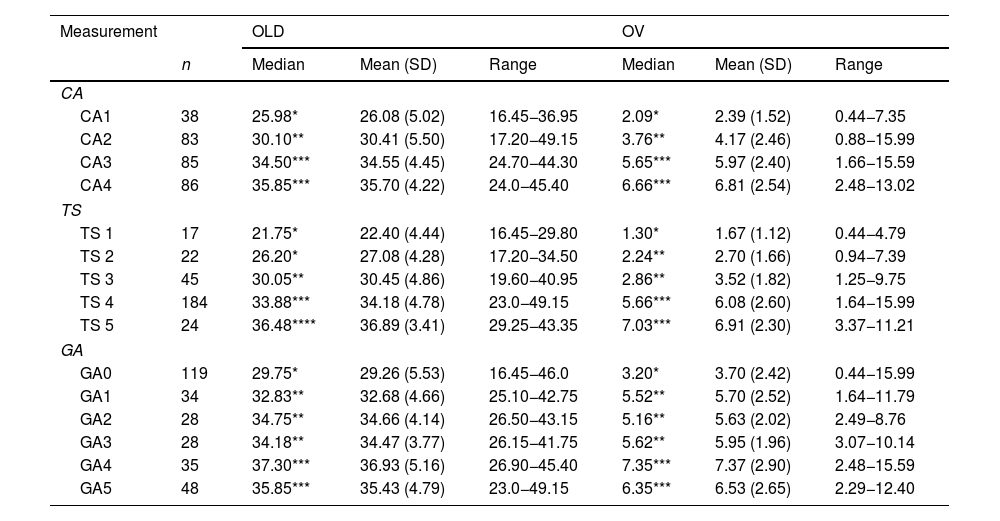
With respect to the ovary, a statistically significant direct correlation (p < 0.0001) was found between OLD and CA (r = 0.56), TS (r = 0.54) and GA (r = 0.49), as well as between OV and CA (r = 0.59), TS (r = 0.58) and GA (r = 0.49). Table 3 shows a significant increase in OLD and OV, in relation to CA, except in groups CA3 and CA4, where no significant differences between them were found (Fig. 2A and B). In OLD, no significant differences were found between TS 1 and 2. However, it increased in TS 3, 4 and 5. OV was similar between TS 2 and 3 and two peaks were observed, one in TS 2 and one in TS 4 (Table 3 and Fig. 2C and D). OLD and OV increased at menarche (GA1) and at GA4. They decreased again in GA5, although not significantly (Table 3 and Fig. 2E and F).
Ovary measurements.
| Measurement | OLD | OV | |||||
|---|---|---|---|---|---|---|---|
| n | Median | Mean (SD) | Range | Median | Mean (SD) | Range | |
| CA | |||||||
| CA1 | 38 | 25.98* | 26.08 (5.02) | 16.45−36.95 | 2.09* | 2.39 (1.52) | 0.44−7.35 |
| CA2 | 83 | 30.10** | 30.41 (5.50) | 17.20−49.15 | 3.76** | 4.17 (2.46) | 0.88−15.99 |
| CA3 | 85 | 34.50*** | 34.55 (4.45) | 24.70−44.30 | 5.65*** | 5.97 (2.40) | 1.66−15.59 |
| CA4 | 86 | 35.85*** | 35.70 (4.22) | 24.0−45.40 | 6.66*** | 6.81 (2.54) | 2.48−13.02 |
| TS | |||||||
| TS 1 | 17 | 21.75* | 22.40 (4.44) | 16.45−29.80 | 1.30* | 1.67 (1.12) | 0.44−4.79 |
| TS 2 | 22 | 26.20* | 27.08 (4.28) | 17.20−34.50 | 2.24** | 2.70 (1.66) | 0.94−7.39 |
| TS 3 | 45 | 30.05** | 30.45 (4.86) | 19.60−40.95 | 2.86** | 3.52 (1.82) | 1.25−9.75 |
| TS 4 | 184 | 33.88*** | 34.18 (4.78) | 23.0−49.15 | 5.66*** | 6.08 (2.60) | 1.64−15.99 |
| TS 5 | 24 | 36.48**** | 36.89 (3.41) | 29.25−43.35 | 7.03*** | 6.91 (2.30) | 3.37−11.21 |
| GA | |||||||
| GA0 | 119 | 29.75* | 29.26 (5.53) | 16.45−46.0 | 3.20* | 3.70 (2.42) | 0.44−15.99 |
| GA1 | 34 | 32.83** | 32.68 (4.66) | 25.10−42.75 | 5.52** | 5.70 (2.52) | 1.64−11.79 |
| GA2 | 28 | 34.75** | 34.66 (4.14) | 26.50−43.15 | 5.16** | 5.63 (2.02) | 2.49−8.76 |
| GA3 | 28 | 34.18** | 34.47 (3.77) | 26.15−41.75 | 5.62** | 5.95 (1.96) | 3.07−10.14 |
| GA4 | 35 | 37.30*** | 36.93 (5.16) | 26.90−45.40 | 7.35*** | 7.37 (2.90) | 2.48−15.59 |
| GA5 | 48 | 35.85*** | 35.43 (4.79) | 23.0−49.15 | 6.35*** | 6.53 (2.65) | 2.29−12.40 |
CA: chronological age; GA: gynaecological age; n: cases evaluated; OLD: ovarian longitudinal diameter; OV: ovarian volume; SD: standard deviation; TS: Tanner breast development stage (1–5).
The statistical tests used were Kruskal-Wallis and the Bonferroni post hoc test.
Groups differing in number of * show statistically significant differences.
 and ovarian volume (OV) by chronological age (A and B), Tanner breast development stage (C and D) and gynaecological age (E and F). A and B: an increase in OLD and OV can be seen in relation to chronological age, except in groups CA3 and CA4, where there are no differences between them. C: between TS 1 and 2 the OLD is maintained; thereafter it gradually increases (3–5). D: between TS 1 and 2 the OV is maintained; subsequently two increases can be seen, one in TS 3 and one in TS 4. E and F: both OLD and OV increase at menarche (GA1) and then again at GA4. At GA5 there is a decrease, although not significant.")
Ovarian longitudinal diameter (OLD) and ovarian volume (OV) by chronological age (A and B), Tanner breast development stage (C and D) and gynaecological age (E and F).
A and B: an increase in OLD and OV can be seen in relation to chronological age, except in groups CA3 and CA4, where there are no differences between them.
C: between TS 1 and 2 the OLD is maintained; thereafter it gradually increases (3–5).
D: between TS 1 and 2 the OV is maintained; subsequently two increases can be seen, one in TS 3 and one in TS 4.
E and F: both OLD and OV increase at menarche (GA1) and then again at GA4. At GA5 there is a decrease, although not significant.
The presence of ovarian follicles was not significantly correlated with sexual development (r = 0.098, p = 0.0946). However, 30.9% (85/275) of pubertal patients had ovarian follicles, with a mean size of 13.6 mm (SD: 5.9) and a range from 4 to 30 mm. In the case of prepubertal girls, 11.8% (2/17) had follicles. These two girls had follicles of 7 and 8 mm, respectively.
The endometrium was not measurable in 88.24% of the prepubertal population (TS 1). In those in whom it could be measured (n = 2), the thickness was 1 mm. In TS 2 and 3 patients, the endometrium was not measurable in 45.45% and 15.55%, respectively. The endometrium was measurable in all patients with TS 4 and 5 (Table 4).
Endometrial measurements by Tanner breast development stage.
| Measurable images | Not measurable | ||||
|---|---|---|---|---|---|
| n | Median | Mean (SD) | Range | ||
| TS | |||||
| TS 1 | 17 | 1.0 | 1.0 (0.0) | − | 88.2% (n = 15) |
| TS 2 | 22 | 1.0 | 1.62 (1.08) | 1.0−4.50 | 45.5% (n = 10) |
| TS 3 | 45 | 2.10 | 2.76 (1.83) | 1.0−8.70 | 15.6% (n = 7) |
| TS 4 | 184 | 4.0 | 4.68 (2.55) | 1.0−15.70 | 0% (n = 0) |
| TS 5 | 24 | 4.0 | 5.14 (3.04) | 2.0−13.0 | 0% (n = 0) |
n: cases assessed; SD: standard deviation; TS: Tanner breast development stage (1–5).
The best method to characterise the internal genitalia in paediatrics is ultrasonography. The transabdominal technique is the most commonly used, as the transvaginal technique can only be performed after the start of sexual relations. It is used to effectively visualise the uterus and ovaries, determine their morphology and size, and thereby identify any gynaecological disease in real time.1 It provides important supplementary information to assess normal sexual development and any abnormalities,17 and reference values are essential in the management of these patients. There is no consensus on uterus and adnexa measurements in the healthy paediatric population.8 The variability of the results could be attributed to the different observers, the resolution of the ultrasound equipment and the degree of bladder fullness.10 Different studies over the years have provided reference values that may not be applicable to all healthy populations, in view of the influence of multiple factors on sexual development, the earlier onset in terms of age of thelarche13 and menarche,14 and technological advances.
In our population, all uterine and ovarian measurements correlated with chronological age, with the stages of sexual development, in line with other authors,8–12,18,19 and with gynaecological age.19 Razzaghy-Azar et al.7 describe a significant increase in ULD and UV from the ages of nine to 12 years. In our study this occurred from 10 to 11.9 years, in line with more recent publications; the difference could be attributed to genetic and environmental factors and changes over time.10 Because the uterus is not elliptical and its shape changes in the course of growth, it is debated whether the ellipsoid formula should be used to calculate uterine volume.8 Herter et al.9 suggest using ULD, rather than UV, because they found a better correlation with age. In contrast, Badouraki et al.8 found a better correlation between UV and age using the ellipse formula. In our study, both ULD and UV showed similar behaviour, with both increasing with age.
Uterus dimensions changed significantly across the different stages of sexual development. Consitent with Badouraki et al.,8 we found no differences between TS 1 and 2, probably because of the limited uterine growth at the onset of sexual development. However, a rolling increase between TS 3 and 4 was observed, in line with Holm et al.,19 who describe a more rapid increase at these stages.
Sample et al.20 argue that the ULD in the prepubertal stage should not exceed 30 mm. Badouraki et al. consider this cut-off point to be too low, as in more than 97% of prepubertal patients the ULD was less than 40 mm, which is consistent with the findings of other authors.19,21 In a more current review, Villalobos Galvez et al.10 reported that the mean uterine length for TS 2 was 40 mm; we concur with this cut-off point, as in our population, at this stage, the mean was 39 mm. In relation to the UV, we agree with other authors that the prepubertal upper limit should be 4 cc.8
There was a significant increase in the ULD at the time of menarche, which then remained stable as gynaecological age progressed, with an average measurement of 65.74 mm, a value similar to that found in other studies.21 The UV increased at menarche, with an average volume of 30.42 cc, and a second significant increase was observed at the gynaecological age of two years. Holm et al.19 describe a steady increase in uterine growth with gynaecological age.
The ovaries are dynamic organs and have a stromal component, which increases discretely from birth to maturity, and a gonadotropin-dependent follicular component.9 With respect to chronological age, in our study both OLD and OV increased significantly from the age of 10–13.9 years, and remained stable thereafter. Griffin et al.22 showed that ovarian volume increases exponentially with age, but found no correlation with pubertal stage. In relation to the Tanner stage, Seth et al.23 found that ovarian volume, after showing an initial increasing curve, tends to flatten out and does not increase significantly from stage 4 to stage 5, consistent with the results of our study.
In our population, the maximum OV in prepubertal girls was 4.79 cc, close to that described by Griffin et al.22 and Orsini et al.21 At menarche, OV and OLD increased. However, as reported by other authors, they did not change significantly with advancing gynaecological age.24,25 Ivarsson et al.26 found the mean volume at menarche to be 3.3 cc, and Khadilcar et al.27 4.1 cc, while in our population it was 5.7 cc.
Ovarian cystic structures commonly seen on ultrasound are described with different terms, which makes it difficult to compare and interpret between studies. In our study, 11.8% of prepubertal patients had follicles measuring 7–8 mm. Several authors suggest that the presence of follicles smaller than 10 mm is normal at any age, and therefore in childhood the usual ovarian pattern would be homogeneous or with few follicles.8,9,19,28
The visibility of the endometrial lining could be considered to be one of the ultrasound signs of uterine oestrogen impregnation, combined with increased longitudinal diameter and thickening of the uterine body, with a body-to-cervix ratio greater than 1.29 Measurement of endometrial thickness may be useful in the diagnosis of precocious puberty.17 In the prepubertal population studied, the endometrium measured less than or equal to 1 mm, in line with Griffin et al.,22 and in contrast to the 2 mm published by Rodriguez et al.12
Strengths- •
Ultrasound evaluation by a single experienced operator provides high homogeneity in the measurements.
- •
There are few publications that report the correlation of ultrasound parameters with gynaecological age.
- •
The sample size in this study is representative of the population and allows for extrapolation of data.
- •
It is one of the few studies published on this subject in the Latin American population.
- •
It is a retrospective study and data that might have been useful in the analysis and allowed for a better correlation with other growth and development parameters, such as bone age, weight and height, were not available.
- •
We did not determine the body to cervix ratio, a variable associated with changes in the shape of the uterus linked to oestrogen stimulation.
- •
Future studies including these parameters could add to the significance of our findings.
The uterine and ovarian variables analysed showed significant growth with increasing chronological age and Tanner breast development stage (except in TS 1 and 2). The greatest increase in uterine and ovarian parameters occurred at menarche. Uterine measurements exhibit a more uniform behaviour than ovarian measurements; therefore, uterine parameters could be considered more representative indicators of sexual development.
The data provided could be used as a reference for assessing sexual development and related disorders.
CRediT authorship contribution statementGisel Rahman, María Inés Salaberry, Dolores Cecilia Ocampo, Verónica Cecilia Gonzalez, Anahí Viviana Rubinstein: clinical assessment of patients.
María Azucena Urrutia: performing ultrasound scans.
Paula Risso: statistical analysis.
All the authors contributed to the conception and design of the study, as well as to the collection, analysis and interpretation of the data. All the authors also participated in the drafting of the article and the critical review of the intellectual content, as well as the final approval of the version submitted.
FundingThe study did not receive external funding.

