


To determine the level of agreement within and between observers in the categorization of breast density on mammograms in a group of professionals using the fifth edition of the American College of Radiology’s BI-RADS® Atlas and to analyze the concordance between experts’ categorization and automatic categorization by commercial software on digital mammograms.
MethodsSix radiologists categorized breast density on 451 mammograms on two occasions one month apart. We calculated the linear weighted kappa coefficients for inter- and intra-observer agreement for the group of radiologists and between the commercial software and the majority report. We analyzed the results for the four categories of breast density and for dichotomous classification as dense versus not dense.
ResultsThe interobserver agreement among radiologists and the majority report was between moderate and nearly perfect for the analysis by category (κ = 0.64 to 0.84) and for the dichotomous classification (κ = 0.63 to 0.84). The intraobserver agreement was between substantial and nearly perfect (κ = 0.68 to 0.85 for 4 categories and k = 0.70 to 0.87 for the dichotomous classification). The agreement between the majority report and the commercial software was moderate both for the four categories (κ = 0.43) and for the dichotomous classification (κ = 0.51).
ConclusionAgreement on breast density within and between radiologists using the criteria established in the fifth edition of the BI-RADS® Atlas was between moderate and nearly perfect. The level of agreement between the specialists and the commercial software was moderate.
Determinar el acuerdo intra- e interobservador en la categorización de la densidad mamográfica entre un grupo de profesionales según la 5.a edición del Atlas BI-RADS® - ACR y analizar la concordancia entre la categorización de los expertos y un software comercial de un mamógrafo digital para categorización automática.
Métodos6 médicos categorizaron la densidad mamográfica de 451 mamografías en dos oportunidades con un intervalo de 1 mes. Calculamos los coeficientes kappa ponderados lineales de acuerdo inter- e intraobservador para el grupo médico y la concordancia entre el software comercial y el reporte de la mayoría. Analizamos los resultados para las cuatro categorías de densidad mamaria y para el resultado dicotómico de mama densa/no densa.
ResultadosEl acuerdo interobservador entre especialistas y el reporte de la mayoría fue moderado y casi perfecto para el análisis por categoría (κ = 0,64 a 0,84) y de manera dicotómica (κ = 0,63 a 0,84). El acuerdo intraobservador fue sustancial y casi perfecto (κ = 0,68 a 0,85 para 4 categorías y k = 0,70 a 0,87 para el análisis dicotómico). El acuerdo entre el reporte de la mayoría y el software comercial fue moderado tanto por categoría (κ = 0,43) como en el análisis dicotómico (κ = 0,51).
ConclusiónHemos observado un acuerdo entre moderado y casi perfecto inter- e intraobservador entre los radiólogos, según los criterios establecidos en la 5.ª edición del Atlas BI-RADS®. El nivel de acuerdo entre el reporte de los especialistas y un software disponible comercialmente fue moderado.
Breast density, evaluated by means of mammography, is defined as relative quantities of radiodense stromal and epithelial tissues in comparison to radiotransparent adipose tissue.1 The 5th edition of the BI-RADS® Atlas of the American College of Radiology (ACR) defines four patterns of breast density, specifically ACR a (almost entirely fatty), ACR b (scattered areas of fibroglandular tissue), ACR c (heterogeneously dense) and ACR d (extremely dense).2
High breast density (categories c and d) is an independent risk factor for developing breast cancer3–5 and a masking factor that decreases mammography’s sensitivity for detecting this disease and other lesions.6–10
Breast density may be visually evaluated by a radiologist. Some authors have found that this method entails considerable intraobserver and interobserver variability.11–13 A systematic literature review conducted by the Task Force working group in 2016 reported that, in community environments, 19–22% of mammography examinations initially classified as dense were subsequently classified as not dense, and 10–16% of examinations initially deemed not dense were reclassified as dense. Regarding sequential reproducibility, the group reported that in 20% of studies the category was changed in the subsequent round if the reading was performed by the same radiologist, and that this proportion rose to 33% if the evaluation was performed by a different radiologist.13,14
Moreover, automated breast density measuring systems are becoming increasingly common.15–19 Consequently, in clinical practice, breast density is reported based on assessment performed by specialists aided by these systems. Yet few studies have analysed professionals’ use of, concordance with and perception of the usefulness of these tools.
The objective of our study was to determine the degree of intraobserver and interobserver agreement in categorising breast density according to the 5th edition of the BI-RADS® Atlas of the ACR among a group of professionals specialised in breast imaging at a highly complex health institution. We also analysed concordance between categorisation by experts and categorisation by an automated categorisation method (a commercial software program for a digital mammography machine).
MethodsSettingOur study was conducted in the Breast Diagnosis and Intervention Section of the Diagnostic Imaging Department at a tertiary hospital. The department has had digital imaging and an integrated radiology information system/picture archiving and communication system (RIS/PACS) since 2010.20 The section is composed of ten specialists and two fellows, and reports an annual average of 30,000 mammograms. Mammograms are randomly assigned on a daily basis to radiologists for reporting; each receives 200–400 cases per month. Once mammogram reports are redacted, 10% of studies reported by specialists (approximately 300 studies per month) and all studies reported by fellows are submitted for peer review. In addition, report quality audits are performed by the physicians who order the studies.
Study designThis cross-sectional study was conducted in accordance with the principles of the Declaration of Helsinki and was approved by the Independent Ethics Committee at our institution. Patient consent was also obtained.
Categorisation of breast density according to the 5th edition of the BI-RADS® of the ACRThe team of professionals was made up of six physicians from the Breast Diagnosis and Intervention Section. The group had an average of nine years and a range of two to eighteen years of experience in breast imaging. A total of 451 mammograms from randomly selected asymptomatic patients 40–90 years of age, performed at the institution in February 2019, were included. One of four acquisitions was drawn from each study; it could be of the craniocaudal or mediolateral oblique view. Focalised and magnified incidents as well as mammograms for patients with a personal history of breast surgery (including breast implants) or gigantomastia were excluded. The latter was defined by the need to use more than one plate per incident.
A bioengineer and a radiologist, who did not take part in the subsequent categorisation, extracted the images to be evaluated from the hospital database and removed patient-identifying data. Consecutive sampling was used.
A week before the 451 mammography images were evaluated, the participating professionals reviewed the criteria for categorisation of breast density with images in the 5th edition of the BI-RADS®2 Atlas. Next, the specialists categorised breast density in each mammogram. The images were evaluated at 5-megapixel workstations.
The evaluators were not aware of the patients’ demographic data or the category assigned in the original report for each mammogram. They were also unaware of the density assigned by the other participants in the study or the assessment of the commercial software program. Two readings of the same mammograms were performed a month apart. The order of the studies in each of the two readings was random. All this information was recorded in an electronic database.
We used a commercially available breast density measurement software program for the AMULET Innovality (3000AWS7.0 option) Fujifilm® mammography machine for automated categorisation of breast density. This software program calculates breast density based on the ratio of fibroglandular tissue to total breast area.21 It uses this proportion to estimate breast density on a continuous scale and automatically assigns a category.
Endpoints of interest and statistical methodsWe evaluated intraobserver and interobserver variability for each participating professional by calculating linear weighted kappa coefficients, reported with a 95% confidence interval (CI). The coefficient was calculated for the four categories of breast density and for the dichotomous result of dense versus non-dense breast.
We also selected the majority report measure, defined as the statistical mode of the observers’ reports, consistent with pre-existing literature.22 We calculated the level of agreement between each evaluator and the majority report. In the event of a tie (non-unimodal categorisation distribution), a seventh imaging specialist categorised the mammogram to reach an agreement.
For the calculation of the linear weighted kappa coefficient (κ) we used the method described by Cohen and Fleiss.23,24 We reported kappa coefficients of interobserver and intraobserver agreement, which for their part were classified according to their level of agreement in accordance with the kappa coefficient breakdown proposed by Landis and Koch (0: “poor”; 0−0.2: “slight”; 0.21−0.4: “fair”; 0.41−0.6: “moderate”; 0.61−0.8: “substantial”; 0.81−1: “almost perfect”).25
Finally, we reported the concordance between the commercial software program and the majority report.
We used the statistics software programs STATA version 14 and R version 3.6.0. A p-value <0.05 was considered significant.
The participating investigators declare that they have no conflicts of interest.
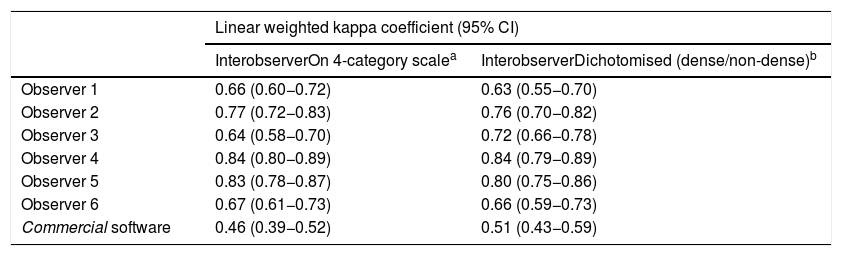
ResultsThe frequency of the categories assigned by each specialist is shown in Fig. 1. The linear weighted kappa values for overall interobserver agreement (between each specialist and the majority report) at the time of the first evaluation are shown in Table 1. These values attained a range of 0.64 (CI: 0.58−0.70) to 0.84 (CI: 0.80−0.89) for the category analysis. In other words, a moderate to almost perfect agreement was reached between each observer and the majority report. Similar values were obtained when the results were analysed dichotomously from a clinical perspective and the images were categorised as “dense breast” or “non-dense breast”.

Linear weighted kappa coefficient between each specialist and the majority report.
| Linear weighted kappa coefficient (95% CI) | ||
|---|---|---|
| InterobserverOn 4-category scalea | InterobserverDichotomised (dense/non-dense)b | |
| Observer 1 | 0.66 (0.60−0.72) | 0.63 (0.55−0.70) |
| Observer 2 | 0.77 (0.72−0.83) | 0.76 (0.70−0.82) |
| Observer 3 | 0.64 (0.58−0.70) | 0.72 (0.66−0.78) |
| Observer 4 | 0.84 (0.80−0.89) | 0.84 (0.79−0.89) |
| Observer 5 | 0.83 (0.78−0.87) | 0.80 (0.75−0.86) |
| Observer 6 | 0.67 (0.61−0.73) | 0.66 (0.59−0.73) |
| Commercial software | 0.46 (0.39−0.52) | 0.51 (0.43−0.59) |
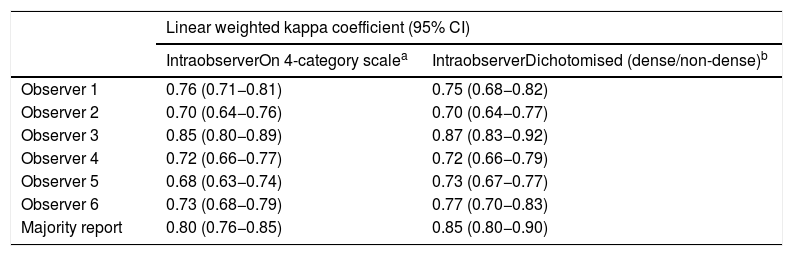
The linear weighted kappa values for intraobserver agreement between the first and the second observation are shown in Table 2. The results attained a range of 0.68 (CI: 0.63−0.74) to 0.85 (CI: 0.80−0.89). For the dichotomous analysis, the results were 0.70 (CI: 0.64−0.77) to 0.87 (CI: 0.83−0.92). For the above-mentioned results, the values correspond to a level of agreement between substantial and almost perfect.
Linear weighted kappa coefficient for each specialist in the readings a month apart.
| Linear weighted kappa coefficient (95% CI) | ||
|---|---|---|
| IntraobserverOn 4-category scalea | IntraobserverDichotomised (dense/non-dense)b | |
| Observer 1 | 0.76 (0.71−0.81) | 0.75 (0.68−0.82) |
| Observer 2 | 0.70 (0.64−0.76) | 0.70 (0.64−0.77) |
| Observer 3 | 0.85 (0.80−0.89) | 0.87 (0.83−0.92) |
| Observer 4 | 0.72 (0.66−0.77) | 0.72 (0.66−0.79) |
| Observer 5 | 0.68 (0.63−0.74) | 0.73 (0.67−0.77) |
| Observer 6 | 0.73 (0.68−0.79) | 0.77 (0.70−0.83) |
| Majority report | 0.80 (0.76−0.85) | 0.85 (0.80−0.90) |
The agreement between the majority report and the commercial software program was moderate for the four categories and for the dichotomous analysis, with kappa values of 0.46 (CI: 0.39−0.52) and 0.51 (CI: 0.43−0.59), respectively.
DiscussionBreast density is an independent risk factor for developing breast cancer. Categorisation of breast density is essential for performing a personalised risk assessment and efficiently supplementing population screening efforts with higher-sensitivity studies in patients with dense patterns, such as magnetic resonance imaging and breast ultrasound.26 This factor may be used to select the most appropriate method for diagnosis of each patient. This prevents clinicians from performing too many or not enough complementary tests, thus preventing delays in due access to said tests.
This study evaluated interobserver and intraobserver variability in a diagnostic imaging department in categorising breast density, based on the 5th edition of the BI-RADS® Atlas.
Interobserver agreement for breast density was substantial in the concordance between the six radiologists and the majority report, both for the four-category scale and for the dichotomous (dense/non-dense) categorisation. When we analysed similar studies in the scientific literature, we found highly variable results. Some groups have reported more mixed observations. Some studies have shown interobserver concordance between pairs of radiologists ranging from slight to substantial, with kappa values ranging from 0.02 to 0.72 (mean = 0.46; 95% CI: 0.36−0.55).27 Other studies, by contrast, have reported values similar to those presented in this study.22,27–30 The fact that the group of physicians participating in the study engage in regular academic activities, grand rounds, updates, report audits and so on could account for these results.
In its evaluation of intraobserver variability, our study recorded kappa values with substantial and almost perfect agreement,31 both on a four-category scale and on a dichotomous scale, with no statistically significant difference between them. However, we should mention the potential risk of bias due to the brief period that elapsed between the two readings.
In relation to the above, while we found studies that reported a statistically significant difference for observers with more than 10 years of experience in mammogram diagnosis,28 our results diverged from theirs. This may be explained by the fact that the medical team belongs to a specialised section with uniform diagnostic criteria, regular update meetings and an exclusive focus on breast diagnosis. As mentioned, the evaluators participated in an update session on criteria for breast density categorisation prior to the start of the study. Therefore, our results could be generalised to centres with the same characteristics.
The main advantages of an automated diagnostic tool are its consistency over time and lack of variability.32 Hence, an observer-independent automated system enables reproducible measurements and should be more appropriate for a reliable, standardised evaluation. In this study, agreement between the majority of the physicians and the commercially available software program was moderate. This could be attributed, in the first place, to the fact that the criteria associated with the two characterisation methods are different. Visual categorisation is primarily based on professional knowledge and experience, whereas the automated method uses a quantitative strategy to determine the ACR category. Second, development and validation processes for a software tool are determinant of its performance in different scenarios. It would be useful to explore the reasons for this difference in future studies.
Although this study was conducted at a single institution, it is a leading institution and receives referrals from all over Argentina on a daily basis. A multi-centre study would be a good idea for evaluating new technologies. The sample used had a limited number of cases with a breast density pattern classified as extremely dense (ACR d), consistent with the prevalence thereof according to department reports over the past five years, which hovers around 1–2%. Even so, the total prevalence of high density (categories c and d) in the sample was 41%, also consistent with the prevalence in our hospital population. The number of mammograms used and the randomised order of the studies avoided memory biases due to potential effects of familiarisation with the sample of mammograms between the two observation periods. Finally, our design ensured that the physicians were blinded to the reports issued by the automated classification software and the diagnoses made by all the other evaluators.
ConclusionAlthough there is general variability between observers and even within a single operator, qualitative classification of breast density is an acceptable method with moderate to almost perfect interobserver and intraobserver agreement according to the criteria established in the 5th edition of the BI-RADS® Atlas. We found a moderate level of agreement between the reports of the specialists and a commercially available software program. Future studies will be able to examine and characterise agreement between specialists and automated classification methods in greater depth.
AuthorsStudy integrity: SB, KP.
Study concept: MT, KP, JF.
Study design: BB, JF.
Data acquisition: MJC, MPS.
Data analysis and interpretation: BB, JF, MT, KP.
Statistical processing: BB, MT.
Literature search: JF, MT, KP, MJC.
Drafting of the paper: JF, MT, KP, BB, MPS.
Critical review of the manuscript with intellectually significant contributions: SB.
Approval of the final version: JF, MT, KP, BB, MPS, SB.
Conflicts of interestThe authors declare that they have no conflicts of interest.
Please cite this article as: Pesce K, Tajerian M, Chico MJ, Swiecicki MP, Boietti B, Frangella MJ, et al. Estudio de la variabilidad inter- e intraobservador en la determinación de la densidad mamaria según la 5.a edición del Atlas BI-RADS®. Radiología. 2020;62:481–486.

