


To qualitatively and quantitatively explore the spectral study of focal liver lesions, comparing it with the usual polychromatic assessment with single-energy computed tomography.
Material and methodsWe prospectively studied 50 patients with at least one focal liver lesion who were referred for abdominal multidetector computed tomography with intravenous contrast material. The portal phase was acquired with dual energy sources. The density of the lesions and of the surrounding liver parenchyma was measured both in the baseline polychromatic acquisition and in the posterior monochromatic reconstructions at 40keV, 70keV, and 140keV. Spectral curves were traced and the dual-energy indices and contrast-to-noise ratio were calculated. Lastly, the quality of the images and the detectability of the lesions were assessed qualitatively.
ResultsDensitometric differences between the different types of lesions (avascular and vascularized) and the liver were greater at low energy levels (left side of the spectral curve) than in the polychromatic evaluation. In the subjective assessment, the 40keV energy level had the greatest lesion detectability.
ConclusionsMonochromatic spectral study with dual-energy computed tomography provides better lesion detectability at 40keV compared to that provided by the ordinary polychromatic evaluation.
Explorar cualitativamente y cuantitativamente el estudio espectral de las lesiones focales hepáticas, comparándolo con la valoración policromática habitual de la tomografía de energía simple.
Mèc)todoEl presente estudio prospectivo incluyó 50 pacientes remitidos para la realización de tomografía computada multidetector abdominal con contraste intravenoso, que tuvieran al menos una lesión focal hepática. La fase portal fue adquirida con energía dual. Se realizaron mediciones densitomèc)tricas de las lesiones y del parèc)nquima hepático circundante, tanto en la adquisición policromática basal como en las posteriores reconstrucciones monocromáticas a 40, 70 y 140 keV. Se trazaron las curvas espectrales y se calcularon los índices de doble energía y la relación contraste-ruido. Por último, se hizo una valoración subjetiva de la calidad de las imágenes y la detectabilidad lesional.
ResultadosLas diferencias densitomèc)tricas entre los distintos tipos de lesiones (avasculares y vascularizadas) y el hígado fueron mayores a bajos niveles energèc)ticos (a la izquierda de la curva espectral) que en la evaluación policromática. En la valoración subjetiva, el nivel energèc)tico de 40keV presentó una mayor detectabilidad lesional.
ConclusionesEl estudio espectral monocromático mediante tomografía computada de energía dual provee una mayor detectabilidad lesional a 40keV en relación a la que se dispone con la valoración policromática habitual.
Focal liver lesions are a common finding using imaging modalities boosted by their growing use in patients with inspecific abdominal symtomatology. Their detection and management pose a daily challenge for the radiologist. The multidetector computed tomography (MDCT) scanner with intravenous (IV) contrast has proven its utility in the detection of liver lesions.1,2 In the field of selected images, there are numerous tools under development aimed at increasing lesion detectability.3,4
The computed tomography (CT) scan has been offering the possibility of data acquisition with different X-rays spectra for a few decades now•today we call it dual-energy computed tomography (DECT) scan. There are different modalities of DECT.5,6 Using the single source ultrafast kilovoltage commutation imaging modality, both high and low energy data are acquired (80 and 140kVp). This type of dual acquisition promotes the acquisition of polychromatic images (PI) that are similar to those generated by single-source energy CT scans.7 On the other hand, it promotes the reconstruction of virtual spectral monochromatic imaging (VSMI) in one energy spectrum that ranges from 40 to 140keV that behaves as if the source of X-rays produced photons in one energetic level only.5 The potential utility of VSMI for abdominal studies lays in its capacity to achieve enhanced contrast resolutions, which in turn increases its capacity of lesion detectability.8•11
Our goal was to explore both quantitative and qualitatively the spectral study (VSMI) of focal liver lesions and compare it to the polychromatic assessment (PI) of single energy source CT scans.
MethodStudy populationWe used a single-center prospective registry including consecutive patients referred to our center to undergo abdominal MDCT scans with IV contrast, between August and December, 2015. All patients with suspected or confirmed pregnancy and a body mass index >35kg/m2 were excluded as well as those with contraindications for the use of iodinated contrast like renal failure or a history of known allergies.
Out of the 310 initially eligible patients, four were excluded because they did not access the study with IV contrast, seven due to the fact that the acquisition and reconstruction parameters were inadequate and different to the pre-established parameters, and 107 patients because they did not meet the ethical and legal regulations on the disclosure of confidential information (habeas data). Thus, 192 patients were recruited, among which 142 did not show any focal liver lesions, so final recruitment was 50 patients.
Procedures were performed after approval from the institutional research ethics committee in compliance with the 1964 Declaration of Helsinki and further addenda. Prior informed written consent was obtained from all patients before performing the procedure and using the information for scientific purposes.
Protocol for imaging acquisitionImages were acquired using one 64 detector-row CT scan (Discovery HD 750, GE Healthcare, Milwaukee, USA), capable of obtaining single or dual-energy images. The patient was placed in the decubitus supine position on the stretcher of the CT scan and one antebrachial peripheral route was opened. Both the topogram and the acquisition phase were conducted without contrast os single energy from the dome of the liver to the iliac crests. Then using one infusion pump the iodinated IV contrast was administered (iobitridol, Xenetix¨r), 350mg I/ml, Guerbet, France) at a speed of 3•4ml/s and with a volume of 1ml/kg of the patient's own weight. After 80s the portal phase was acquired with dual-energy from the dome of the liver to the pubic symphisis.
The phase without contrast was acquired via the helicoidal scanning, using single energy source, with one 120kV power tube and a 110•400mA electric current (media: 298mA). The portal phase was acquired with 80•140kV, 360mA using dual-energy source. The average CTDIvols were 7.1 and 8.9mGy, respectively. In both phases the pitch was 1.38:1, with a 50cm field of view (FOV), 2.5mm thickness and a 1.25mm increase.
Imaging process and reconstructionData process was conducted using one working station equipped with specific software available today (Gemstone Spectral Imaging Viewer, Advantage Workstation 4.6, GE Healthcare, Milwaukee, USA).
The images initially acquired from the portal phase provide us with conventional polychromatic information corresponding to 77keV, which is equivalent to the information obtained with single energy source CT scans at 120kV. This is why such images were used in representation of one single energy portal acquisition, thus avoiding a new acquisition that would have implied a higher dose of radiation for the patient.7,11
Similarly, VSMIs at 40, 70 and 140keV were reconstructed too. Upper and lower limit values (40 and 140keV) from the monoenergetic spectrum were picked in order to allow spectral curve tracing of liver lesions. The value of 70keV was also picked since it is the monochromatic level that produced fewer noises and higher contrast-to-noise ratios (CNR) in other studies published.9,12•14 In all cases the Adaptive Statistical Iterative Reconstruction (ASIR) at 40% was implemented to the crude data acquired, since we have been able to confirm that this technique enhances the quality of images while using lower doses of radiation.15,16 The iterative reconstruction was not available for the monoenergetic level of 40keV.
Quantitative imaging analysisThe analysis of the images was conducted in the same working station where the images where processed by one radiologist.
Out of all the patients included, only those studies that showed at least one focal liver lesion in any of the two phases were picked. All images surrounded by levels of attenuation different to the surrounding liver parenchyma, excluding the normal biliary and vascular intrahepatic structures were considered focal lesions.
In multiple liver lesions of equal behavior in the phases with and without contrast, measurements on lesions of largest maximum diameter were taken in the axial plane. Multiple liver lesions of different behaviors in the two phases of acquisition were analyzed separately, considering for every subtype the lesion with the largest diameter in the axial plane.
In all lesions the maximum diameter in the axial plane was measured and lesions were classified into two (2) different categories: (1) avascular lesions, mostly simple cysts, without enhancement after the administration of IV contrast, and (2) vascular lesions, with at least 15HU enhancement in the portal phase starting from the basal phase without contrast.
Measurements in Hounsfield units (HU) were taken of the focal liver lesions and the surrounding liver parenchyma using the manual positioning of the circular or eliptic regions of interest (ROI). When it comes to the lesions, the ROI defined corresponded to the two thirds of the total area of the lesion of central location. In the four (4) groups of images assessed (PI and VSMI at 40, 70 and 140keV) the ROI remained unchanged when it comes to its size, shape, and positioning. Each measurement was repeated three (3) times in just one cut in order to obtain the average.
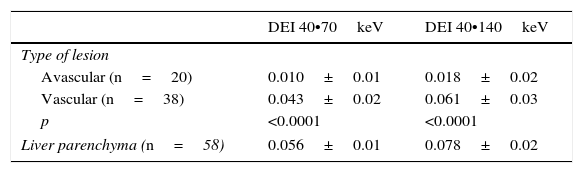
The dual-energy indices were established between 70 and 40keV, and between 140 and 40keV using the following formula: HUA∧HUB/HUA+HUB+2000, where HUA represents the attenuation of the lesion in HU at the lowest energy level, and HUB represents the attenuation of the lesion at the highest energy level.17 Lastly, the CNR of both lesion groups was measured using the following formula: (HUL∧HULP)/SDL, where HUL represents the attenuation of the lesion, HULP is the attenuation of the surrounding liver parenchyma and SDL is the standard deviation of liver HUs.18
For both phases of acquisition the effective radiation dose (ERD) was estimated in millisieverts multiplying the dose-length product by the abdominal k-conversion coefficient (kabd: 0.015mSv/mGycm), following the method proposed by international guidelines.19,20
Qualitative imaging analysisThe qualitative analysis was performed independently and blindly by two (2) highly experienced radiologists in the performance of abdominal computed tomography (CT) scans. Three (3) sets of data were analyzed comparatively: PIs and VSMIs at 40 and 70keV. Monochromatic data at 140keV were excluded from the qualitative analysis since they were images that, yet despite their low noise, achieve such an attenuation of iodinated contrast that they behave similarly to an acquisition without virtual contrast.21
The quality assessment of the images was conducted using one 5-point Likert scale being 5 excellent image quality without noise or artifacts with a satisfactory detection of details; 4, good image quality, some noise or artifacts and a lower detection of details; 3, regular image quality with moderate artifacts, noise, and clarity to be able to identify the anatomical structures with loss of details; 2, poor image quality with important artifacts and noise, which makes the diagnosis based on its prospective findings questionable; and 1, poor non-diagnostic image quality.
To assess image detectability, one 4-point Likert scale was used being 4 excellent; 3, good; 2, moderate; and 1, poor.
In all cases, the window width and level were optimized for every set of images.
Statistical analysisThe categorical variables were expressed as frequencies and percentages, and the continuous variables as average±standard deviation. The parametric comparisons among groups were analyzed using the Student's t test, ANOVA and Bonferroni tests in order to make multiple comparisons among different groups. The reproducibility of the method on lesion detectability was assessed using the interclass correlation coefficient, the two way randomized model, and the assessment of the absolute level of concordance and average measures, reporting a 95% confidence interval (95% CI). The level of statistical significance was set at p<0.05. The analysis was conducted using the statistical software SPSS, version 22.0 (Chicago, IL, USA).
ResultsThe study population included 50 patients and 58 lesions. The average age was 61.1±13.4 years, and 21 patients (42%) were males. The body mass index was 25±5.1kg/m2.
The average maximum diameter of the lesions was 19.3±15.3mm. Lesions were divided into two (2) subgroups: avascular (n=20) and vascular (n=38).
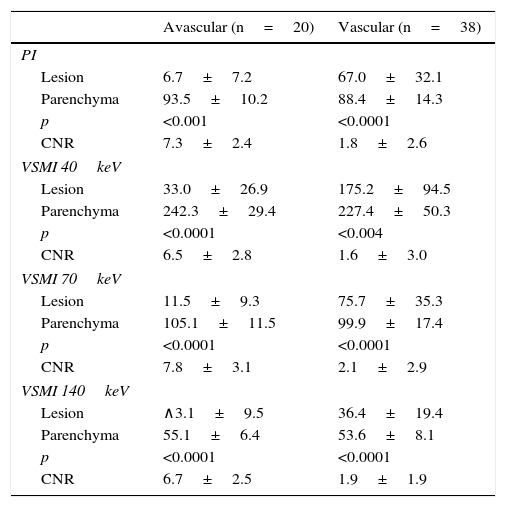
The densitometric measurement of the lesions and the surrounding parenchyma measured in HUs was conducted comparatively between the PIs and the VSMI, as shown in Table 1. The attenuation differences seen between the focal lesions and the liver were 86.7±8.9HU and 32.6±23.0HU in the polychromatic assessment (for avascular and vascular images, respectively), with values of 209.3±39.3HU and 95.1±67.8HU in VSMI at 40keV, being significantly higher for images at 40keV (p<0.0001).
Paired differences of HU averages between avascular, hypovascular, and hypervascular lesions and the adjacent liver parenchyma in virtual spectral polychromatic and monochromatic portal phase at a 40, 70 and 140keV. Contrast-to-noise ratios are included.
| Avascular (n=20) | Vascular (n=38) | |
|---|---|---|
| PI | ||
| Lesion | 6.7±7.2 | 67.0±32.1 |
| Parenchyma | 93.5±10.2 | 88.4±14.3 |
| p | <0.001 | <0.0001 |
| CNR | 7.3±2.4 | 1.8±2.6 |
| VSMI 40keV | ||
| Lesion | 33.0±26.9 | 175.2±94.5 |
| Parenchyma | 242.3±29.4 | 227.4±50.3 |
| p | <0.0001 | <0.004 |
| CNR | 6.5±2.8 | 1.6±3.0 |
| VSMI 70keV | ||
| Lesion | 11.5±9.3 | 75.7±35.3 |
| Parenchyma | 105.1±11.5 | 99.9±17.4 |
| p | <0.0001 | <0.0001 |
| CNR | 7.8±3.1 | 2.1±2.9 |
| VSMI 140keV | ||
| Lesion | ∧3.1±9.5 | 36.4±19.4 |
| Parenchyma | 55.1±6.4 | 53.6±8.1 |
| p | <0.0001 | <0.0001 |
| CNR | 6.7±2.5 | 1.9±1.9 |
VSMI: virtual spectral monochromatic imaging; PI: polychromatic images; CNR: contrast-to-noise ratio.
Fig. 1 shows spectral curves in the portal phase of the averages of both lesion groups and liver parenchyma. The curve tracing is overlapped by data obtained from polychromatic assessment.
 compared to the liver parenchyma. PI: polychromatic images (77keV) whose attenuation values were 90.1±13.2HU for the liver parenchyma; 6.7±7.3HU for avascular lesions, and 67.0±32.1HU for vascular lesions.")
Spectral curves representing the average attenuation values in the portal phase of the images under analysis (avascular and vascular) compared to the liver parenchyma. PI: polychromatic images (77keV) whose attenuation values were 90.1±13.2HU for the liver parenchyma; 6.7±7.3HU for avascular lesions, and 67.0±32.1HU for vascular lesions.
The dual-energy indices showed significant differences in both groups of lesions, both in the 40 vs 70keV and the 40 vs 140keV comparison (p<0.0001 in both cases) (Table 2).
The average ERD in the phase without contrast was 3.5±1.8mSv, while the average ERD for the portal phase was 6.7±0.5mSv, with a total ERD of 10±2.4mSv.
When it comes to qualitative assessment, good interobserver concordance was confirmed (interclass correlation coefficient: 0.82; 95% IC: 0.74•0.88; p<0.0001). The Liker quality scale showed the following average results: 4.5±0.6 for the PIs, 3.8±0.6 for the VSMIs at 40keV and 4.8±0.4 for the VSMIs at 70keV (p<0.0001). All images assessed were diagnostic, that is, with values in the quality scale ≥3. The Liker detectability scale showed the following average results: 3.0±0.7 for the PIs, 3.8±0.5 for the VSMIs at 40keV, and 3.3±0.5 for the VSMIs at 70keV (p<0.0001), being lesion detectability at 40keV significantly higher than in the other two (2) groups analyzed (p<0.0001) (Figs. 2 and 3).
; polychromatic imaging; and (B) virtual spectral monochromatic imaging at 70keV (C). The right lobe of the liver shows two (2) small simple adjacent cysts that are visible in the three (3) images (black arrow). Located immediately anterior to these cysts we can see one subtle hypoattenuated lesion that is only visible in the monochromatic image at 40keV (white arrow in B).")
Illustrative example of one avascular focal liver lesion assessed using one dual-energy CT scan during the portal phase. Comparative study among virtual spectral monochromatic imaging at 40keV (A); polychromatic imaging; and (B) virtual spectral monochromatic imaging at 70keV (C). The right lobe of the liver shows two (2) small simple adjacent cysts that are visible in the three (3) images (black arrow). Located immediately anterior to these cysts we can see one subtle hypoattenuated lesion that is only visible in the monochromatic image at 40keV (white arrow in B).
; polychromatic imaging; and (B) virtual spectral monochromatic imaging at 70keV (C). One voluminous lesion in liver segments V and VI, adjacent to the gallbladder, may be seen showing hypervascular nodular enhancement areas which is compatible with one giant liver hemangioma (arrow). Finding of one small simple cyst located in the anterior leaflet of the right kidney (asterisk). Please note that both polychromatic and monochromatic images at 70keV show similar image quality and lesion detectability, while the monochromatic assessment at 40keV shows one image with a little more noise but with more tissue contrast; thus the lesion enhancement areas in image A are more conspicuous.")
Illustrative example of one vascular focal liver lesion assessed using one dual-energy CT scan during the portal phase. Comparative study among virtual spectral monochromatic imaging at 40keV (A); polychromatic imaging; and (B) virtual spectral monochromatic imaging at 70keV (C). One voluminous lesion in liver segments V and VI, adjacent to the gallbladder, may be seen showing hypervascular nodular enhancement areas which is compatible with one giant liver hemangioma (arrow). Finding of one small simple cyst located in the anterior leaflet of the right kidney (asterisk). Please note that both polychromatic and monochromatic images at 70keV show similar image quality and lesion detectability, while the monochromatic assessment at 40keV shows one image with a little more noise but with more tissue contrast; thus the lesion enhancement areas in image A are more conspicuous.
The main finding from our study was that the use of monochromatic images at low energy levels (40keV) resulted in greater densitometric differences between liver lesions and the surrounding parenchyma, compared to the monochromatic and polychromatic assessment at medium-high energy levels (70 and 140keV).
The higher lesion detectability achieved by the monochromatic spectral assessment would enable abdominal studies through computed tomography (CT) scans with fewer doses of IV iodinated contrast, which would be particularly useful with monorenal patients, or patients with reduced creatinine clearance.22 However, our findings are only hypothesis-generating findings since lesion detectability at low doses of contrast has not been studied yet, although numerous studies show excellent diagnostic results with reduced doses of contrast in the assessment of vascular structures.23•25
When it comes to image quality, the CNR was significantly higher than 70keV rather than 40keV even compared to the PI both in avascular and vascular lesions. Same thing happened with qualitative assessment.
Our results are consistent with other studies12•14 that established that the optimal energy level for the study of the abdomen, in general, hepatocarcinomas and hipovascular metastases, in particular, is 70keV. However, as we mentioned before, the highest lesion detectability was seen at low energy levels (40keV). This increase of tissue contrast is achieved at the expense of more noise in the images that, actually, is possible to reduce today by implementing ASIR (our machine operates with software that allows its use for levels >60keV only).
On the other hand, estimating the dual-energy index may be of great utility since it exhibits significant differences between avascular and vascular lesions. One major differentiation between lesions (of cystic nature) without enhancement and those with enhancement after the administration of contrast may be extremely valuable in focal lesions <1cm, informed, many times, as unspecific when studied using single energy source and capable of generating anxiety in the patient yet despite its small size. For example, one oncologic patient may have the diagnosis of one cystic lesion with the simple acquisition of a portal phase using the dual-energy technique, without the need for the basal phase, with the corresponding reduction of the dose of radiation received.
Another DECT modality capable of obtaining VSMI is the dual-energy source of X-rays through which Wang et al.26 also described the spectral curves of different liver lesions (cysts, hemangiomas, metastases and hepatocarcinomas). In this dual-tube technology, one of the tubes operates at 80kV and the other one at 140kV. This imaging modality has some disadvantages like, for example, the restriction in the size of the second tube FOV (26cm in 1st generation machines and 33cm in 2nd generation CT scans) with only one tube operating at 50cm. The acquisition of DECT scan images with ultrafast commutation of the kilovoltaje used in our study was not confined in the FOV (50cm).9,11,27
When it comes to the dose of radiation, the ERD of the portal phase was almost double the ERD of the phase without contrast meaning basically that the former entails a longer length of acquisition as we already mentioned before and, to a lesser extent, a slightly higher dose of radiation (CTDIvols).
This study has some limitations. In the first place, comparisons were conducted without one modality of reference such as the MRI, the interventional techniques, or pathological anatomy, with proven global capacity for the characterization of liver lesions, which would also allow us to discriminate the etiology of the lesions with an added clinical value. On the other hand, since it was a relatively small sample of patients, it may be subject to selection bias. The analysis of the arterial phase, that may also be particularly useful for the detection of hypervascular lesions, as other studies confirmed, was not included either.28,29 Finally, the use of a fixed 80-second time delay in the acquisition of the exam, although validated as the standard delay by the guidelines, may produce variations in the densities measured which is why maybe it would have been more accurate to use the bolus tracking technique in order to eliminate variability due to the patient's hemodynamic state. Future studies should include a larger number of lesions, analyze their behavior based on their own size, and assess other tools that the DECT scan has to offer, such as material decomposition maps (iodine and water).
In sum, in this study we confirmed the higher liver lesion detectability using virtual monochromatic images at low energy levels compared to conventional polychromatic assessments.
Ethical disclosuresProtection of human and animal subjectsThe authors declare that the procedures followed in this study abide by the ethics and regulations of the Human Research Committee, the World Health Organization and the Declaration of Helsinki.
Confidentiality of dataThe authors declare that they have followed the protocols from their centers on the disclosure of data from patients.
Right to privacy and informed consentThe authors have obtained prior written informed consent from the aforementioned patients. This document belongs to the corresponding author.
FundingWe hereby declare that no sponsor has funded this paper.
Authors' contribution- 1.
Manager of the integrity of the study: KNL and PMC.
- 2.
Study idea: JV and KNL.
- 3.
Study design: ER and KNL.
- 4.
Data mining: CC, ES and KNL.
- 5.
Data analysis and interpretation: JBC, KNL and PMC.
- 6.
Statistical analysis: KNL.
- 7.
Reference: JBC, KNL and PMC.
- 8.
Writing: ER, KNL and PMC.
- 9.
Critical review of the manuscript with intellectually relevant remarks: CC, ER, ES, JBC, JV, KNL and PMC.
- 10.
Approval of final version: CC, ER, ES, JBC, JV, KNL and PMC.
We hereby declare that Dr. Patricia Carrascosa, MD is a consultant of GE. There are no conflicts of interests associated with the remaining authors.
Please cite this article as: Lago KN, Vallejos J, Capuñay C, Salas E, Reynoso E, Carpio JB, et al. Tomografía computada de doble energía para la detección de lesiones focales hepáticas. Radiología. 2017;59:306–312.

