


Magnetic resonance imaging has become a fundamental tool for the evaluation of head and neck tumors. The anatomic details that magnetic resonance images provide are fundamental for diagnosing, characterising, and staging both primary tumors and lymph node metastases.
In addition to technical improvements in anatomic sequences, such as Dixon techniques to improve fat suppression, other sequences being developed, such as diffusion and perfusion, provide molecular, biological, and physiological information about the tumor and are yielding imaging biomarkers that can help in determining the tumor's biology at the time of diagnosis and in the follow-up of the disease. Magnetic resonance imaging also provides very useful information about the response to treatment.
La resonancia magnética se ha convertido en una herramienta fundamental en la valoración de la patología tumoral de cabeza y cuello. Los detalles anatómicos que proporcionan las imágenes de resonancia son fundamentales para diagnosticar, caracterizar y estadificar tanto la tumoración primaria como las metástasis ganglionares.
Además de las mejoras técnicas en las secuencias anatómicas, como es el caso del Dixon para mejorar la supresión de la grasa, se están desarrollando otras secuencias como son la difusión y la perfusión, que dan información molecular, biológica y fisiológica del tumor proporcionando biomarcadores que pueden ayudar a conocer la biología del tumor en el momento del diagnóstico y posteriormente a monitorizar la enfermedad, y facilitan información muy relevante de la respuesta al tratamiento.
Head and neck tumours are very prevalent in our setting, with more than 550,000 cases and 380,000 deaths annually.1 Traditional regimens with chemo/radiotherapy have high rates of locoregional recurrence, and are also aggressive treatments with significant side effects.2 In order to avoid patients being given unnecessary toxic therapies and to gain time with second-line treatments, the development of advanced neuroimaging tools which can help identify tumours that will not respond to the classic treatment regimens is essential. This would enable personalised medicine, adapted to each patient and each tumour.
Conventional anatomical sequences provide very important information about the primary tumour, locoregional or perineural spread and lymphadenopathy, enabling diagnosis of the tumour and its extension.3 They are therefore fundamental, with an appropriate selection of protocols for their assessment. However, these sequences have limitations, such as not being able to assess metastatic disease in small lymph nodes or predict the response to treatment until a certain number of treatment cycles have been completed. Fortunately, functional sequences, such as diffusion and perfusion, are being developed in magnetic resonance imaging (MRI) which provide molecular, biological and physiological information about the tumour. These sequences are able to generate biomarkers which can help us understand the biology of the tumour at the time of diagnosis and in the follow-up of the disease, while also providing very useful information about the treatment response.
The last ten years have seen very interesting advances in anatomical and functional imaging techniques being developed and put into practice for the evaluation of head and neck tumours. In this article, for anatomical sequences, we review the advantages of acquiring Dixon sequences, and, in functional sequences, we examine the advanced diffusion models and perfusion.
Dixon sequencesFat suppression sequences are essential for accurate diagnosis and the characterisation of disease of the head and neck.4 There are essentially three types of fat suppression: techniques based on chemical shift (fat-sat or CHESS and water excitation techniques); inversion techniques (STIR); and hybrid techniques (SPIR and SPAIR).5,6 The most commonly used technique is the short inversion time inversion recovery (STIR) sequence, although there are also selective chemical artefact suppression sequences (CHESS) and hybrid methods such as spectral pre-saturation with inversion recovery (SPIR).6 Recently, however, multiple articles have started appearing in the specialist literature on the Dixon technique which, like the fat-sat and water excitation sequences, is based on chemical displacement.
Although the Dixon technique for fat suppression was first described in 1984,7 it was not used routinely as it was only recently that the necessary hardware was developed for the scanners used in clinical practice.
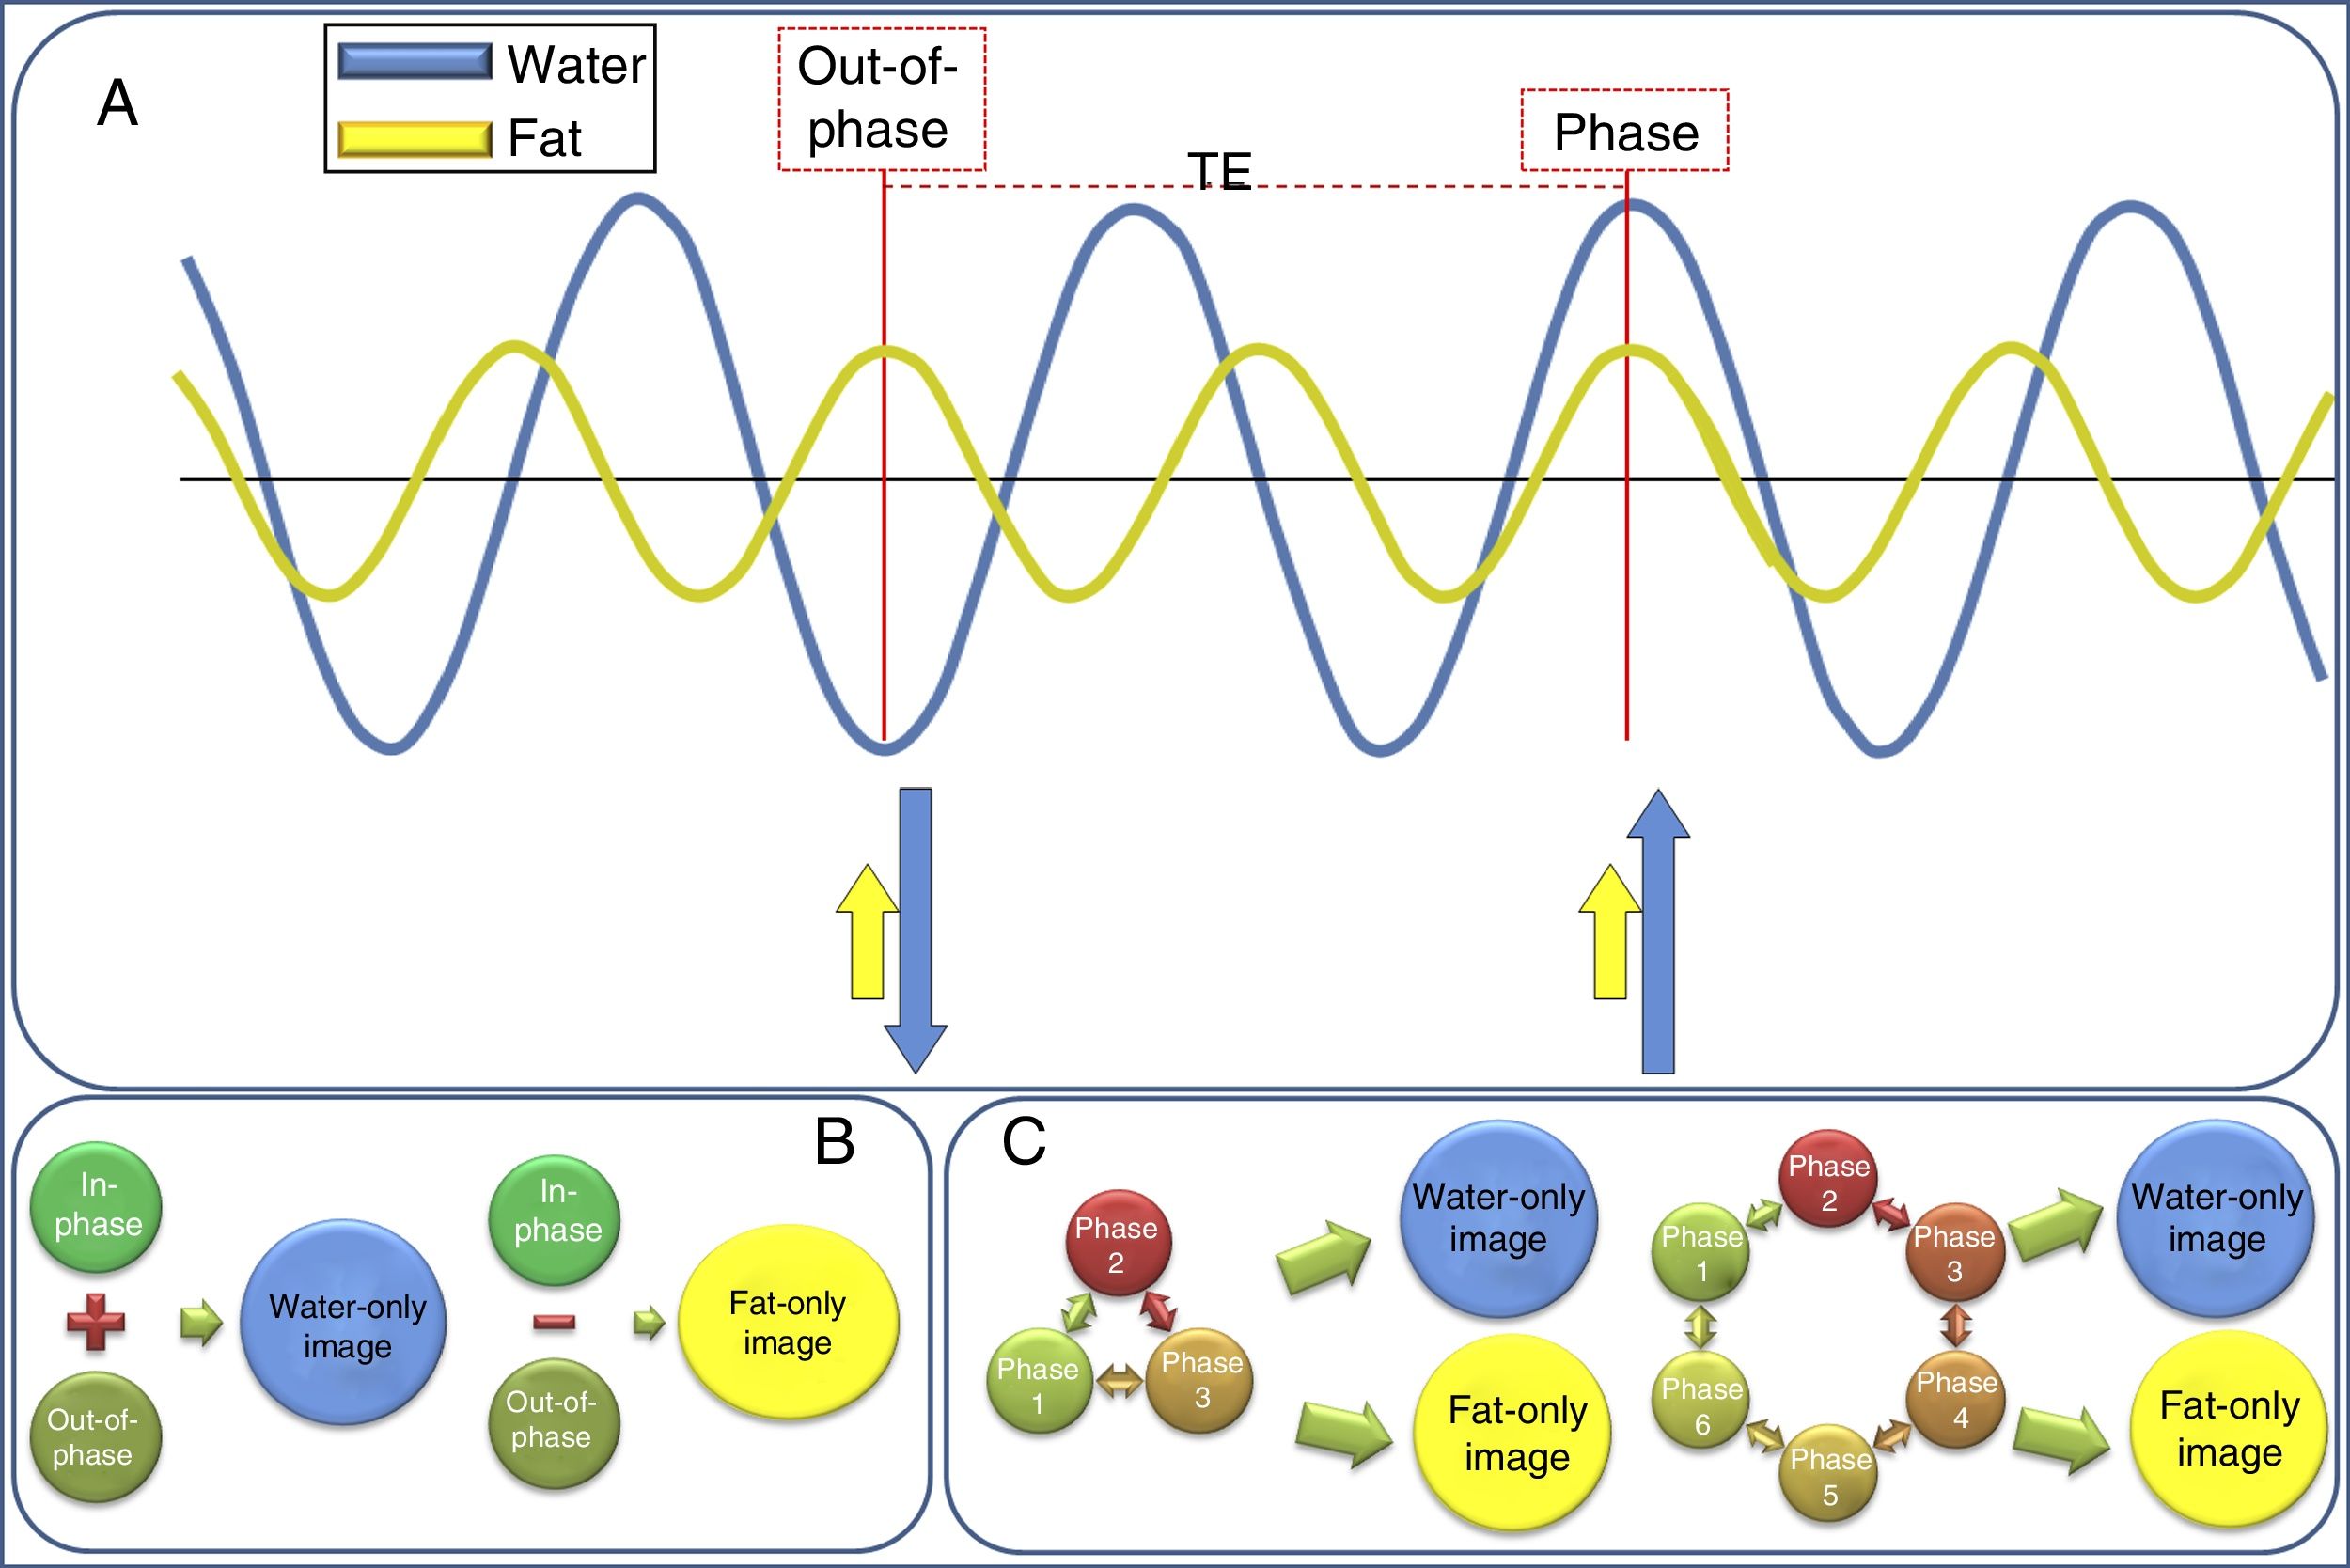
The physical basis of the technique is the fact that water and fat protons precess at different rates, known as chemical shift,8 and their magnetisation vectors therefore rotate with respect to each other between excitation and acquisition, being alternately “in-phase” (pointing in the same direction) and “out-of-phase” (pointing in opposite directions).9 Therefore, the data are acquired with a certain echo time (TE), taking into account the theoretical precession interval between the water and fat protons (Fig. 1). In the two-point Dixon technique initially described7 an acquisition is made at the TE at which the water and fat protons are in-phase (and thus the “in-phase signal” is obtained, equivalent to a conventional acquisition), and another acquisition at the TE at which the water and fat protons are out of phase (“out-of-phase signal”), with a TE difference between the in-phase and out-of-phase states of 2.2ms at 1.5T (i.e. the out-of-phase TE are at 2.2ms, 6.6ms, etc., and in-phase TE every 4.4ms, 8.8ms, etc.) and 1.1ms at 3T.9
 Water and fat protons precess at a different rate: known as “chemical shift”. This means that their protons are periodically in completely different phases: they may be in-phase (when they are together) or out-of-phase (when they are exactly the reverse, approximately every 2.4ms at 1.5T and every 1.1ms at 3T). This behaviour can be used to differentiate the signal that comes from the water protons from that of the fat protons. (B) Dixon")
Diagram of the physical bases of Dixon acquisition. (A) Water and fat protons precess at a different rate: known as “chemical shift”. This means that their protons are periodically in completely different phases: they may be in-phase (when they are together) or out-of-phase (when they are exactly the reverse, approximately every 2.4ms at 1.5T and every 1.1ms at 3T). This behaviour can be used to differentiate the signal that comes from the water protons from that of the fat protons. (B) Dixon's original description made this distinction taking only two TE, in-phase and out-of-phase, into account. (C) However, improvements have gradually been made to the technique to reduce the problems of field inhomogeneities, resulting in the three-, four- and six-phase Dixon techniques.
Later these two acquisitions can be combined to obtain a “water” image, taking the mean of the sum of the in-phase signal and the out-of-phase signal (where the water has signal, but the fat does not, and it is therefore equivalent to fat suppression); and a “fat” image obtained by taking the mean of subtracting the out-of-phase signal from the in-phase signal, where only the fat shows signal, but the water does not (Fig. 2).8
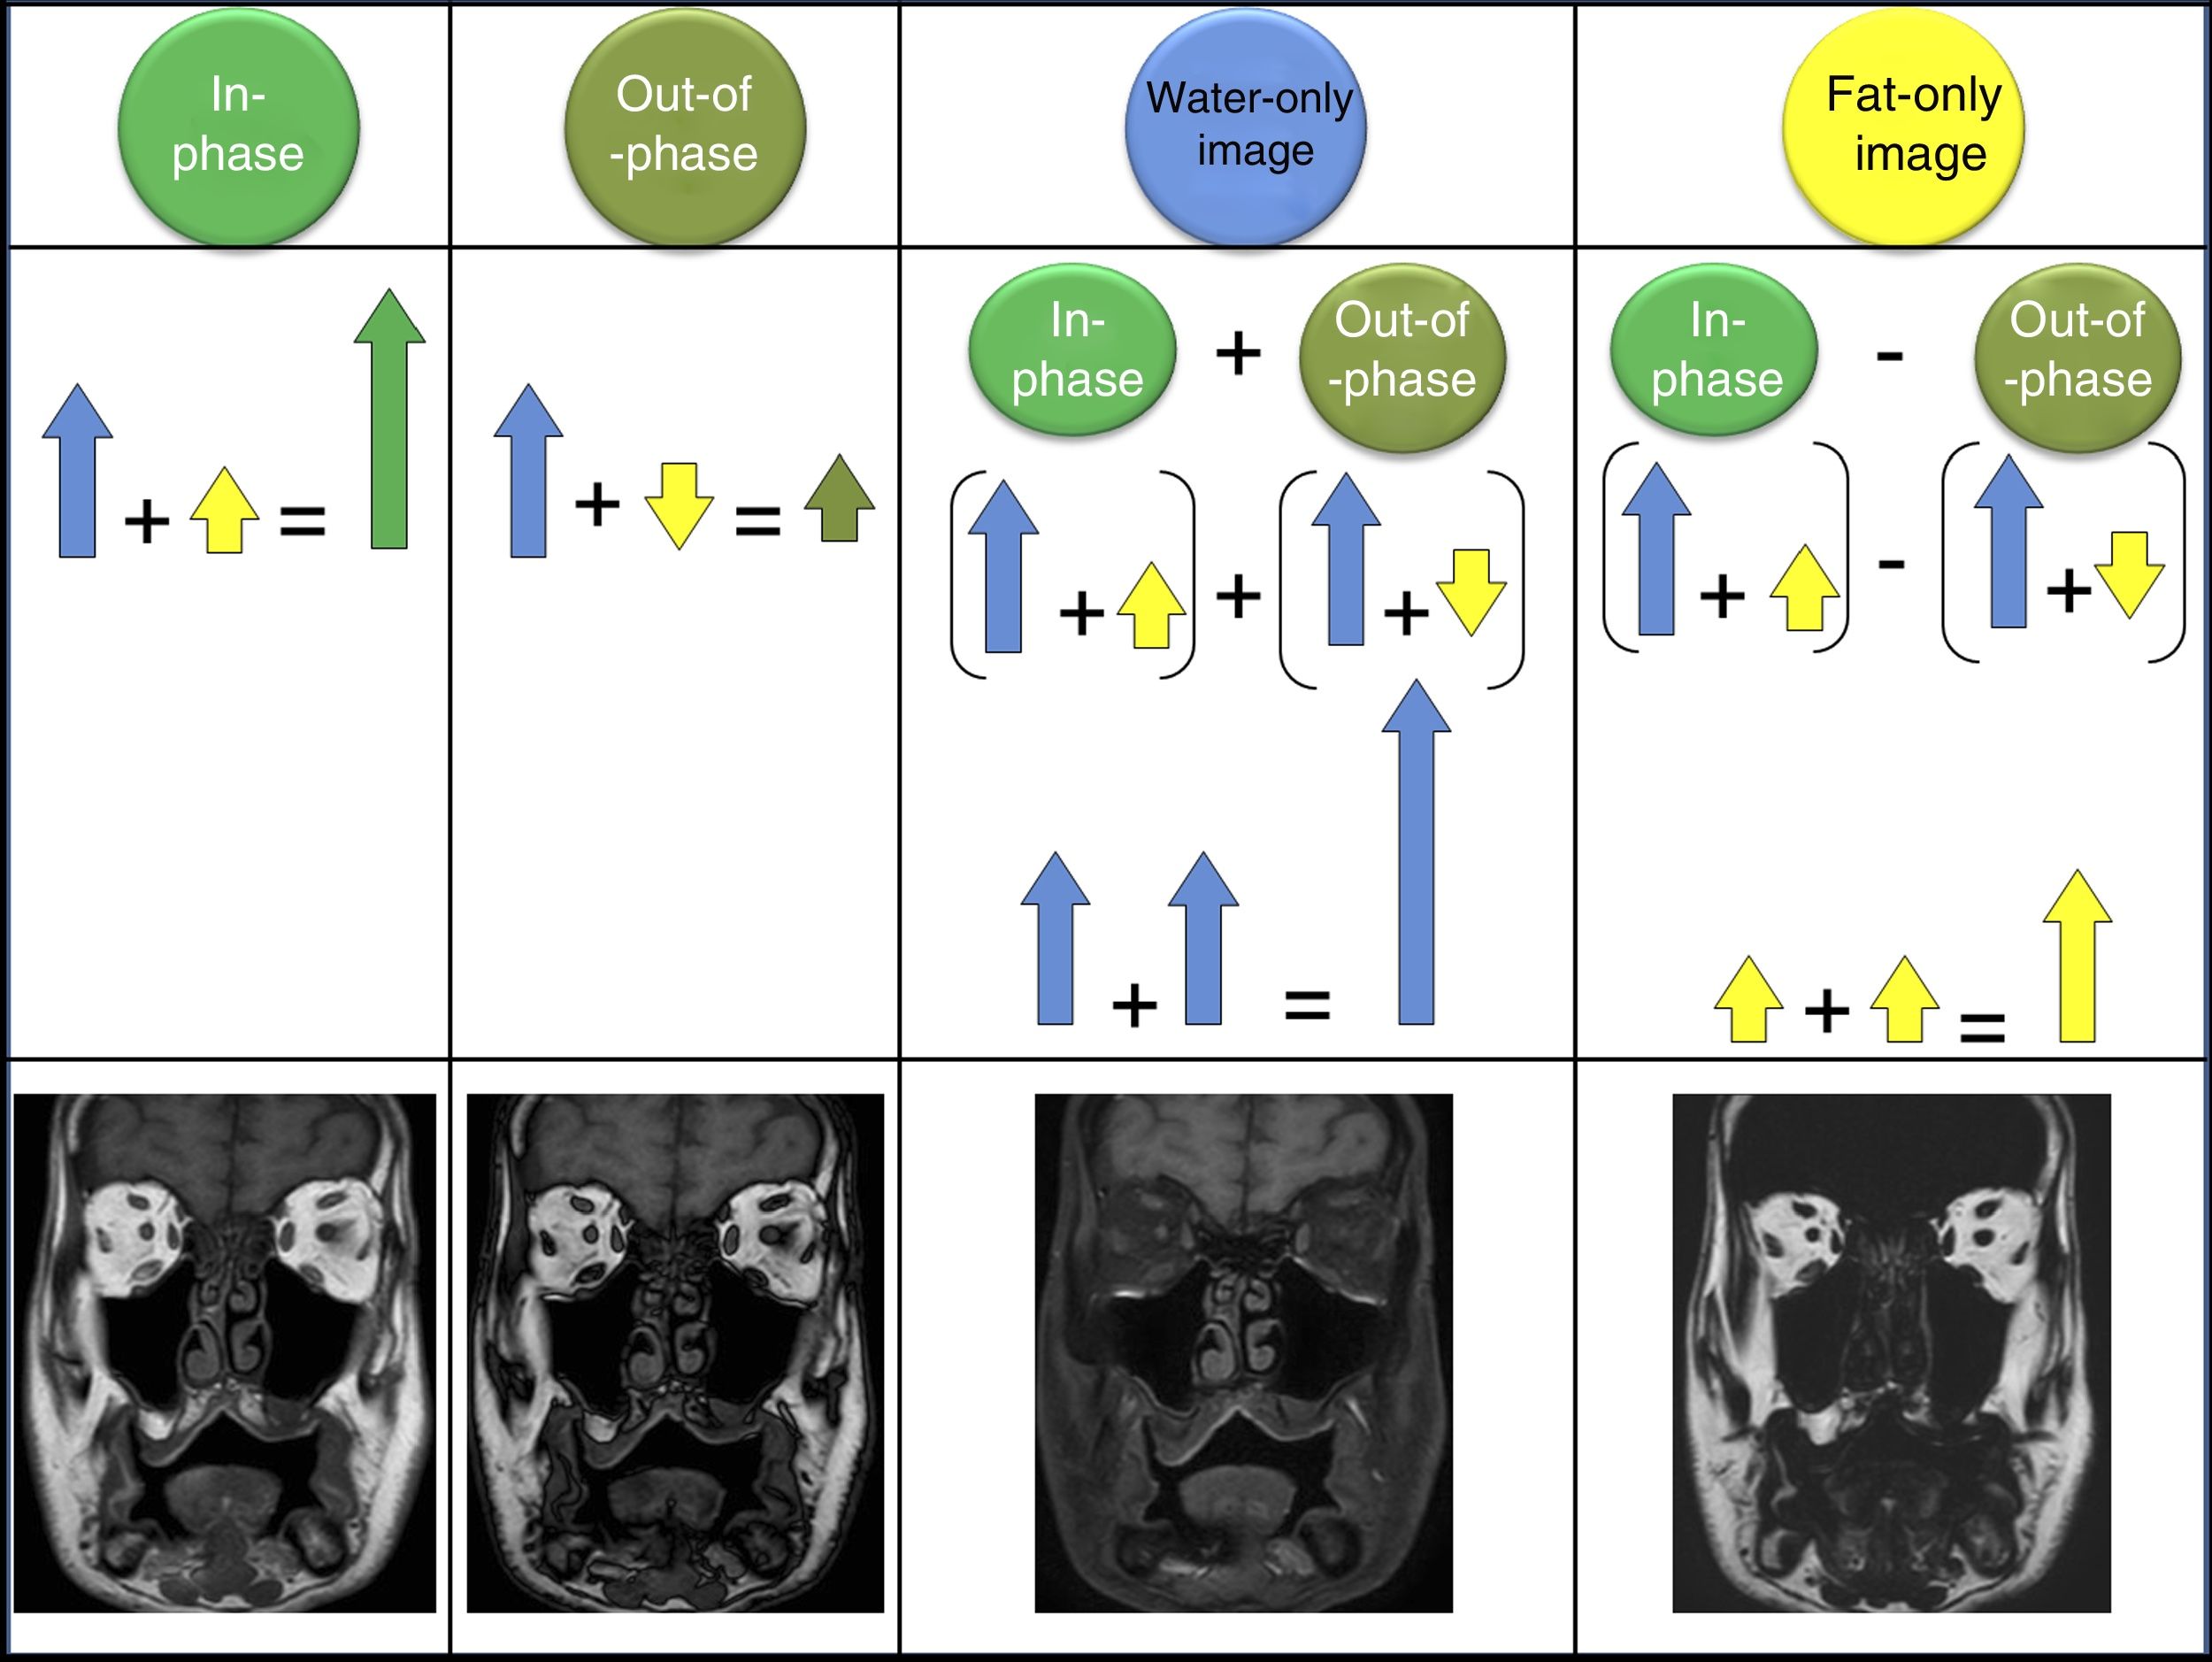
. Out-of-phase images are acquired when the water and fat protons are exactly in the opposed phase. The water-only image is obtained after subtracting the in-phase image from the out-of-phase image; this means the fat is left with no signal and only the water is present, resulting in a fat-suppressed image. The fat-only image is the result of subtracting the out-of-phase image from the in-phase image; so the water has no signal, it is cancelled out, and there is only a fat signal.")
When a Dixon acquisition is made four series of images can be automatically post-processed and reconstructed. The in-phase images are formed by adding the water and fat signals, obtaining an image which corresponds to a traditional acquisition (in this example, a T1). Out-of-phase images are acquired when the water and fat protons are exactly in the opposed phase. The water-only image is obtained after subtracting the in-phase image from the out-of-phase image; this means the fat is left with no signal and only the water is present, resulting in a fat-suppressed image. The fat-only image is the result of subtracting the out-of-phase image from the in-phase image; so the water has no signal, it is cancelled out, and there is only a fat signal.
This form of acquisition is simple, but requires that the field be very homogeneous,4 which is why the three-, four- and six-point Dixon techniques were developed (Fig. 1), with acquisitions at different TE.10,11
The Dixon sequence can be acquired in T1, T2 and proton density (PD) and with different techniques (spin echo and gradient echo). It can also be used after administering gadolinium-based contrast agents, which optimise visualisation of lesions, especially for “water-only” images (fat-suppression images).9
The use of these sequences in head and neck tumours has several advantages. First of all, the great advantage already mentioned that four maps are obtained in one single acquisition: the phase that is similar to a conventional sequence (T1, T2 or PD); the opposed phase, which delimits and identifies the microscopic fat and shows it as a signal drop; the water-only image, which is a fat-suppression sequence8; and the fat-only image, for which for the moment no application has been described in cancers of the head and neck. Dixon sequence acquisition takes more time than a conventional sequence or acquiring a STIR or SPIR fat suppression sequence, but given that these four series of images are obtained in one single acquisition, overall, the strategy saves a significant amount of time. However, it must be borne in mind that if the patient moves during acquisition, the motion artefact will propagate to all four series of images.
Dixon sequences with three or more points are not very sensitive to the inhomogeneities of the magnetic field, both B0 and B1, meaning that in the “water-only” image, the fat suppression is more homogeneous than with the other sequences.8 This acquires special importance in the proximity of the metallic implants often present in the mouth region in head and neck studies. Also, as the in-phase sequence is formed by the sum of the water and fat signal, it has more signal, which results in a higher quality image. Moreover, although the specific utility in the head and neck has not yet been described, the fat content can be quantified.
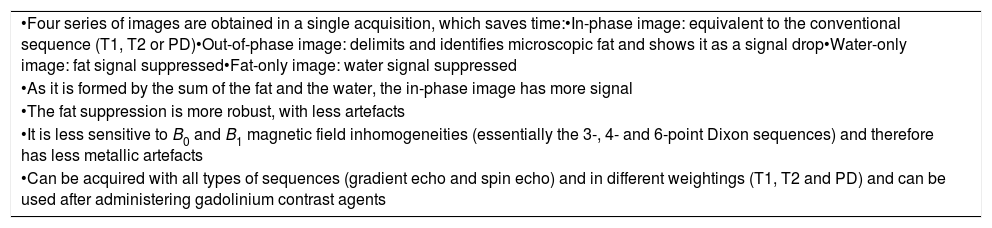
Table 1 summarises the main technical and clinical advantages of the application of Dixon sequences in the head and neck.
Main technical and clinical advantages of the application of Dixon sequences in the head and neck.
| •Four series of images are obtained in a single acquisition, which saves time:•In-phase image: equivalent to the conventional sequence (T1, T2 or PD)•Out-of-phase image: delimits and identifies microscopic fat and shows it as a signal drop•Water-only image: fat signal suppressed•Fat-only image: water signal suppressed |
| •As it is formed by the sum of the fat and the water, the in-phase image has more signal |
| •The fat suppression is more robust, with less artefacts |
| •It is less sensitive to B0 and B1 magnetic field inhomogeneities (essentially the 3-, 4- and 6-point Dixon sequences) and therefore has less metallic artefacts |
| •Can be acquired with all types of sequences (gradient echo and spin echo) and in different weightings (T1, T2 and PD) and can be used after administering gadolinium contrast agents |
Diffusion-Weighted Imaging (DWI) sequences have been widely used over the last ten years for the assessment of head and neck lesions.12–14 The ability of these sequences to detect the degree of movement of water molecules in biological tissues, providing anatomical and functional information in a single study, means they are now a first-line tool in the assessment of head and neck studies. DWI studies of the head and neck are able to differentiate between benign and malignant lesions, detect lesions (particularly in the case of metastatic lymphadenopathy),15,16 discriminate between different cell subtypes and even monitor treatment and predict treatment response.17–19
The classic model of DWI analysis considers only the existence of one compartment: the extracellular compartment. The very pathophysiology of neck cancer lesions requires a greater degree of complexity than that provided by these analysis models in order to more accurately characterise such lesions. However, new advanced diffusion analysis models are now being applied which consider the existence of compartments other than simply the extracellular compartment, in order to more precisely explain the process of water diffusion in the tissues.20 These new approaches are the Intravoxel Incoherent Motion (IVIM) model and kurtosis imaging.
IVIM modelThe IVIM model considers the existence of two spaces: the extracellular and the intravascular. To apply the model, multiple b-values below 150mm2/s need to be acquired in order to be able to differentiate between the contribution to the diffusion of the movement of the water molecules inside the capillary network (pseudo-diffusion) and the true diffusion of water molecules in the extracellular compartment (above 150mm2/s).21 With this model, it is possible to assess the true restriction of the diffusion of the lesions (avoiding the effect of pseudo-diffusion of the capillary network, which tends to raise the apparent diffusion coefficient values) through parameter D (true diffusion). With the same acquisition, we can estimate perfusion of the tissues including only the b-values below 150mm2/s by way of the perfusion fraction (f) and the pseudo-diffusion coefficient (D*), without need for intravenous contrast.22,23 In the future, the IVIM model will make it possible to reduce or avoid the use of gadolinium in patients for monitoring known lesions or post-treatment changes, a matter of great relevance given the recent recommendations of the European Medicines Agency in relation to the accumulation of gadolinium in the central nervous system.24
On occasion, the influence of the vascular component on the apparent diffusion coefficient (ADC) of a specific neck lesion can be misleading and result in that lesion being incorrectly classified as benign. Using the IVIM model, the likelihood of false negatives diminishes and we are even able to differentiate with greater precision between different cell subtypes, both in primary tumours and in lymphadenopathy. For example, squamous cell tumours usually have higher D values (mainly due to a greater degree of necrotic/cystic changes in their interior) than lymphomas.22 This distinction has also been applied for the differentiation between parotid lesions such as pleomorphic adenoma and Warthin's tumour (Fig. 3).25,26
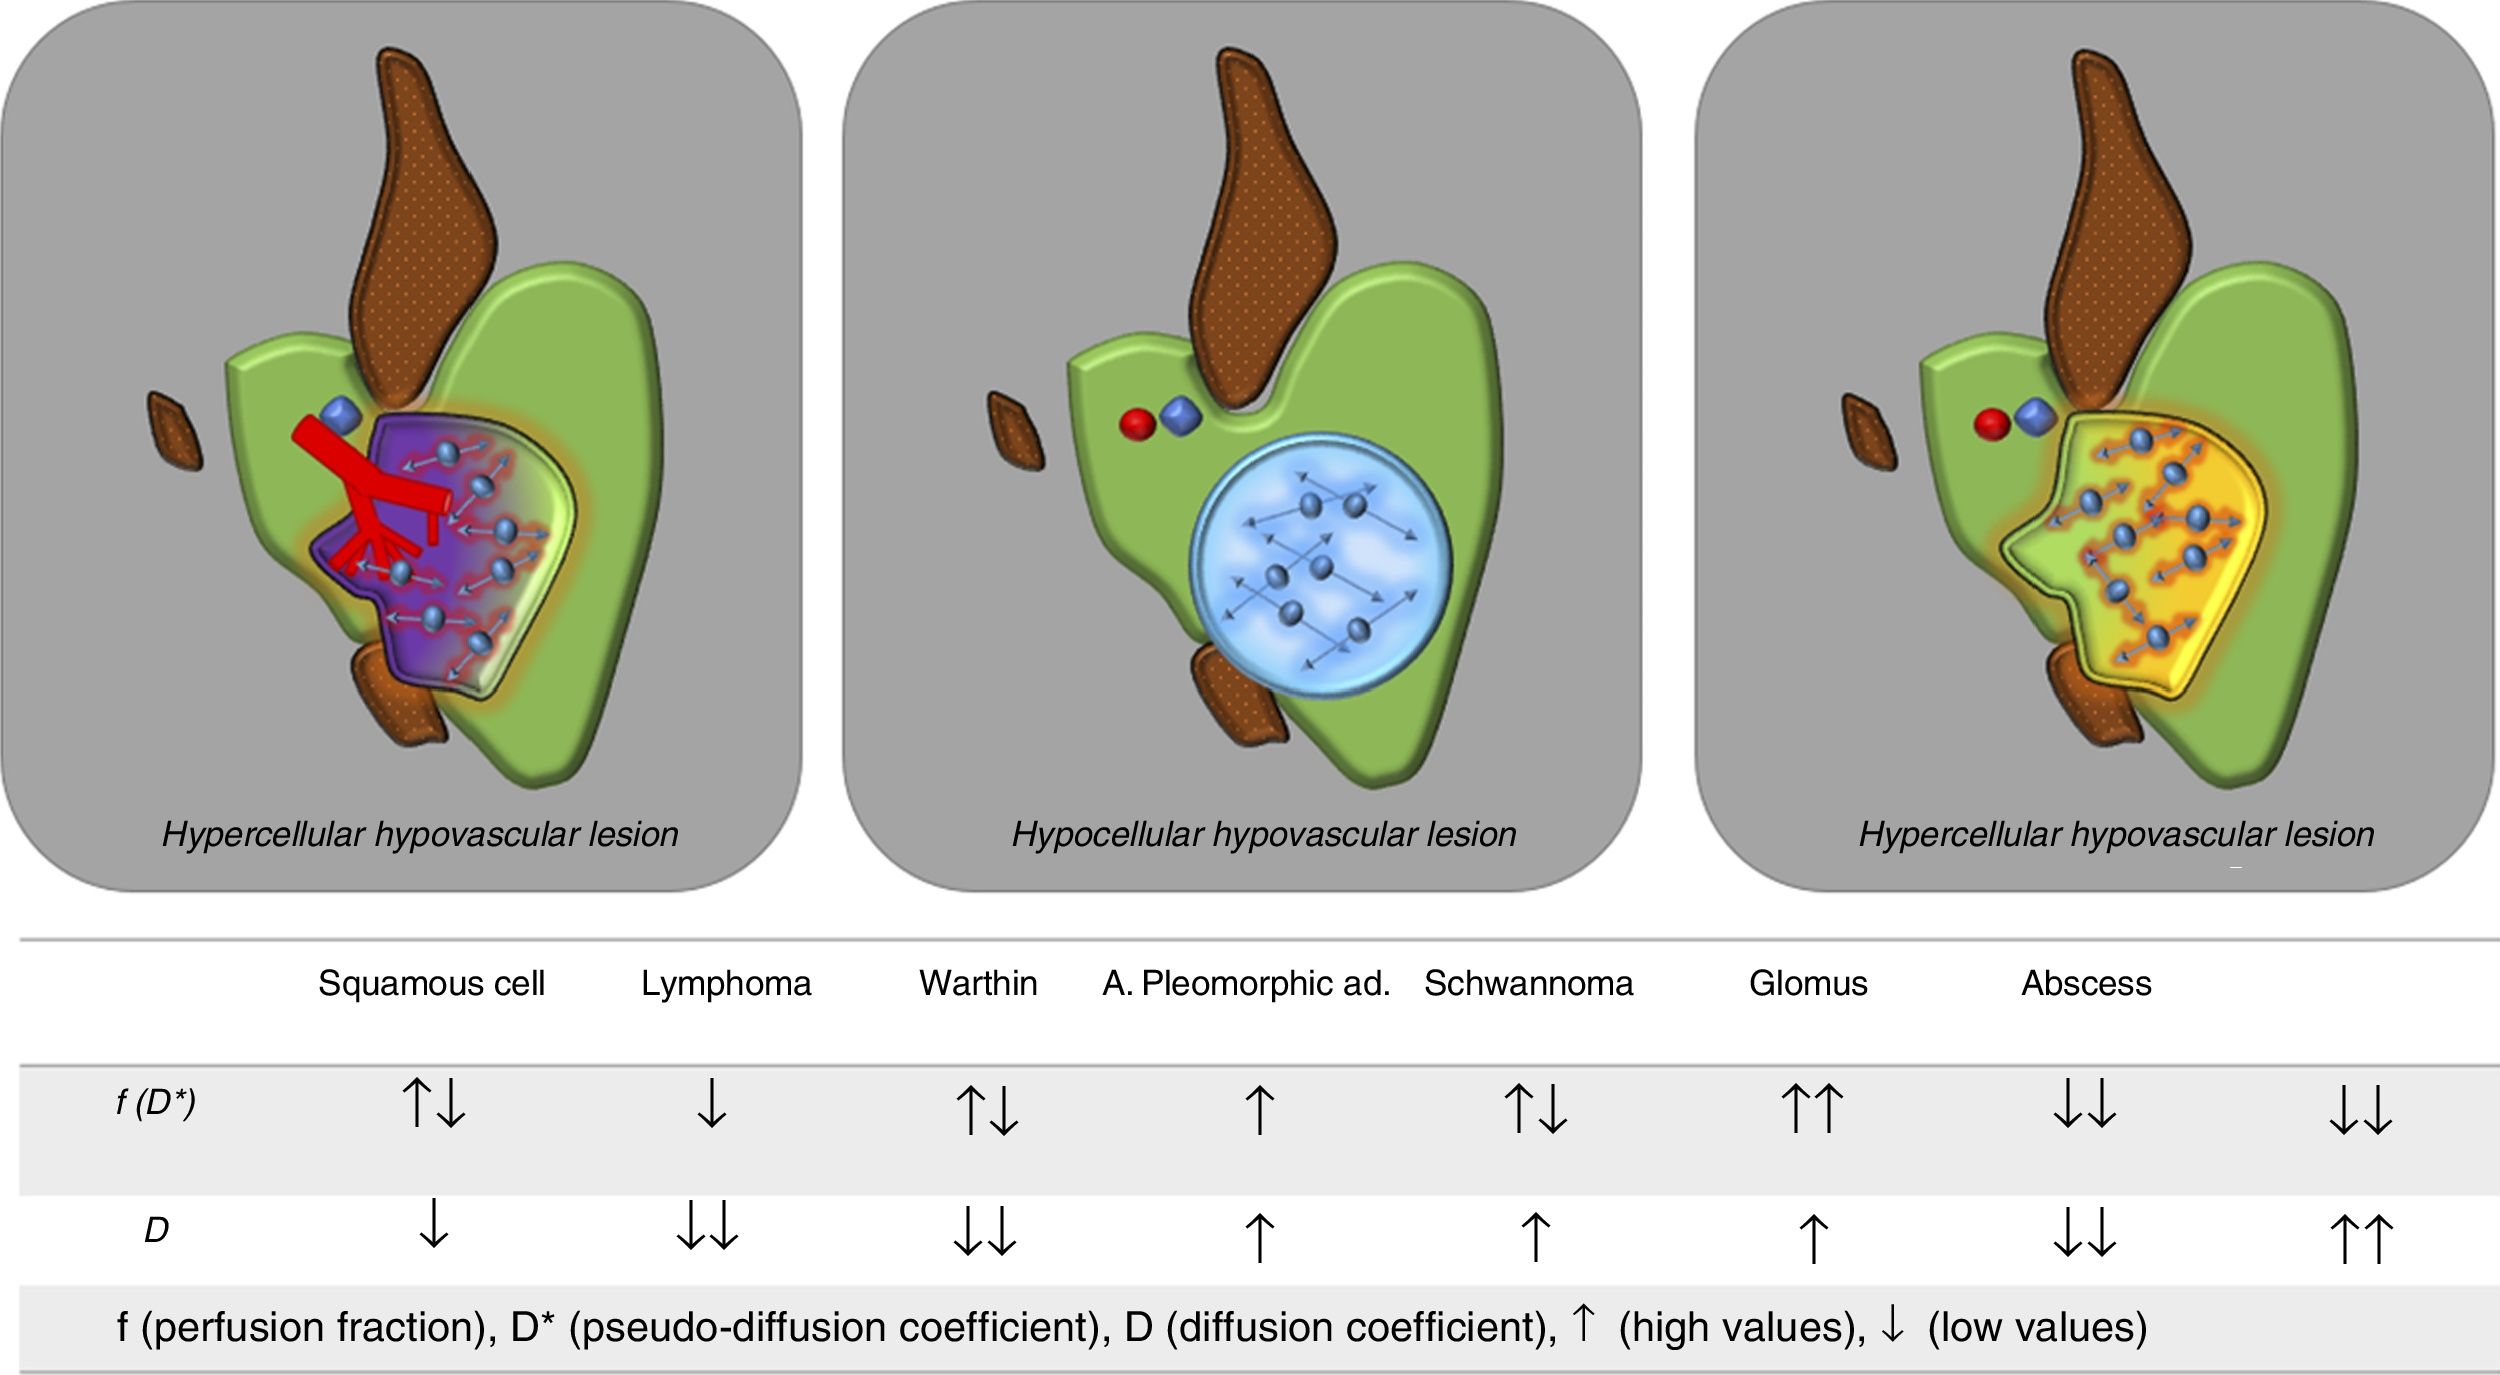
 and high f values. Pure cystic lesions, being hypovascular, will have very low f values and high D values (similar to those of ADC, as there is no associated perfusion component). Solid lesions with poor vascularisation will show low D and f values, as may be the case with lymphomas. The table below shows the expected behaviour of the main types of head and neck lesion according to the IVIM model.")
Utility of the IVIM model for the differential diagnosis of head and neck lesions. The IVIM model allows an adequate assessment of the nature of head and neck lesions without the need to use intravenous contrast. Solid, hypercellular cancer lesions with increased vascularisation will have low D values (lower than their corresponding ADC values) and high f values. Pure cystic lesions, being hypovascular, will have very low f values and high D values (similar to those of ADC, as there is no associated perfusion component). Solid lesions with poor vascularisation will show low D and f values, as may be the case with lymphomas. The table below shows the expected behaviour of the main types of head and neck lesion according to the IVIM model.
The kurtosis-based model considers the existence of a third compartment, one in which water molecules interact with cell membranes (membrane-bound water). It has been shown that this interaction is a non-Gaussian motion process.20 In order to estimate this motion, it is necessary to acquire b-values above 2,000mm2/s, in order to determine the level of interaction of the water molecules with the cell membranes.27
The main parameter derived from the analysis by kurtosis is the mean kurtosis (MK), which has been related to the heterogeneity of the tissues. The more heterogeneous the tissues are, the further their distribution from the normal (Gaussian) will be and the kurtosis values will be higher.27 The added value of this type of analysis lies in the ability to characterise tumour tissues beyond the existence of restriction of diffusion in their interior. It has been shown that, with equal degree of restriction of diffusion in certain lesions, kurtosis makes it possible to discriminate between these lesions according to the degree of heterogeneity.28 More aggressive cancer lesions with higher mitotic index, presence of necrosis, neoangiogenesis, etc., will show higher MK values than less aggressive lesions (Fig. 4).
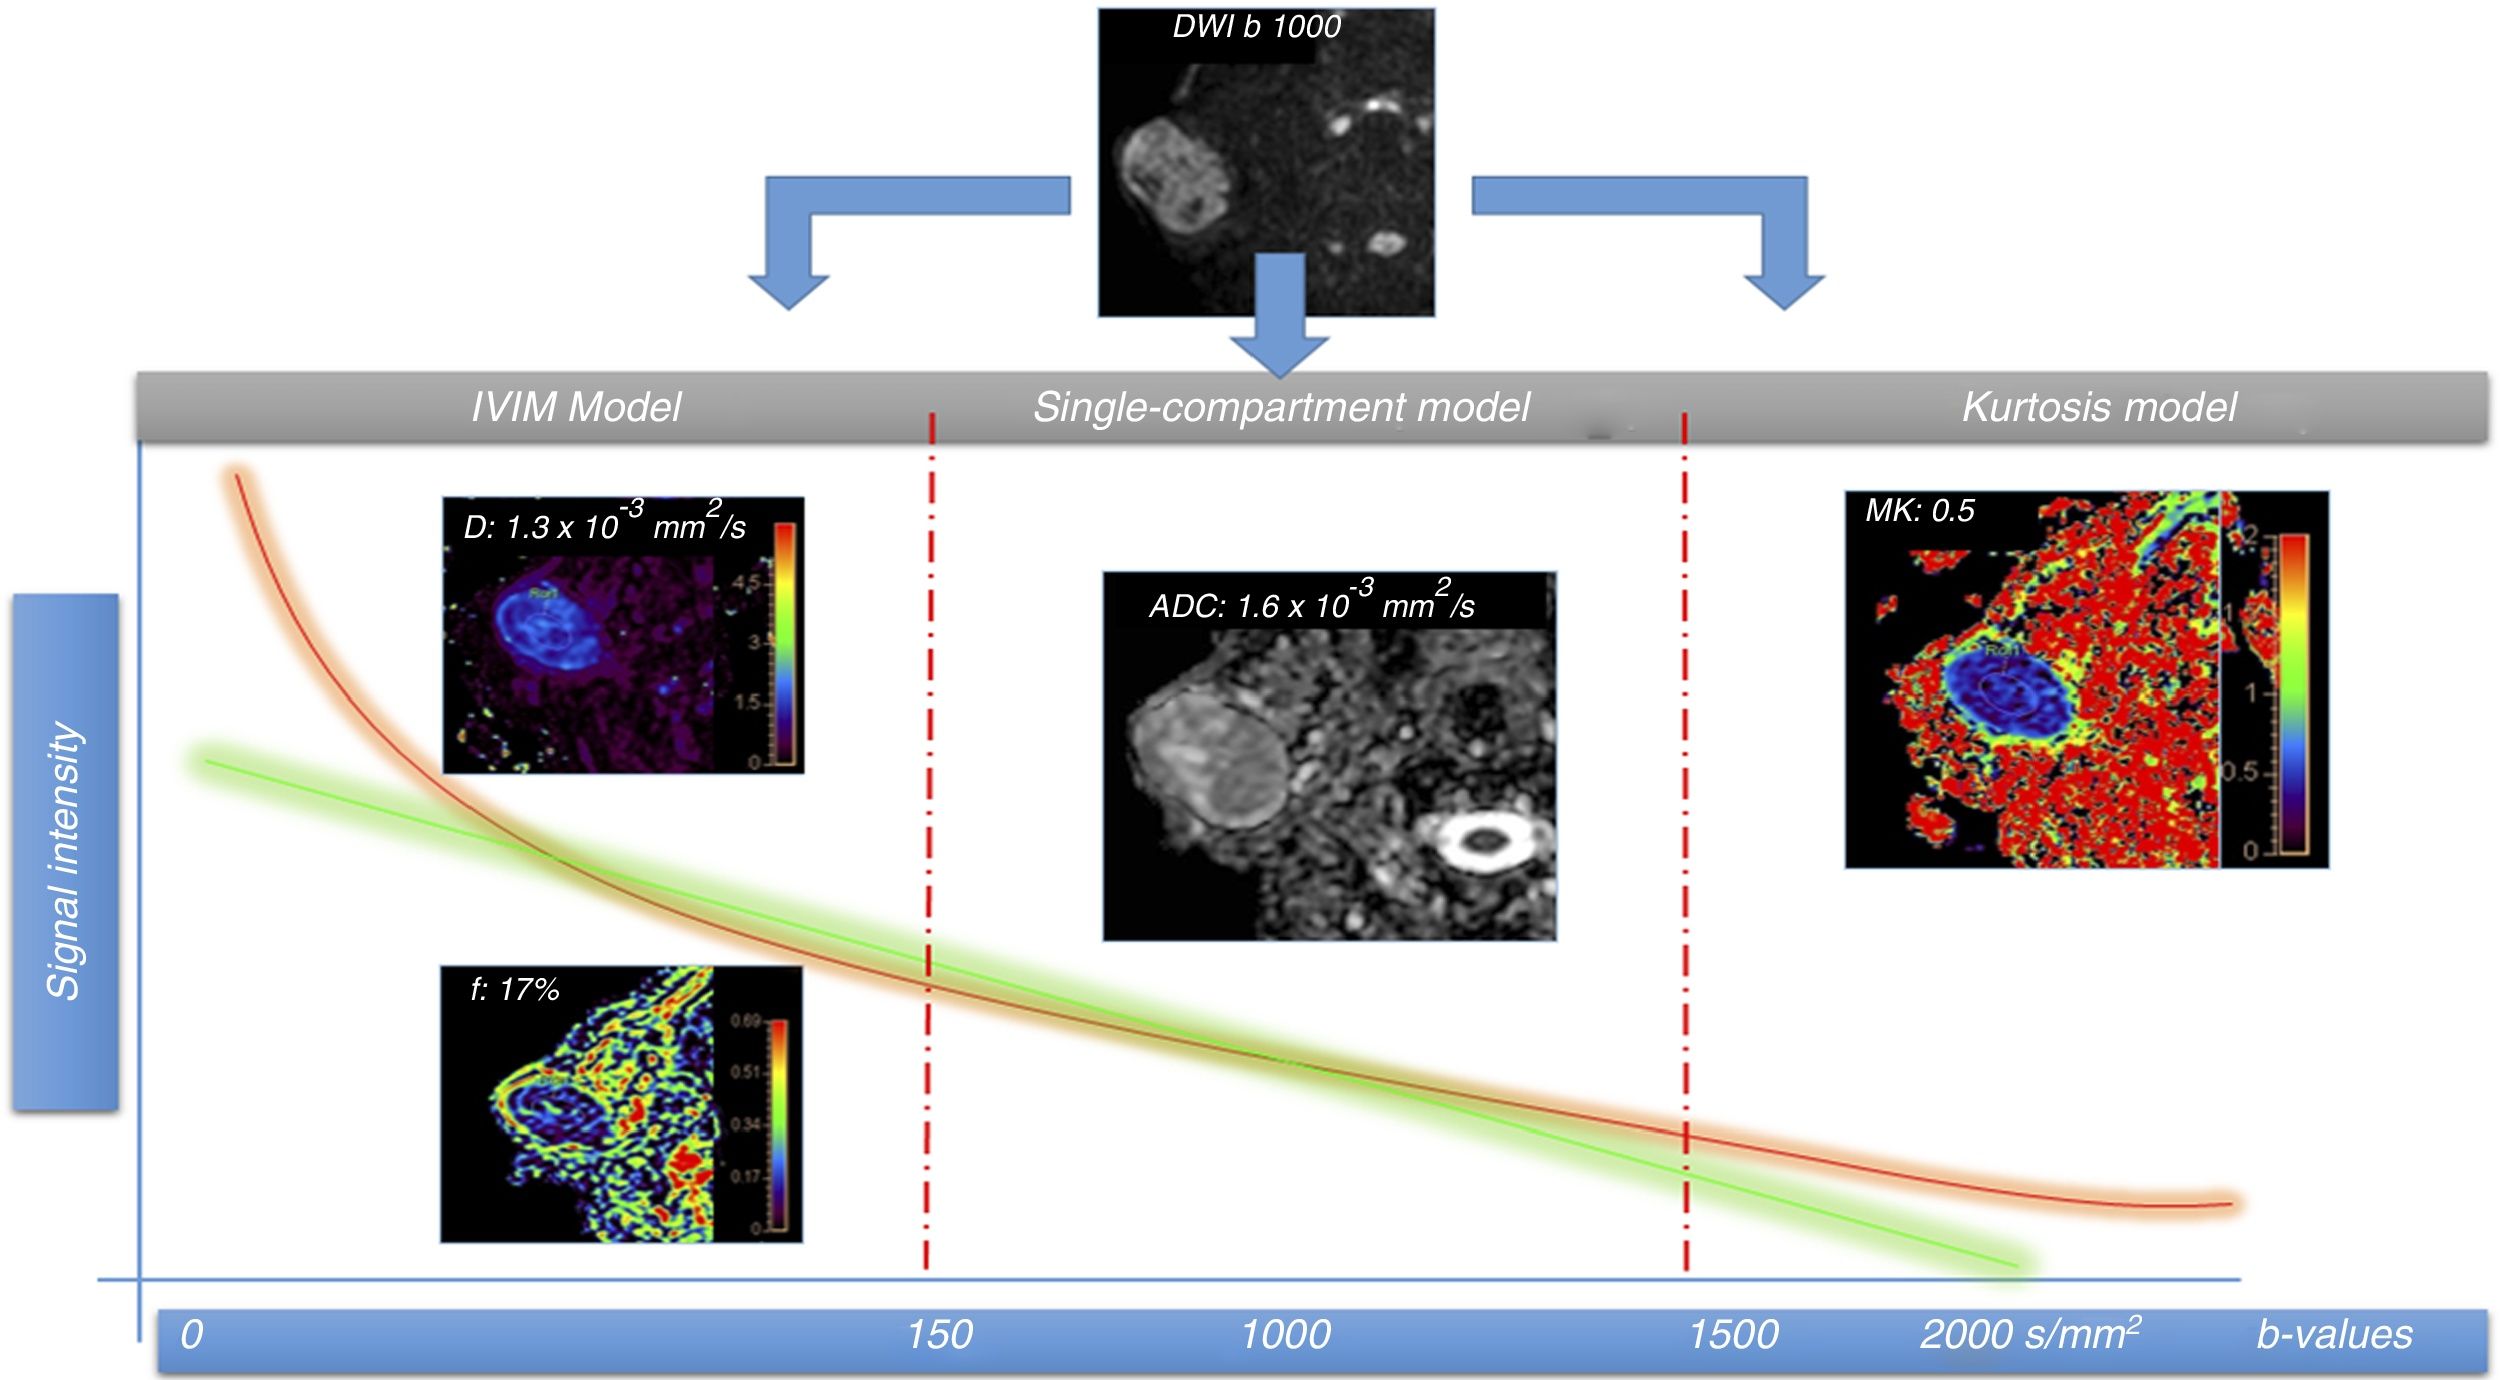
; and the orange, obtained from multiple b-values, which is more adjusted to the biological characteristics of the tissues, especially at both extremes. The first part (left) of the fall of the curve reflects the phase shift of the molecules because of the pseudo-diffusion component (diffusion inside the capillary network), with a rapid fall seen here due to said vascular component, and allows us to calculate the perfusion fraction (f), which in this lesion is 17%, without the need to use intravenous contrast. Pure diffusion (D) can also be calculated by eliminating the contribution of the above pseudo-diffusion component. In the central part of the graph, the single-compartment and multiple-compartment curves have similar slopes. In this part of the curve, the model that best fits is the classic diffusion model based on ADC. In this case, due to the lesion")
A 51-year-old male patient with right parotid mass to be investigated and histological diagnosis of pleomorphic adenoma. A diffusion magnetic resonance imaging study was performed using multiple b-values for IVIM and kurtosis model assessment. There are two types of signal intensity drop curves: the green, which follows the single-compartmental model with signal drop between two points (2 b-values); and the orange, obtained from multiple b-values, which is more adjusted to the biological characteristics of the tissues, especially at both extremes. The first part (left) of the fall of the curve reflects the phase shift of the molecules because of the pseudo-diffusion component (diffusion inside the capillary network), with a rapid fall seen here due to said vascular component, and allows us to calculate the perfusion fraction (f), which in this lesion is 17%, without the need to use intravenous contrast. Pure diffusion (D) can also be calculated by eliminating the contribution of the above pseudo-diffusion component. In the central part of the graph, the single-compartment and multiple-compartment curves have similar slopes. In this part of the curve, the model that best fits is the classic diffusion model based on ADC. In this case, due to the lesion's pseudo-diffusion component, the ADC values are higher (1.6×10⁻³mm2/s) than those of pure diffusion (D) (1.3×10⁻³mm2/s). The IVIM model is therefore a better fit to the actual diffusion of the lesions. In the right part of the curve, the model based on the estimation of kurtosis is the most appropriate, as it allows the interaction of water molecules with cell membranes to be assessed using high b-values (usually above 1,500–2,000mm2/s). In this case, as it is a benign lesion, MK values are not very high (0.5), i.e. they do not stray too far from a normal distribution, which reflects the low heterogeneity of the lesion in this case.
Another potential use of these models lies in their ability to predict the treatment response for lesions which are to undergo chemo/radiotherapy. Recent studies have shown that tumours with lower D values will respond better to chemo/radiotherapy than those with higher baseline D values.29,30 This is because, due to the existence of a smaller extracellular space, the distribution of chemotherapy will be more efficient on malignant cells than in tumours with high D values in which necrosis predominates. Similarly, tumours with higher f or D* values, which are associated with greater neoangiogenesis, will also respond better to chemo and radiotherapy thanks to better distribution of the chemotherapy and a higher degree of tissue oxygenation, which makes the tissues more radiosensitive (Fig. 5).30
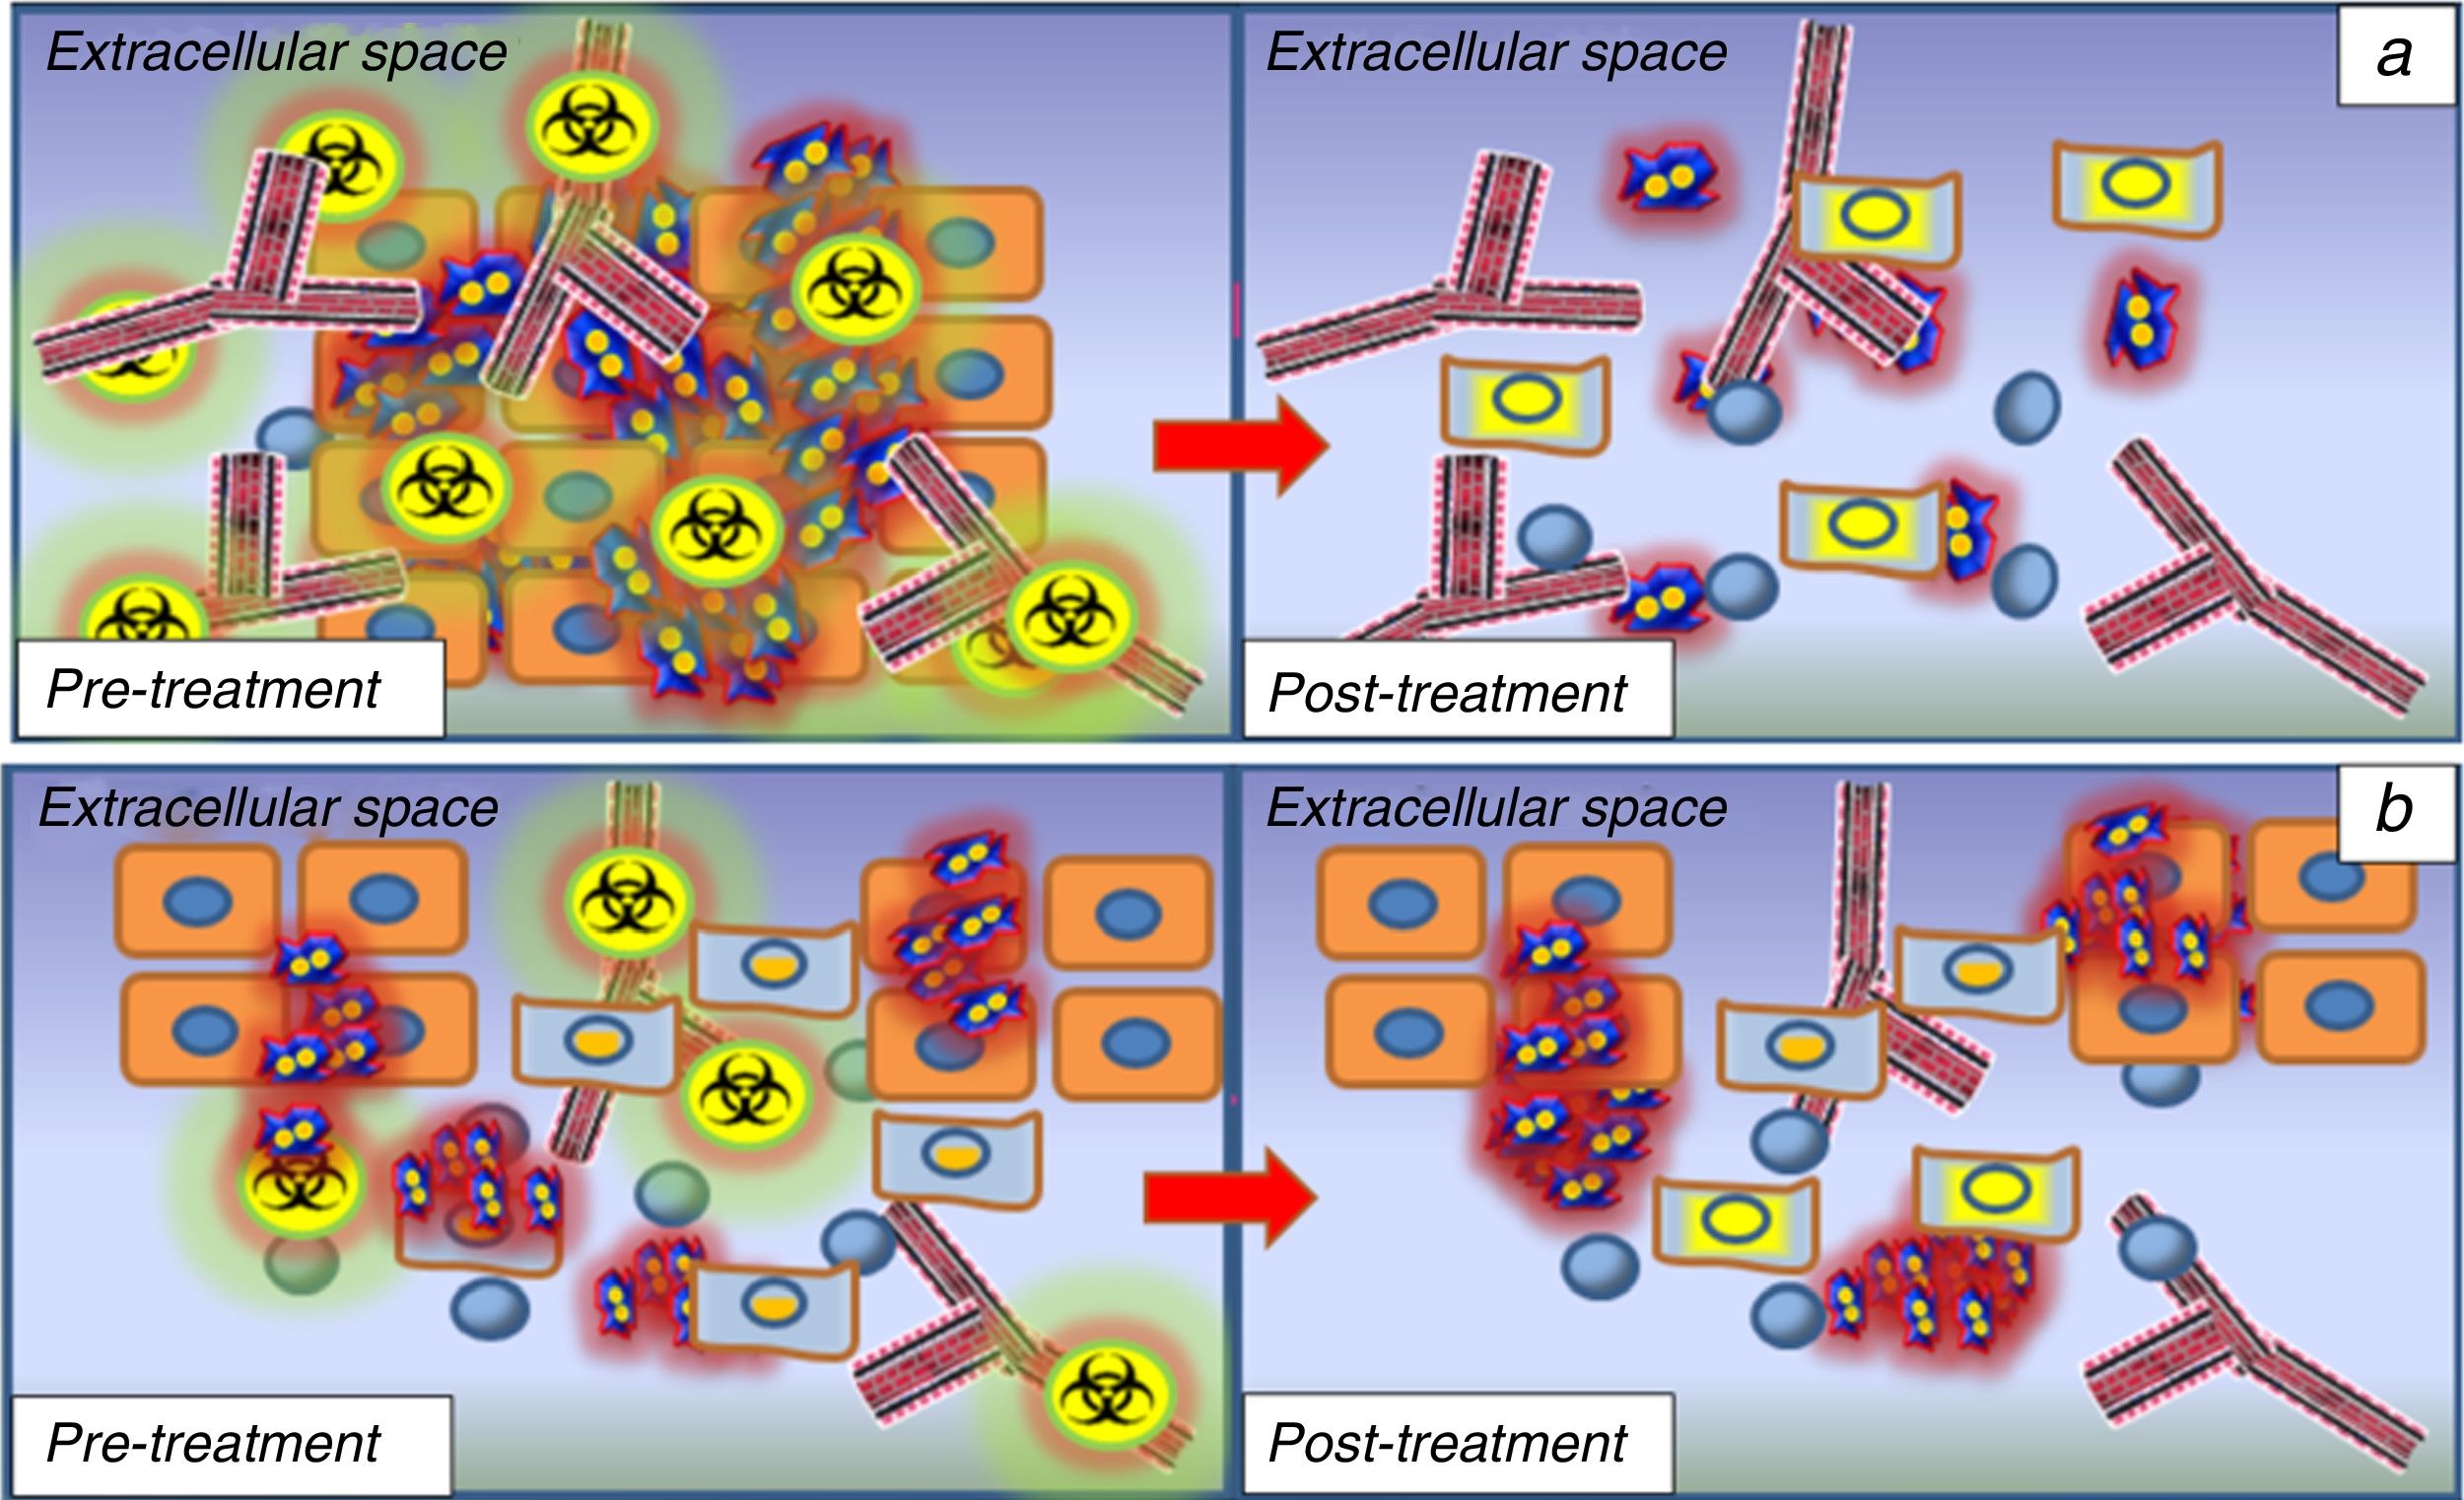
 hypercellular lesions usually associated with a greater degree of neoangiogenesis due to the expression of endothelial growth factors to maintain the oxygen and nutrient supply required by cell proliferation. These lesions will therefore show low D values and high f values according to the IVIM model. This type of lesion will have a better response to chemotherapy treatment, as the cytotoxic agent will be distributed more efficiently in the tumour bed thanks to the associated angiogenesis. These lesions will also be more sensitive to radiotherapy because they are better oxygenated. After the first cycles of chemo/radiotherapy, these lesions will undergo changes, with progressive increase in D values due to the increased extracellular space caused by necrosis/cell death; this provides a way to monitor treatment response at an early stage. (1b) the lesions that show high D values and low f values before the start of treatment will respond worse to chemo and radiotherapy because of necrotic hypovascular areas in their interior resulting in the action of these therapeutic agents having little effect, and the response prediction will therefore be poor. Similarly, the absence of a significant increase in the D values in the monitoring phase after the first treatment cycles will be indicative of a poor response to treatment, so a change in treatment line should be considered.")
Prediction and monitoring of response to treatment in head and neck tumours. (1a) hypercellular lesions usually associated with a greater degree of neoangiogenesis due to the expression of endothelial growth factors to maintain the oxygen and nutrient supply required by cell proliferation. These lesions will therefore show low D values and high f values according to the IVIM model. This type of lesion will have a better response to chemotherapy treatment, as the cytotoxic agent will be distributed more efficiently in the tumour bed thanks to the associated angiogenesis. These lesions will also be more sensitive to radiotherapy because they are better oxygenated. After the first cycles of chemo/radiotherapy, these lesions will undergo changes, with progressive increase in D values due to the increased extracellular space caused by necrosis/cell death; this provides a way to monitor treatment response at an early stage. (1b) the lesions that show high D values and low f values before the start of treatment will respond worse to chemo and radiotherapy because of necrotic hypovascular areas in their interior resulting in the action of these therapeutic agents having little effect, and the response prediction will therefore be poor. Similarly, the absence of a significant increase in the D values in the monitoring phase after the first treatment cycles will be indicative of a poor response to treatment, so a change in treatment line should be considered.
These advanced models are also making it possible to monitor treatment response at an early stage, based on the variation in values such as D or MK and their histograms after the treatment is introduced.31 Lesions that show an increase in the D values (with displacement to the right of the histogram curve) after the first cycles of chemotherapy will be considered as treatment responders, as opposed to lesions that show no significant variation in D values.32 These changes in diffusion parameters take place before morphological changes, which means added value as an early marker of therapeutic response (Fig. 6).33
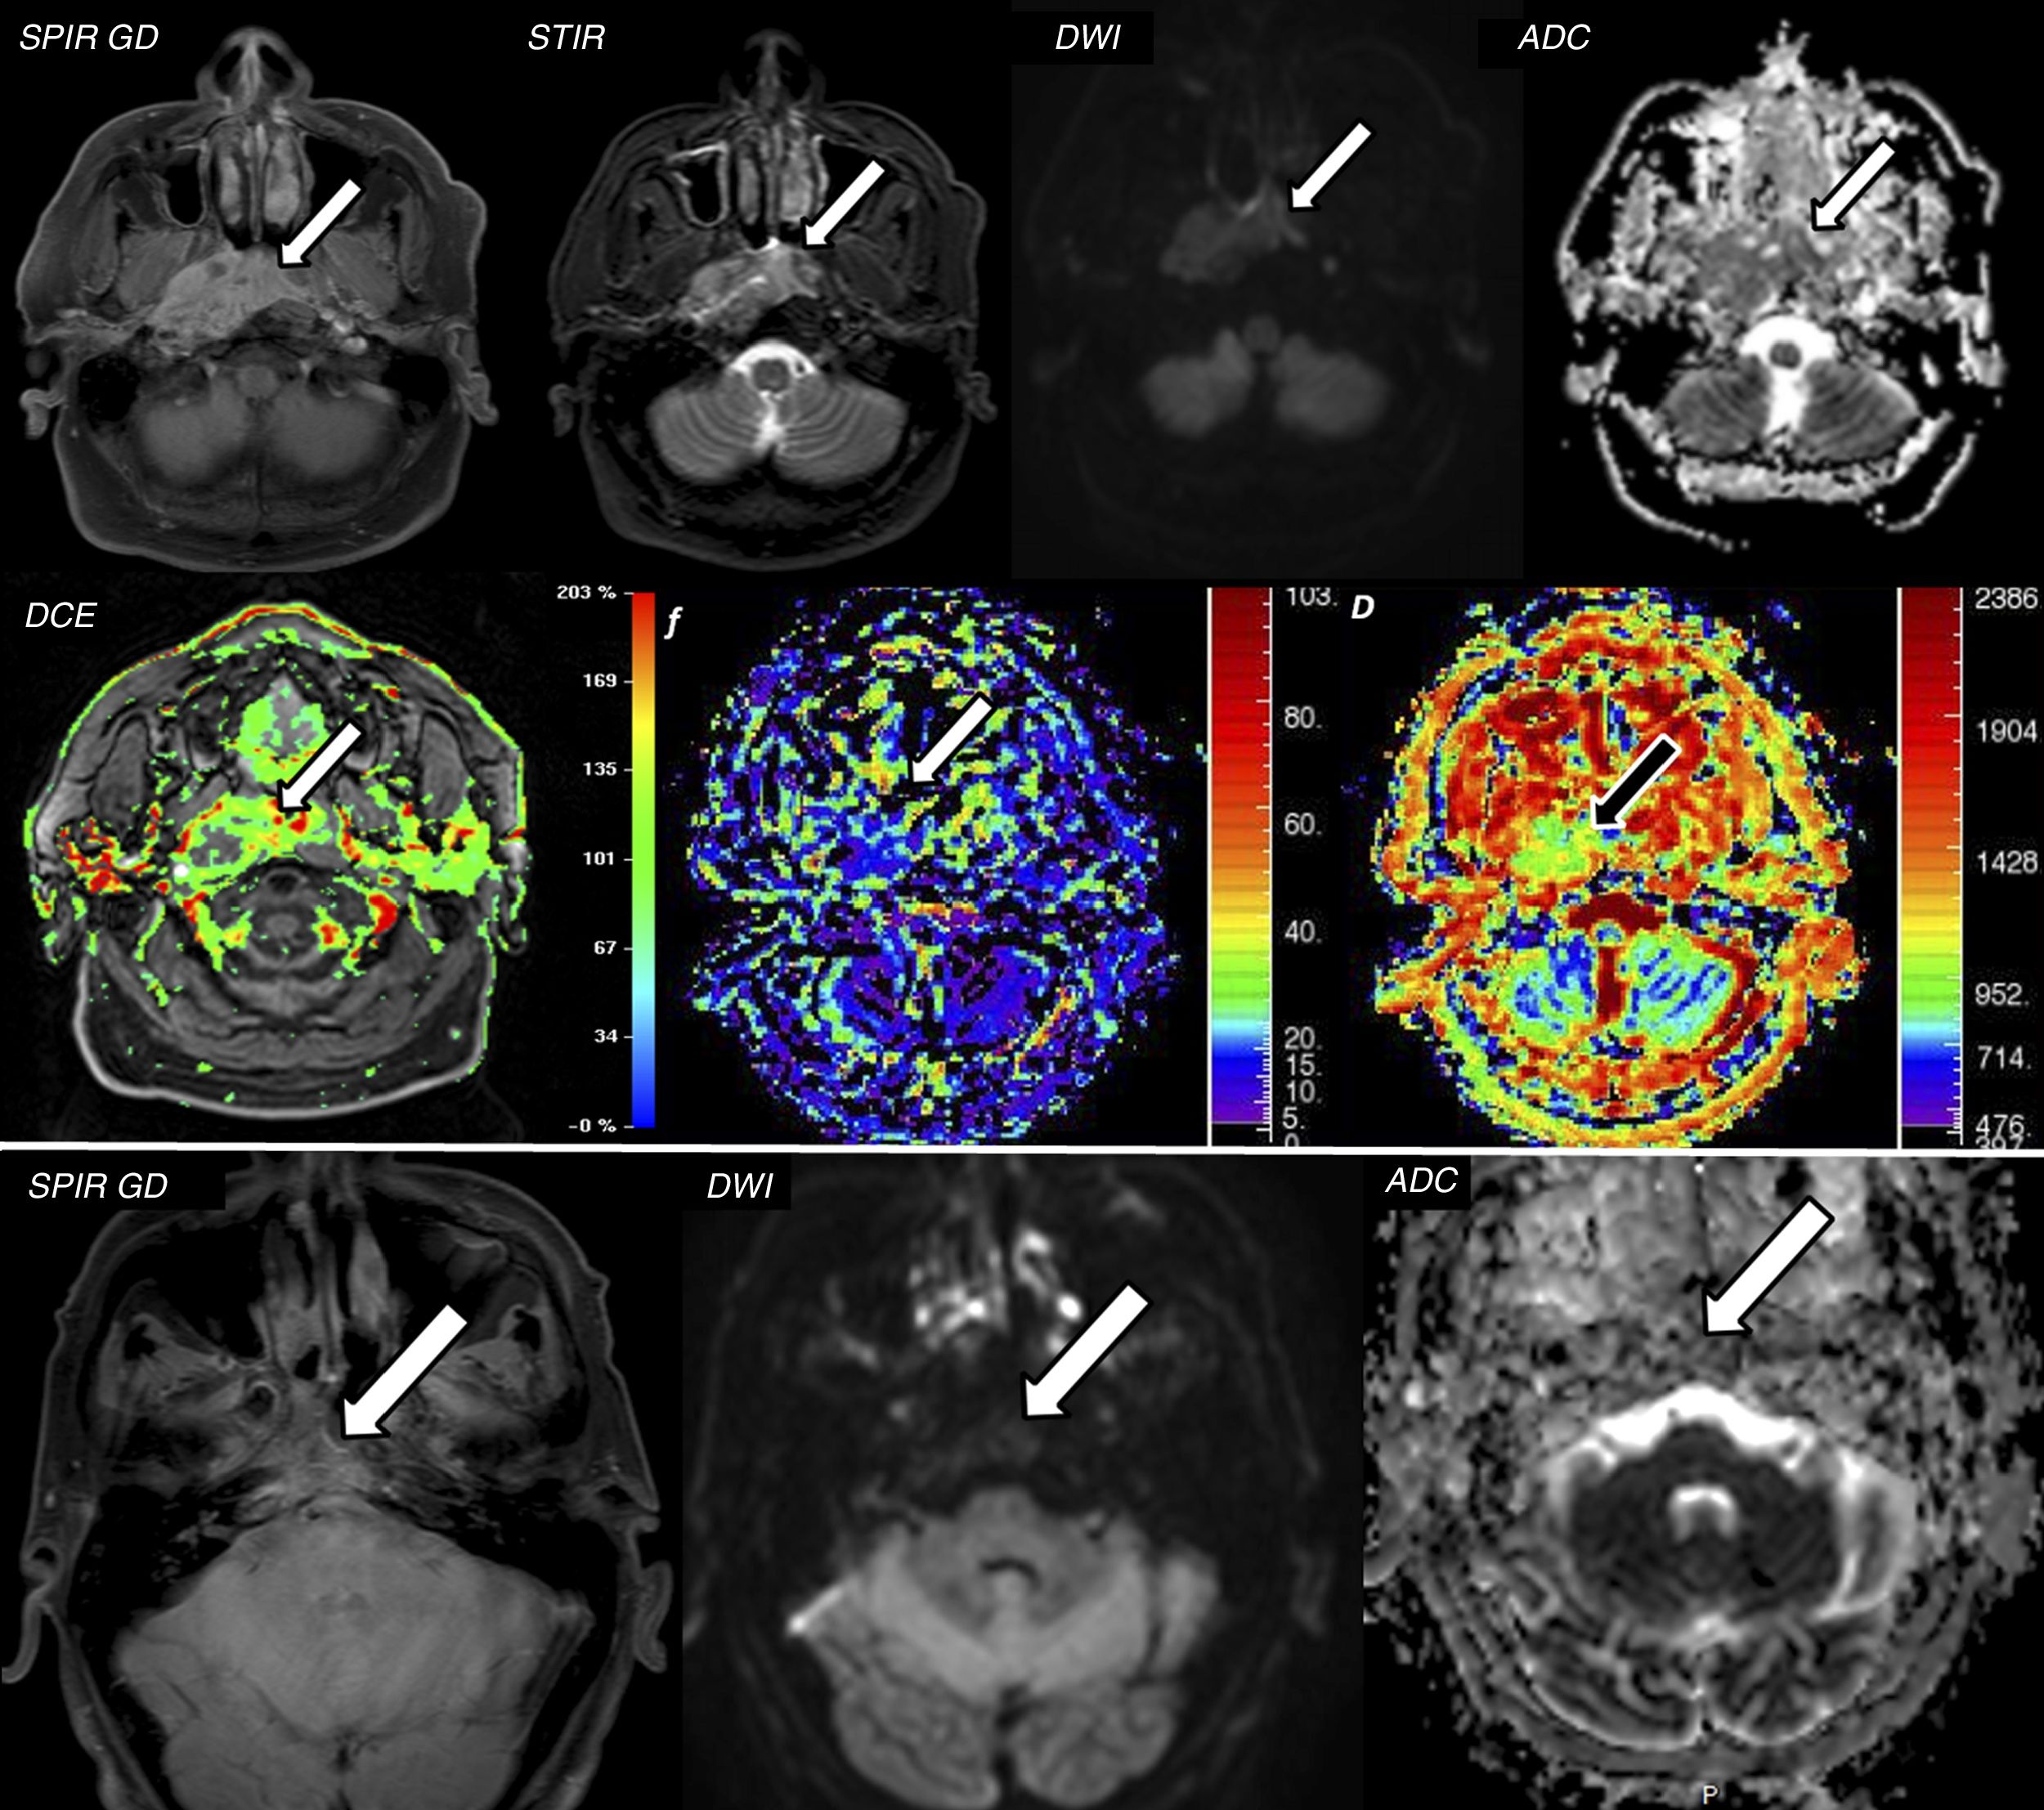
 Magnetic resonance imaging (MRI) shows an infiltrative mass in the nasopharyngeal cavum with intense enhancement after administration of contrast in axial T1 SPIR with contrast and STIR images (arrows). This lesion has marked restriction of diffusion with ADC values of 1.1×10⁻³mm2/s, compatible with squamous cell carcinoma of the nasopharyngeal cavum (confirmed with biopsy). The lesion was analysed according to the IVIM model, which showed high f values (up to 30%, with adequate correlation with the DCE perfusion study) and D values of 0.8×10⁻³mm2/s, lower than the ADC, due to the elimination of the associated perfusion component (pseudo-diffusion). These findings suggested an adequate treatment response prediction. (B) Two months after the start of chemotherapy/radiotherapy, a repeat MRI was performed, which confirmed a very significant response to treatment with marked reduction of the tumour mass and the uptake component in the T1 SPIR axial image with contrast (arrow) and a lower restriction of diffusion with ADC values of 1.9×10⁻³mm2/s.")
A 56-year-old male attending for assessment of nasopharyngeal discomfort. (A) Magnetic resonance imaging (MRI) shows an infiltrative mass in the nasopharyngeal cavum with intense enhancement after administration of contrast in axial T1 SPIR with contrast and STIR images (arrows). This lesion has marked restriction of diffusion with ADC values of 1.1×10⁻³mm2/s, compatible with squamous cell carcinoma of the nasopharyngeal cavum (confirmed with biopsy). The lesion was analysed according to the IVIM model, which showed high f values (up to 30%, with adequate correlation with the DCE perfusion study) and D values of 0.8×10⁻³mm2/s, lower than the ADC, due to the elimination of the associated perfusion component (pseudo-diffusion). These findings suggested an adequate treatment response prediction. (B) Two months after the start of chemotherapy/radiotherapy, a repeat MRI was performed, which confirmed a very significant response to treatment with marked reduction of the tumour mass and the uptake component in the T1 SPIR axial image with contrast (arrow) and a lower restriction of diffusion with ADC values of 1.9×10⁻³mm2/s.
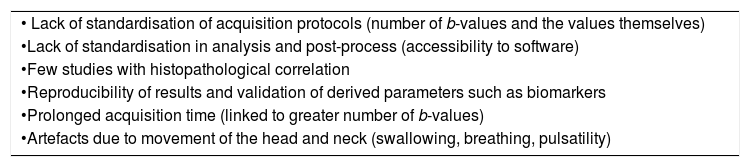
The use of these models for advanced diffusion analysis is not without some drawbacks. In order to apply the models, it is necessary to acquire multiple b-values and this means a longer examination time, with the consequent motion artefacts inherent to the head and neck (respiratory, swallowing and pulsatility). The lack of standardisation, both in the acquisition phase (number of b-values acquired and the values themselves) and post-processing, for which specific software is not always available or validated for clinical use, is another great challenge for implementation in daily radiological practice. More studies with histopathological correlation are necessary for optimal validation of these analysis models. Table 2 summarises the main drawbacks in the acquisition and analysis of the above advanced models in the head and neck.
Limitations of the diffusion technique in head and neck studies.
| • Lack of standardisation of acquisition protocols (number of b-values and the values themselves) |
| •Lack of standardisation in analysis and post-process (accessibility to software) |
| •Few studies with histopathological correlation |
| •Reproducibility of results and validation of derived parameters such as biomarkers |
| •Prolonged acquisition time (linked to greater number of b-values) |
| •Artefacts due to movement of the head and neck (swallowing, breathing, pulsatility) |
The physiological definition of perfusion refers to the steady state of nutrient and oxygen release via blood per unit of volume and mass (ml of blood/100g of tissue/min).34 The estimation of perfusion with MRI is based on performing multiple acquisitions of high temporal resolution before, during and after the administration of a bolus of contrast.35
Types of perfusionThere are two main types of perfusion, classified according to the contrast medium used: exogenous or endogenous. Perfusion using an exogenous contrast medium consists of administering a gadolinium-based contrast medium and analysing the susceptibility effects or relaxation time of the signal in the tissues after administration: perfusion with susceptibility to contrast (dynamic susceptibility contrast [DSC], using echo-planar sequences enhanced in T2*); and dynamic perfusion with contrast (dynamic contrast-enhanced [DCE], using gradient echo sequences enhanced in T1), respectively. The endogenous perfusion method uses magnetically-labelled arterial blood water as a tracer (arterial spin labelling [ASL]).36
DCE and to a much lesser extent ASL are the perfusion techniques used to assess head and neck tumours.
DCE usually uses 3D T1-weighted gradient echo sequences. To perform the calculations, you have to have the baseline T1 values using different flip angles (usually 2° and 15°, although it depends on the vendors, the so-called T1 mapping). With the passage of the contrast bolus, an increase in the tissue signal is detected when the contrast reaches the extravascular space. This perfusion should not be confused with “dynamic multi-phase” studies with more spatial than temporal resolution and which have only 6–9 phases in 5–7min.35
The intensity-time curves obtained in DCE perfusion can be analysed by applying two methods: semiquantitative and quantitative.
The semiquantitative method classifies the morphology of the signal-intensity curve according to its initial enhancement (first 120s) in rapid, medium or slow enhancement, and post-initial or late enhancement beyond 120s as persistent, plateau or washout.
The quantitative method is based on the microangioarchitecture of the tumour (endothelial permeability and distribution in the extravascular-extracellular and intravascular spaces). The Tofts’ “two-compartment” pharmacokinetic model is usually applied, based on the “permeability” of the capillaries and how they diffuse the gadolinium molecules. The Ktrans parameters are obtained (intravascular to extravascular-extracellular compartment transfer rate); Kep, transfer rate from the extravascular-extracellular space to the vessels (conceptually the inverse to the Ktrans); Vp, or plasma volume within the voxel; and Ve or extravascular-extracellular volume in the voxel volume.37 To adequately estimate perfusion, it is necessary to obtain the arterial input function (AIF), which can be obtained from a region of interest (ROI) in a pertinent artery and serves to check the wash-in and wash-out, and assess the quality of the perfusion study (Fig. 7).38
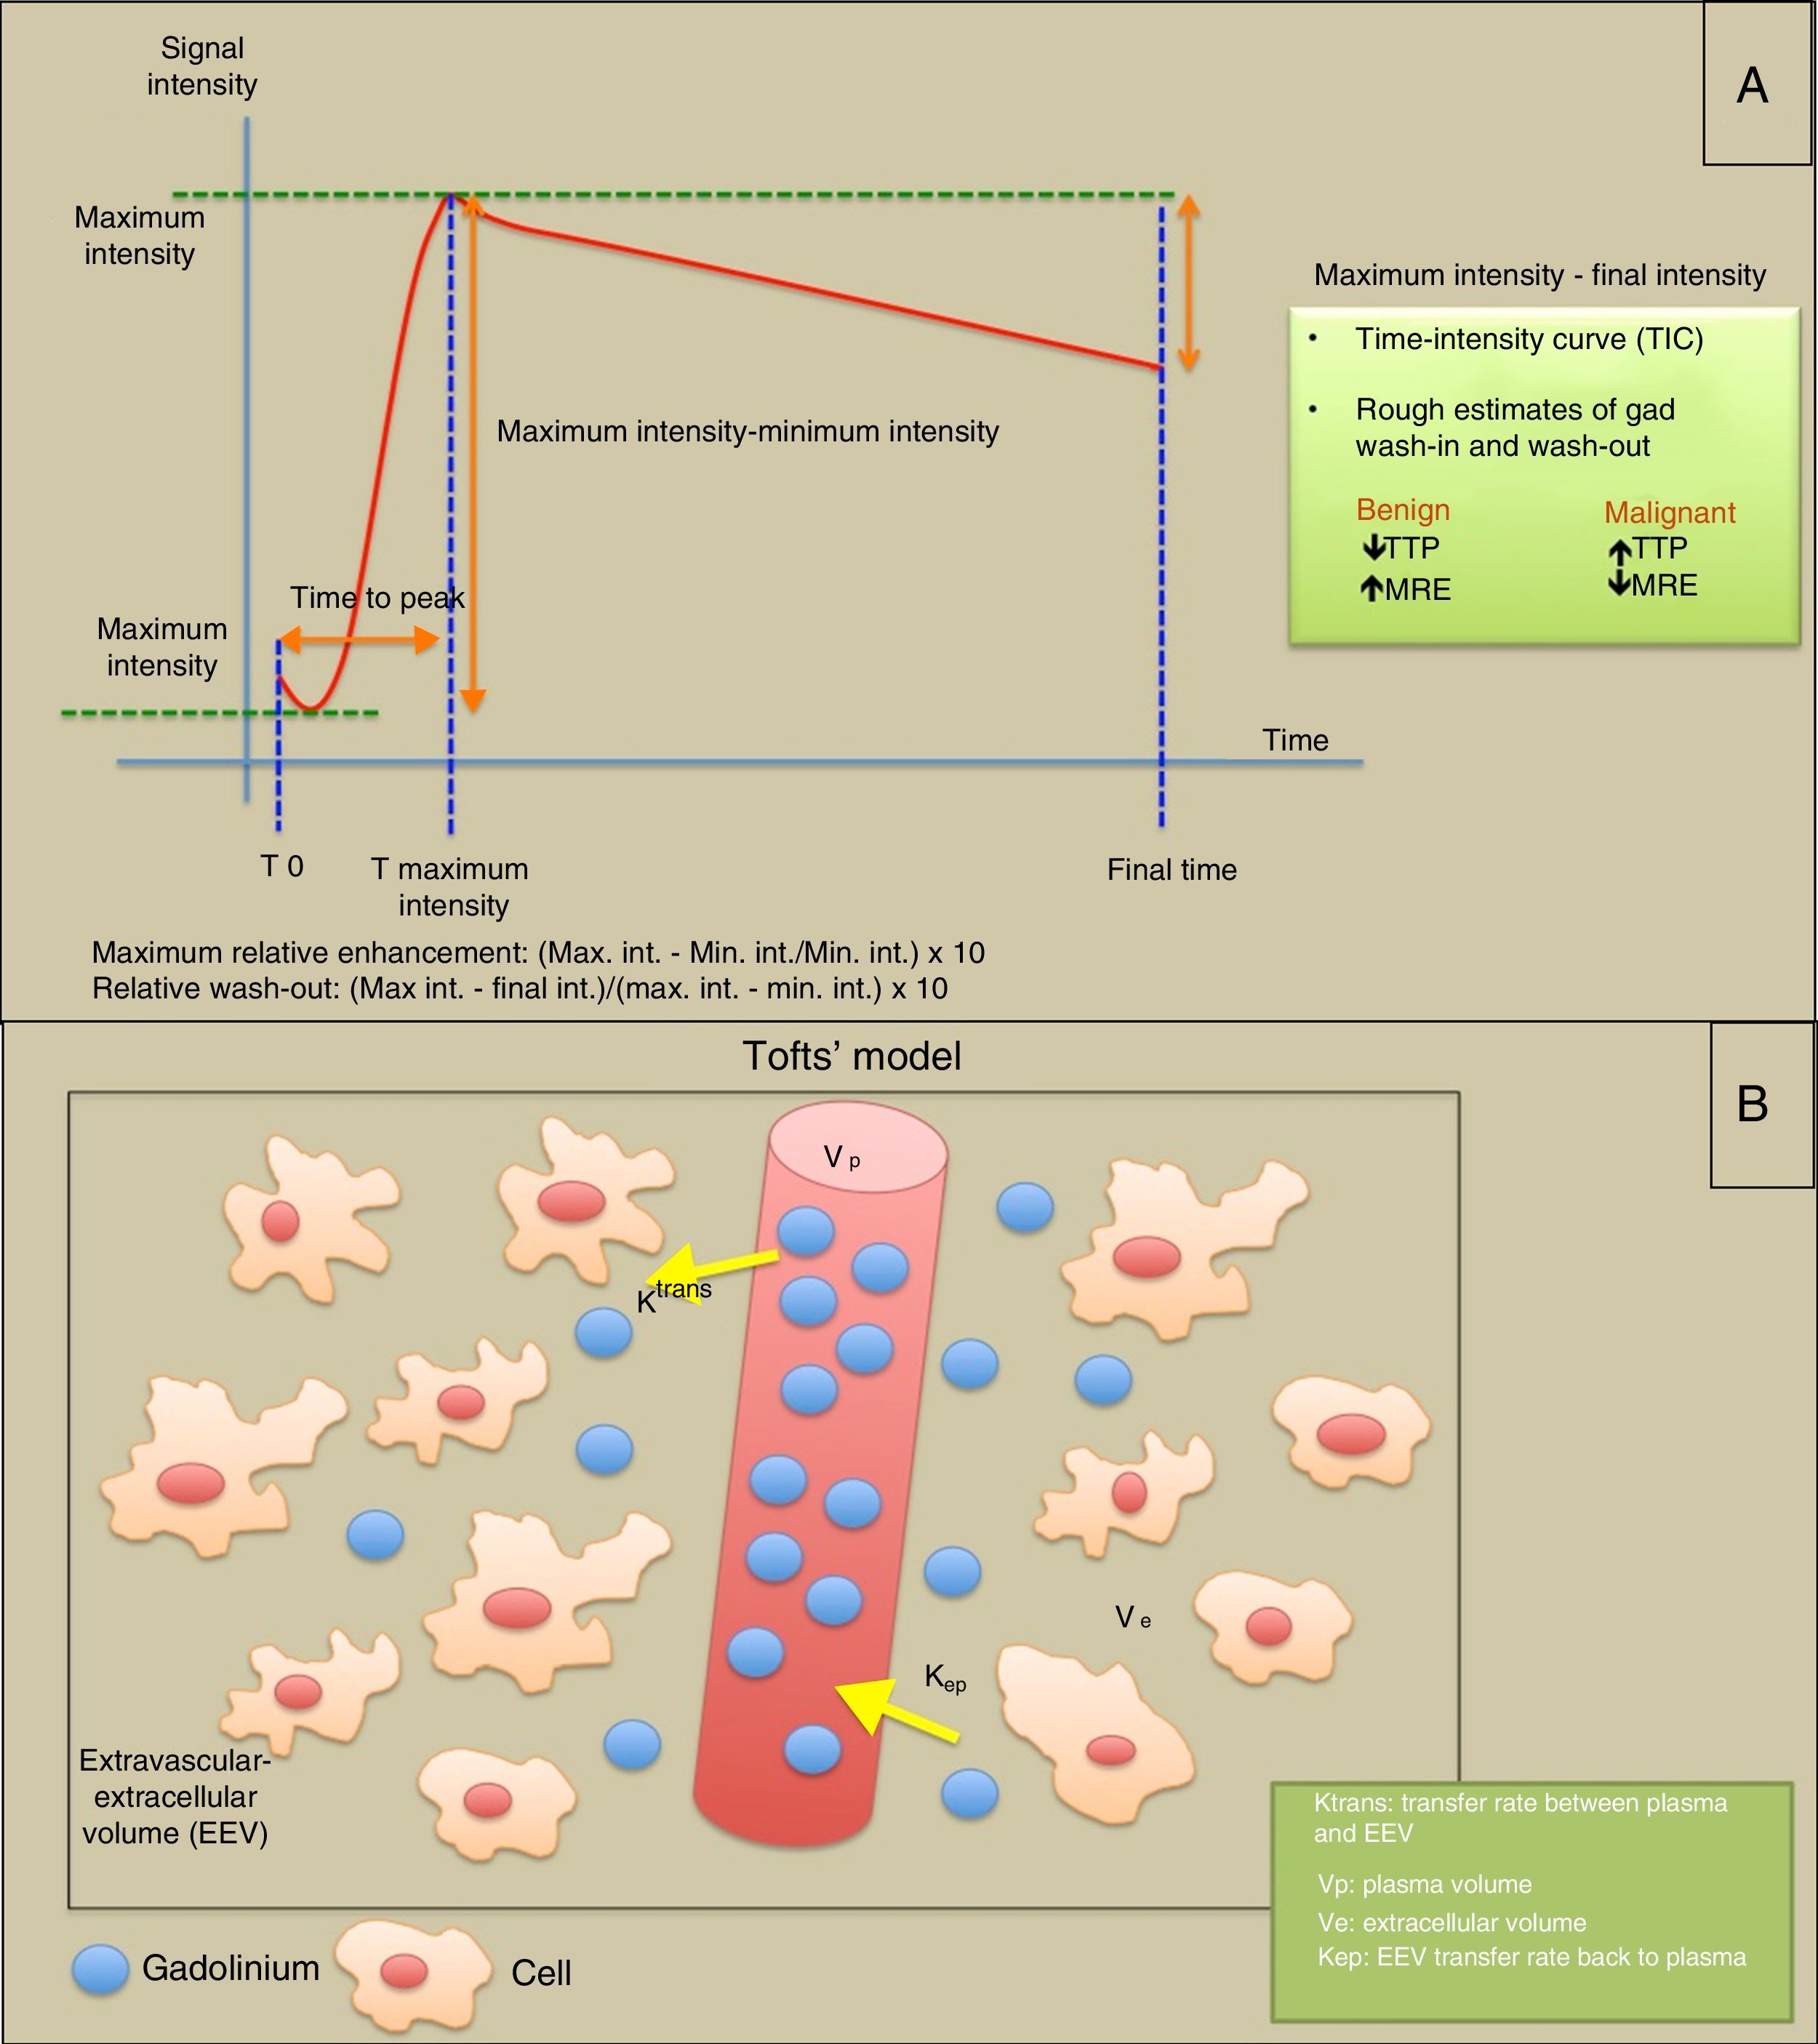
 Semiquantitative analysis in which analysis of intensity-time curves provides information on parameters such as time to peak (TTP), maximum relative enhancement (MRE) and relative washout. The area under the curve (AUC) is the area below the dynamic gadolinium-intensity curve. (B) Diagram illustrating Tofts’ “two-compartment” model for quantitative assessment of permeability, where an intravascular compartment and an extravascular-extracellular compartment are considered. Depending on the “permeability” of the capillaries and the microvasculature, the gadolinium molecules diffuse into the extravascular-extracellular space at a particular transfer rate (Ktrans). If the study is extended long enough (5min), parameters such as Kep (conceptually inverse to Ktrans) or the rate of return of some gadolinium molecules to the intravascular compartment can be estimated.")
T1-weighted DCE perfusion models: (A) Semiquantitative analysis in which analysis of intensity-time curves provides information on parameters such as time to peak (TTP), maximum relative enhancement (MRE) and relative washout. The area under the curve (AUC) is the area below the dynamic gadolinium-intensity curve. (B) Diagram illustrating Tofts’ “two-compartment” model for quantitative assessment of permeability, where an intravascular compartment and an extravascular-extracellular compartment are considered. Depending on the “permeability” of the capillaries and the microvasculature, the gadolinium molecules diffuse into the extravascular-extracellular space at a particular transfer rate (Ktrans). If the study is extended long enough (5min), parameters such as Kep (conceptually inverse to Ktrans) or the rate of return of some gadolinium molecules to the intravascular compartment can be estimated.
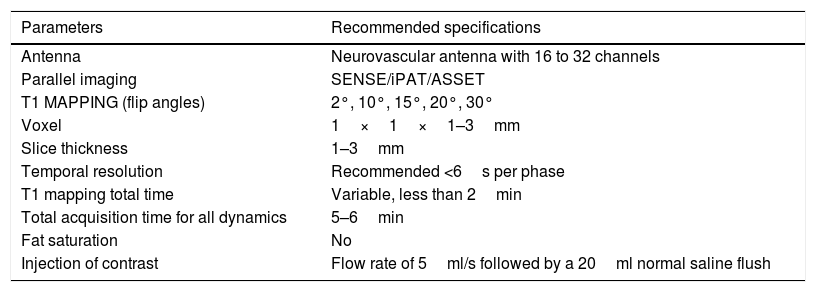
Table 3 shows a summary of the different parameters needed to obtain a T1 perfusion study and apply the two-compartment model to obtain the permeability parameters.
Summary of the different parameters needed to obtain a T1 perfusion study and apply the two-compartment model to obtain the permeability parameters.
| Parameters | Recommended specifications |
|---|---|
| Antenna | Neurovascular antenna with 16 to 32 channels |
| Parallel imaging | SENSE/iPAT/ASSET |
| T1 MAPPING (flip angles) | 2°, 10°, 15°, 20°, 30° |
| Voxel | 1×1×1–3mm |
| Slice thickness | 1–3mm |
| Temporal resolution | Recommended <6s per phase |
| T1 mapping total time | Variable, less than 2min |
| Total acquisition time for all dynamics | 5–6min |
| Fat saturation | No |
| Injection of contrast | Flow rate of 5ml/s followed by a 20ml normal saline flush |
Many authors have evaluated the potential utility of DCE perfusion for the differentiation between benign and malignant pathology in the head and neck region.
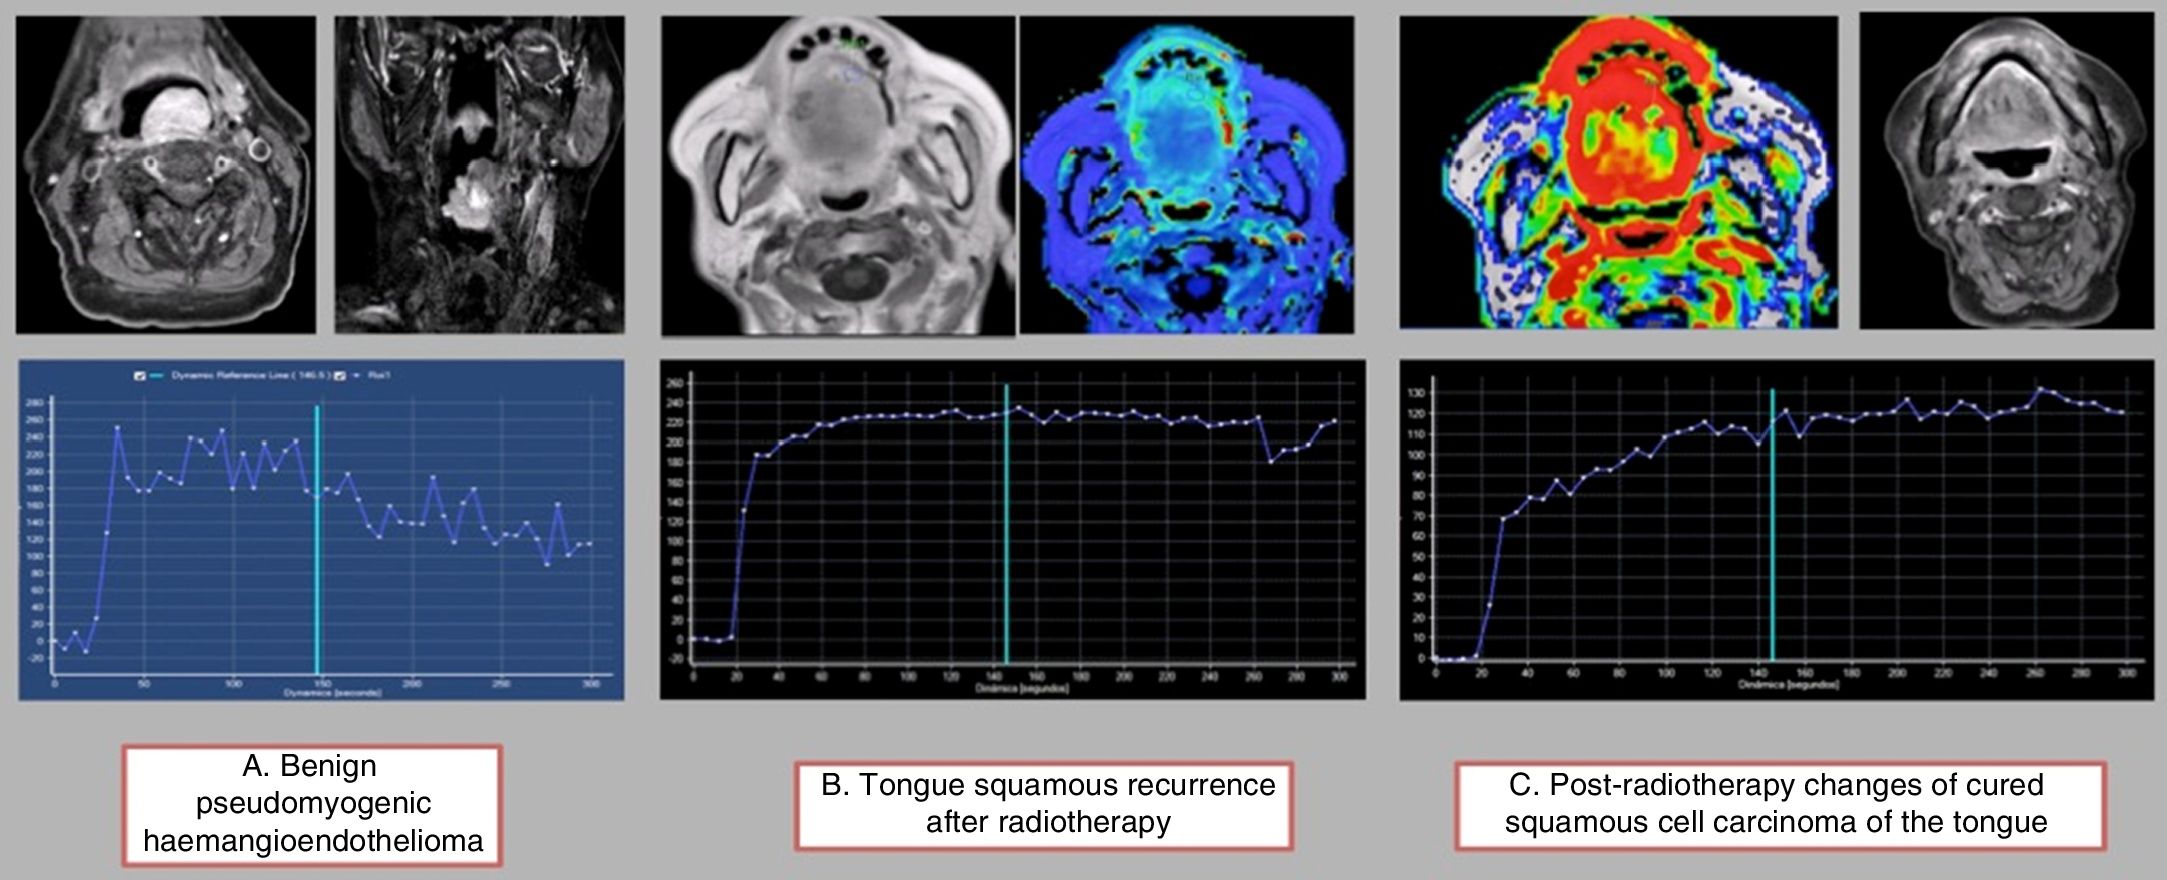
Using a semiquantitative assessment of the intensity-time curves,39 four types of “archetypal” haemodynamic curves have been established in head and neck pathology: benign lesions with a very short time to peak (TTP) and a quick wash-out with acute angle; malignant lesion without radiotherapy treatment with a long TTP (beyond 120s) and a slower wash-out; recurrent malignant lesions post-radiotherapy with a slightly slower TTP and a slow and light wash-out; and post-radiotherapy changes with a very delayed TTP with no wash-out (Fig. 8). The overlap and the difficulty in differentiating between the curves of malignant lesions and recurrent post-radiotherapy lesions is evident, and in these cases the previous history and the medical records are essential. The short TTP and the wash-out of benign lesions has been associated with normal microvascular circulation. Post-radiotherapy changes, however, show a very delayed TTP with no wash-out, which can be attributed to abnormal permeability in a highly altered microvascular bed.
 The first lesion corresponds to a benign tumour with a short TTP of less than 120s and a significant wash-out ratio. (B) The second lesion corresponds to a relapse on radiotherapy where we can see a prolonged TTP with very slight delayed wash-out. (C) The third image shows the post-radiotherapy changes, with a very prolonged TTP (more than 120s) without significant wash-out.")
Semiquantitative analysis of time-intensity curves: (A) The first lesion corresponds to a benign tumour with a short TTP of less than 120s and a significant wash-out ratio. (B) The second lesion corresponds to a relapse on radiotherapy where we can see a prolonged TTP with very slight delayed wash-out. (C) The third image shows the post-radiotherapy changes, with a very prolonged TTP (more than 120s) without significant wash-out.
As squamous cell carcinoma is the most common type of cancer in malignant lesions of the head and neck region, numerous groups have tried to assess the diagnostic and prognostic utility of the quantitative parameters obtained by the two-compartment Tofts’ model.
Overall, Ktrans is the most studied parameter.40 The parameter AUC90 is the one that best discriminates between squamous cell carcinoma and all the other undifferentiated carcinomas (better even than Ktrans). However, neither Ktrans nor the AUC90 were significant in differentiating between squamous cell carcinoma and lymphoma.41
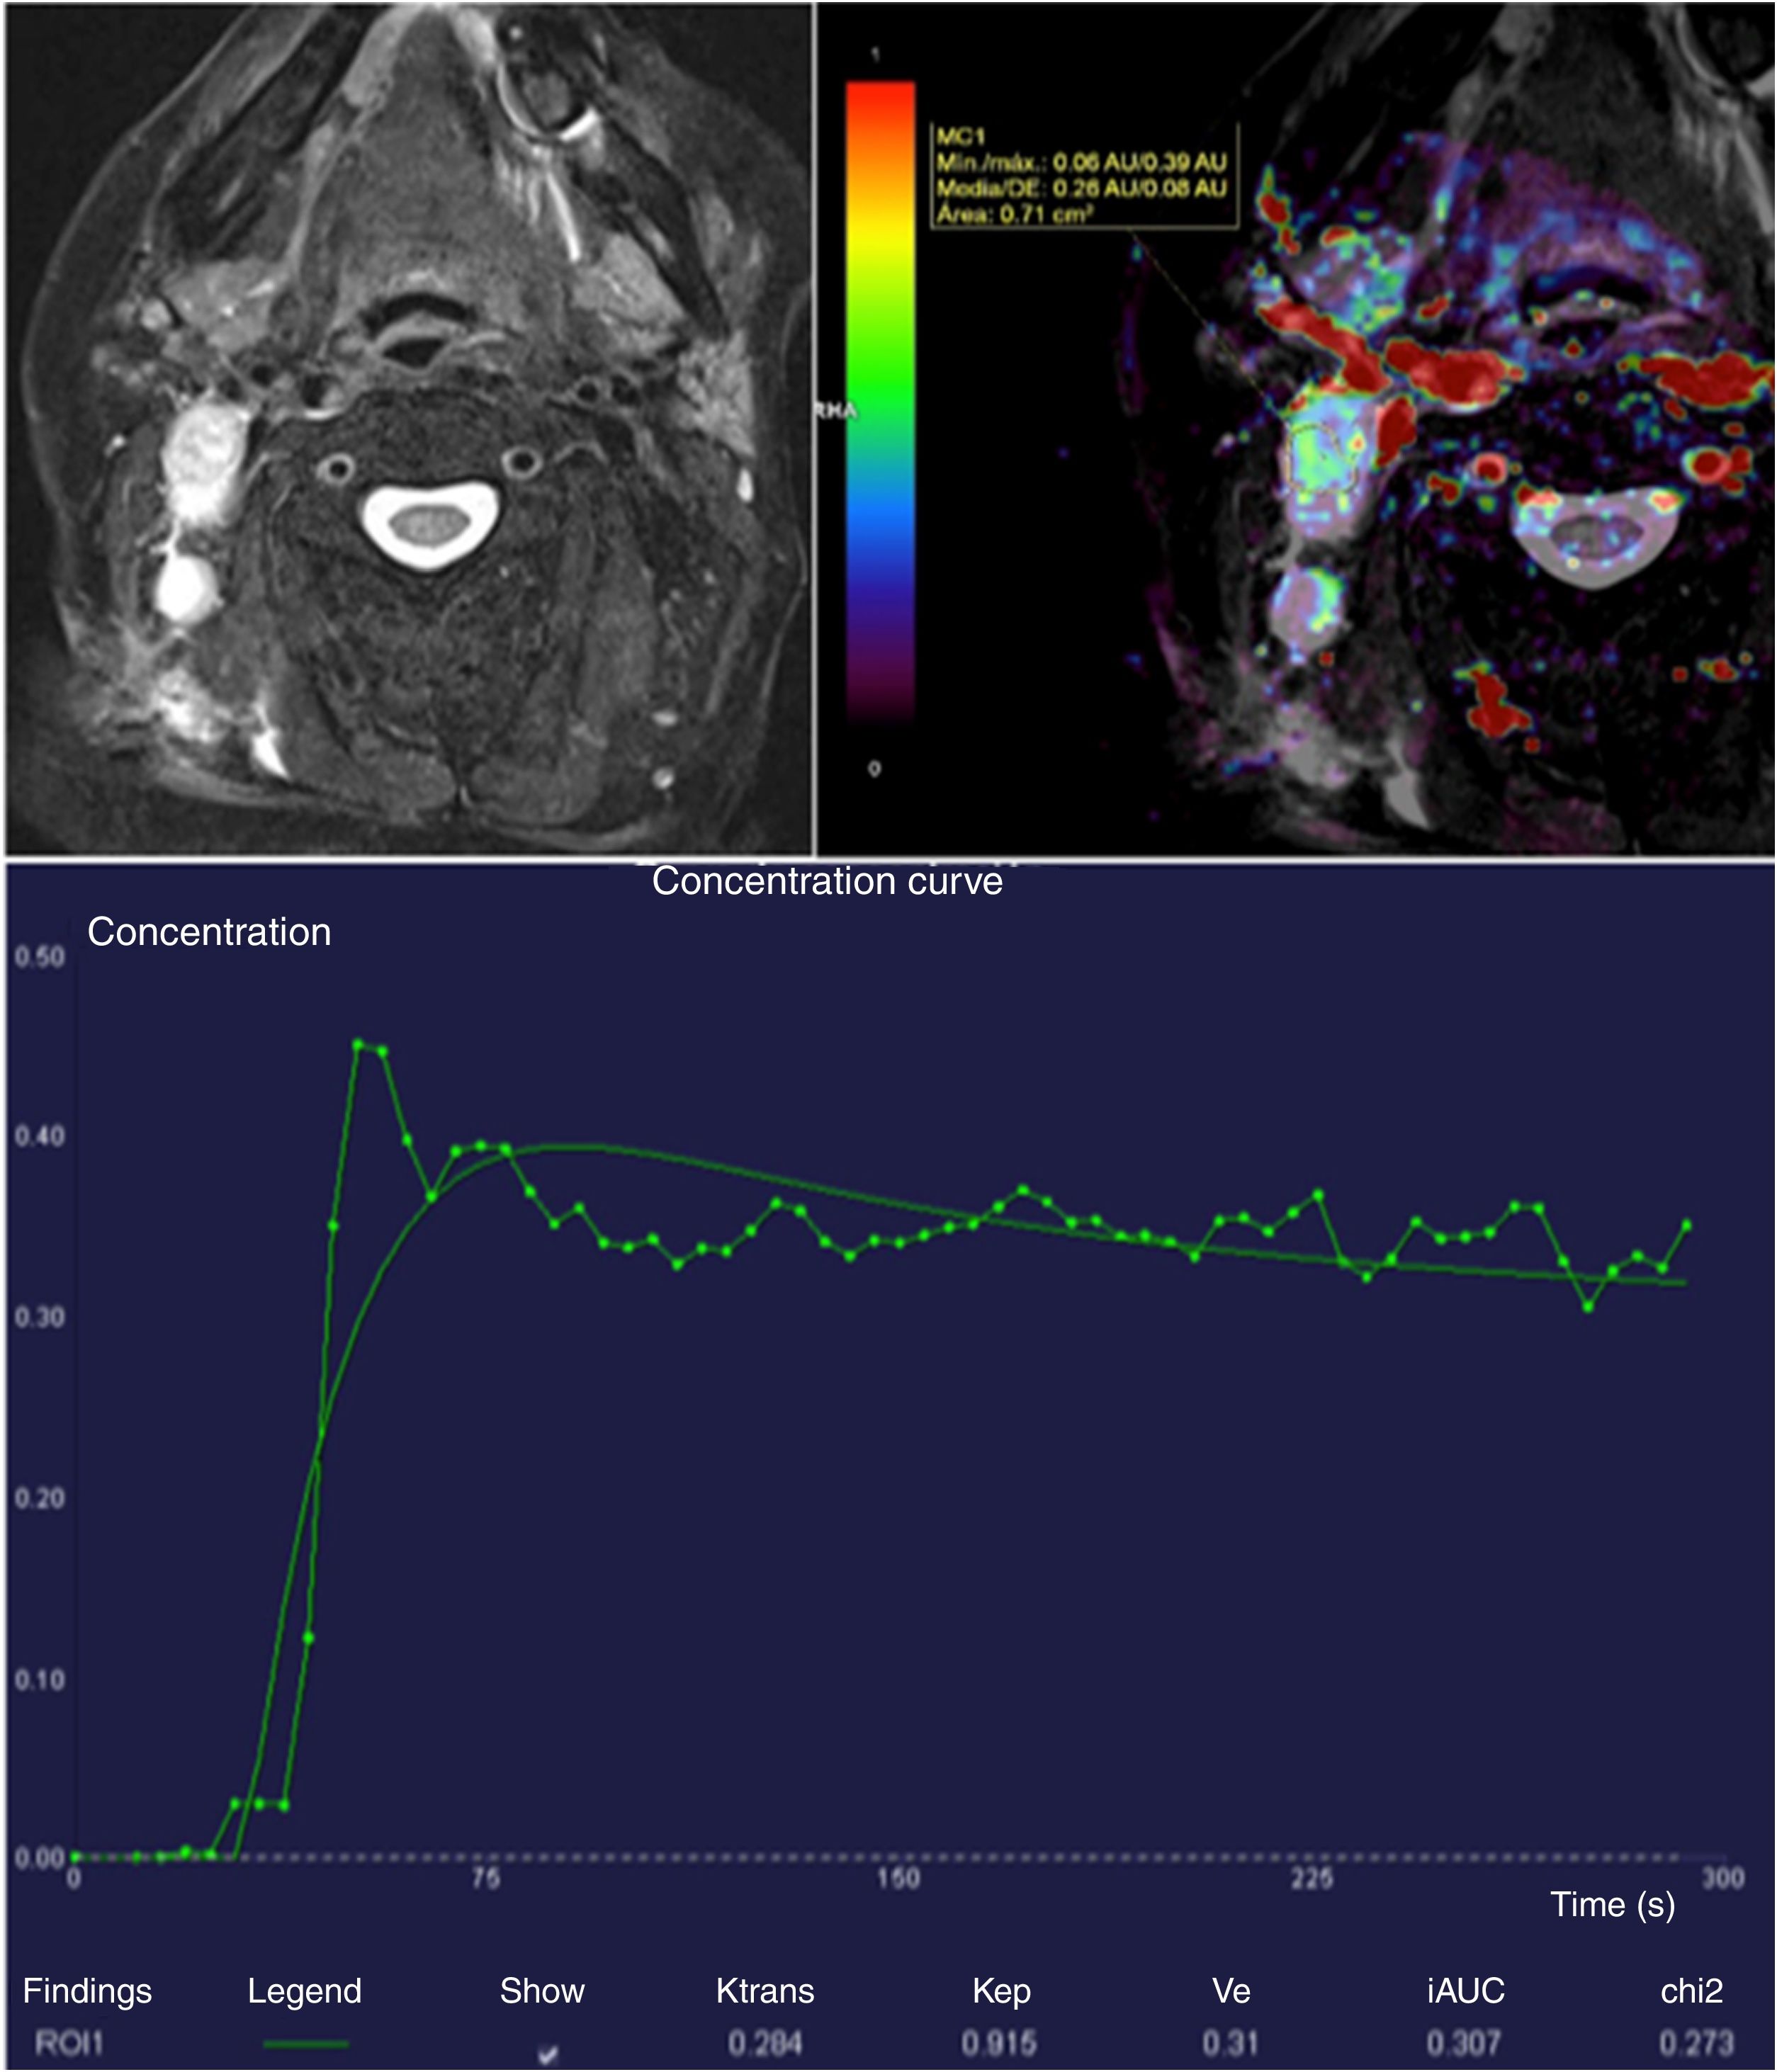
There is a strong correlation between high heterogeneity of Ktrans, disease-free survival and overall survival in patients with stage IV head and neck squamous cell carcinoma with lymph node metastases.42 A low Ktrans value before the start of treatment, both in the primary tumour and the lymph node metastases, is associated with a worse prognosis (worse response to the induction chemotherapy, probably due to lower permeability making it difficult for the chemotherapy agent to reach the cancer lesion) (Fig. 9).43 In contrast, an increase in the Ktrans value during chemotherapy is associated with a good treatment response.44

Right laterocervical lymph node metastases of squamous cell carcinoma confirmed by biopsy. The Ktrans map shows increased permeability predominantly around the periphery of the lymphadenopathy. The intensity-time curve shows an elevated Ktrans of 0.284, which suggests a good response to chemotherapy treatment. It can also be useful in monitoring treatment.
Some authors have compared the Kep and Ktrans parameters with the standardised uptake value (SUV) of positron emission tomography-computed tomography (PET-CT) without finding any clear correlation.45 While we await more extensive studies, both tests should be considered as complementary and not as exclusive, as they provide information on different pathophysiological aspects of head and neck cancer.
Other authors have tried to correlate perfusion parameters, especially Ve and Kep, with histopathological characteristics of tumours, and that would seem logical, given that the greater the cellularity of the tumour, the smaller the volume of extracellular space.46
We need to make special mention of the subtype of head and neck tumours located in the major salivary glands which, in combination with diffusion sequences and maps of apparent diffusion coefficient, show very characteristic dynamic perfusion behaviours. In these types of tumours both DCE perfusion and multiphase dynamic studies with five or more phases are useful.
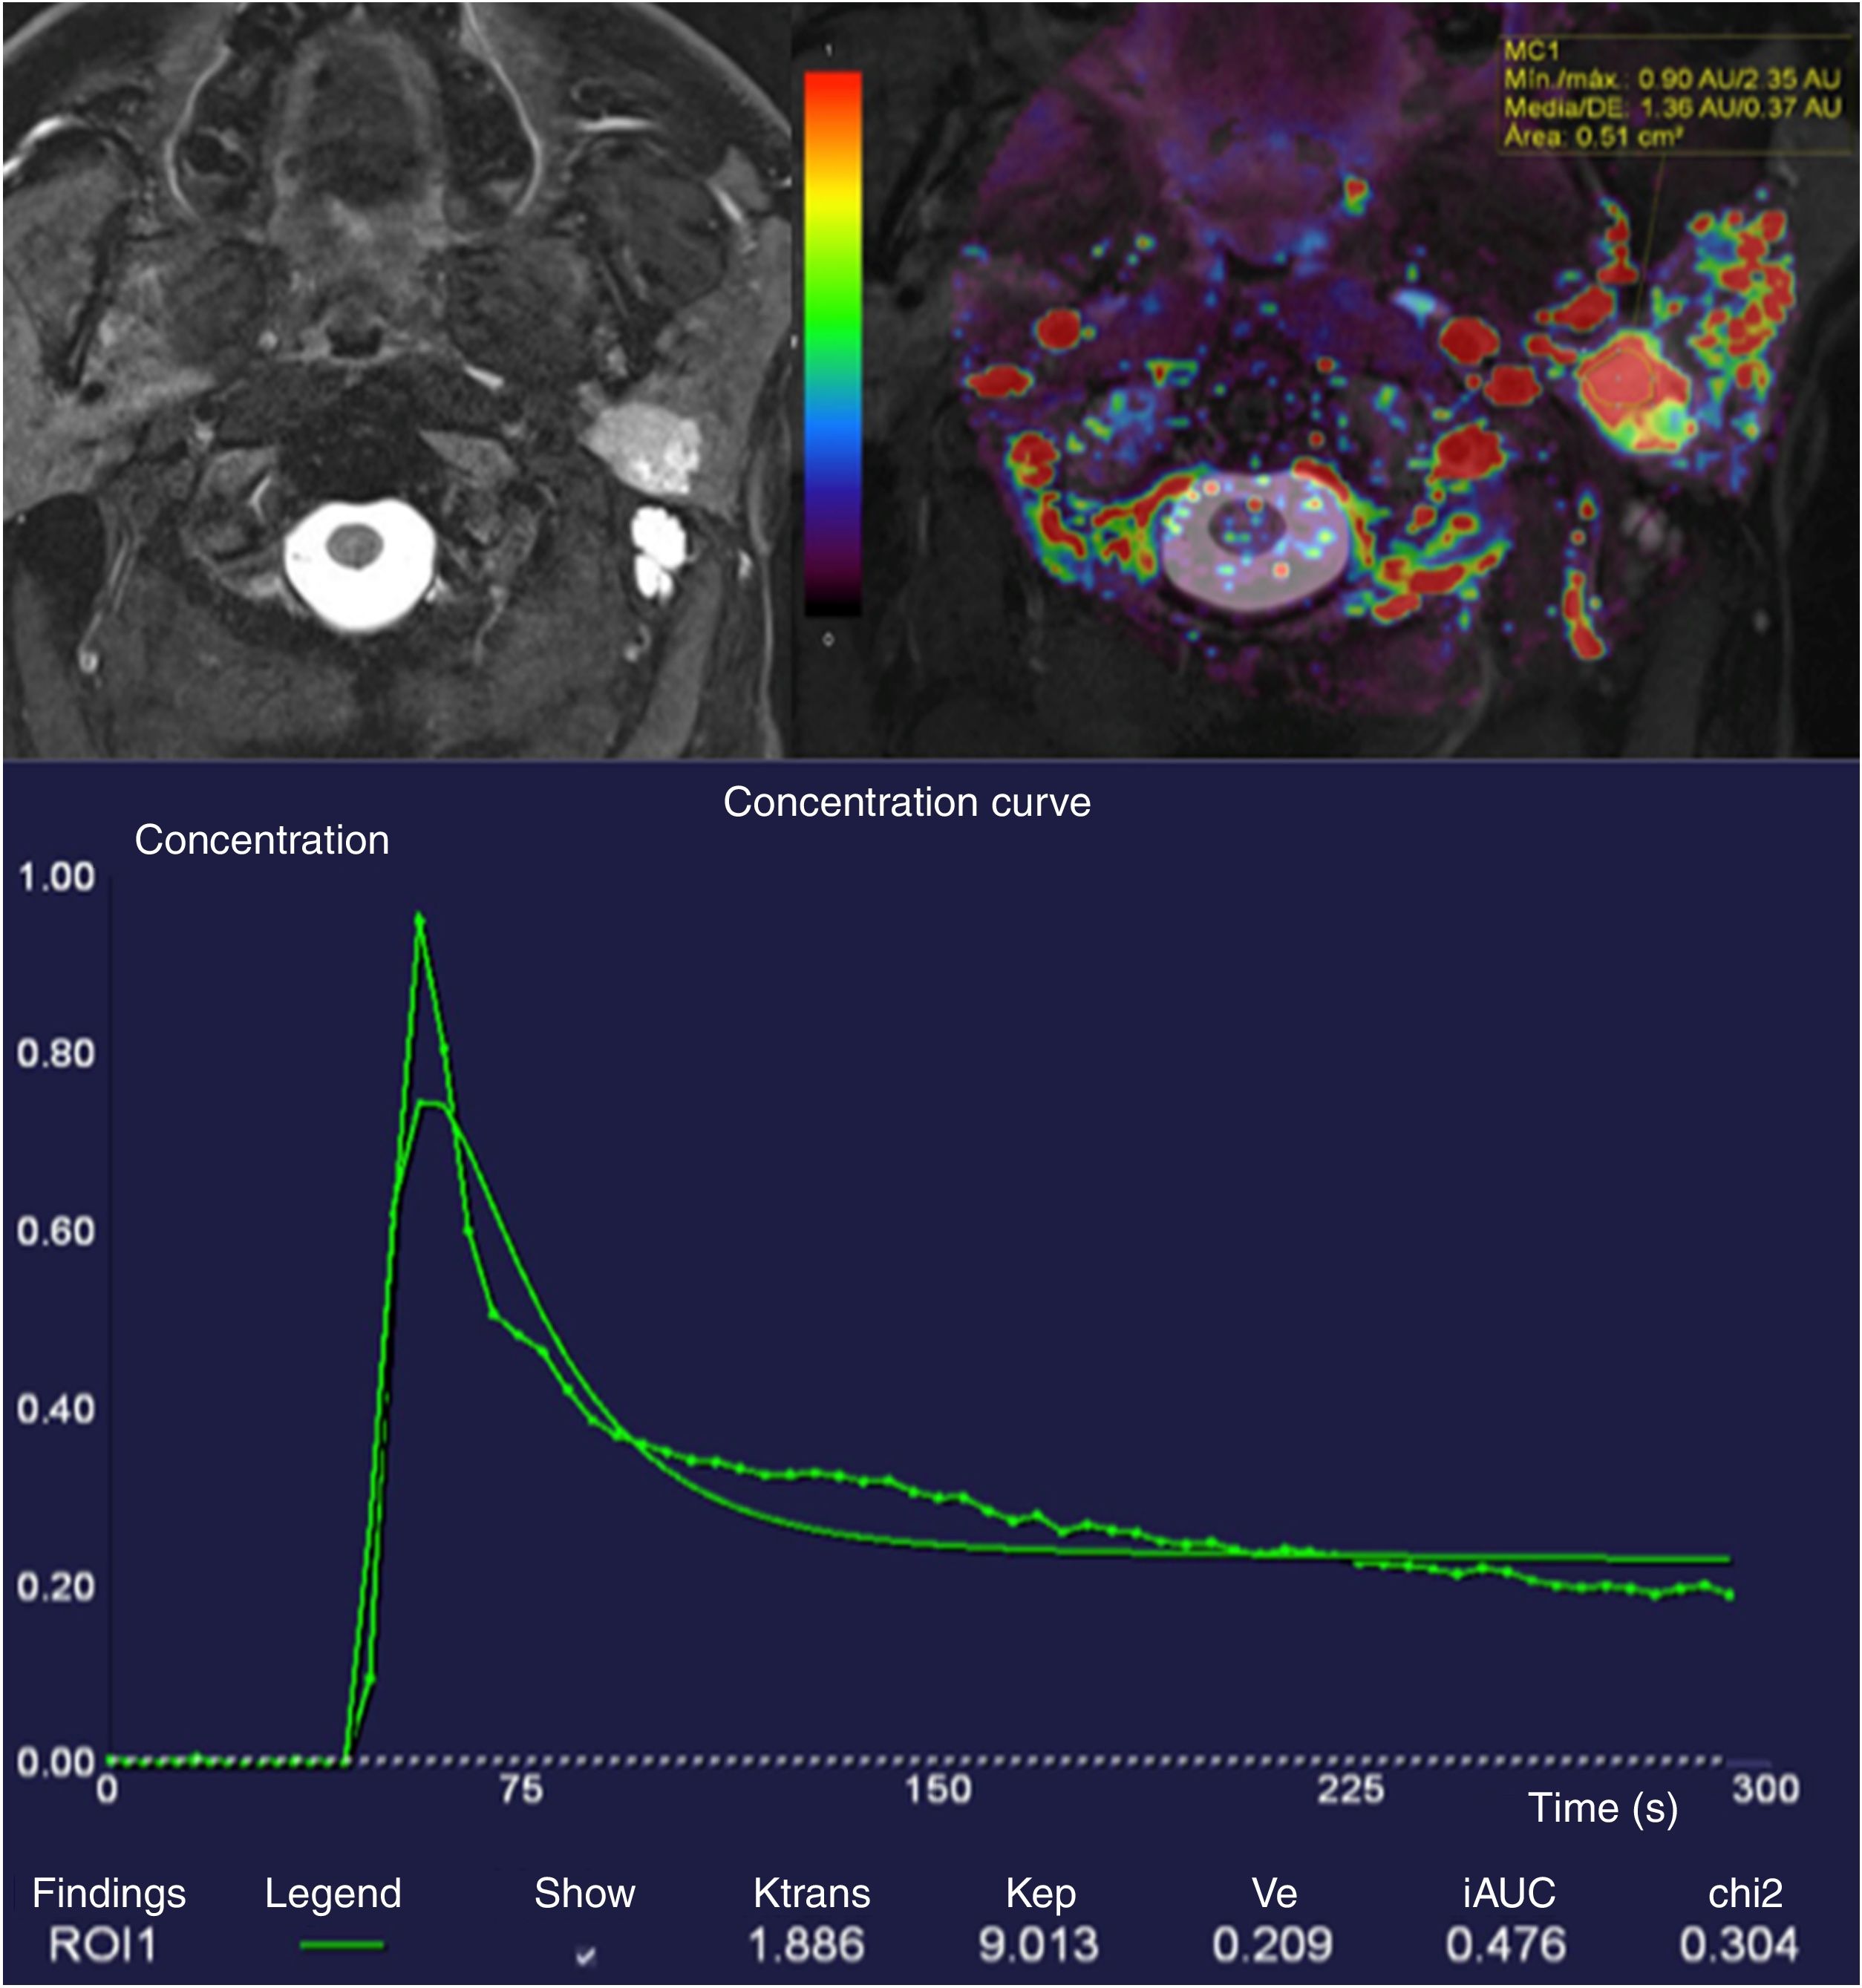
Although Yabuuchi et al. were the first to describe intensity-time curve patterns in their now-classic article,47 we now know of four different patterns: types I and II, characteristic of benign tumours, with progressive curves with late TTP, with no washout; type III, with TTP less than 120s and less than 30% wash-out, corresponding to malignant tumours; and type IV with TTP less than 120s and wash-out greater than 30% (Fig. 10) (Warthin's tumours and lymphomas).48
. Diffusion (not included) showed low ADC values. Lesion compatible (and confirmed by excision) with Warthin")
Hyperintense and homogeneous tumour in deep lobe of left parotid with well-defined borders in T2-weighted DIXON sequence with fat saturation. The lesion showed very high Ktrans values of up to 1.88. A semiquantitative analysis of the T1 perfusion curve shows a short TTP of less than 120s and a high wash-out ratio greater than 30% (type IV curve). Diffusion (not included) showed low ADC values. Lesion compatible (and confirmed by excision) with Warthin's tumour.
In summary, T1-weighted perfusion is an advanced technique which can be implemented in routine clinical practice in the assessment of head and neck tumours as a complement to traditional morphological sequences and diffusion sequences. T1-weighted perfusion adds important information, both for the characterisation of some of these tumours and for differentiation with post-treatment changes, and can play an important role in assessing prognosis and monitoring treatment.
ConclusionsAssessment of head and neck tumours is complex. Fortunately, however, non-invasive imaging techniques and radiation-free MRI are being developed. It is important to assess the anatomical images in conjunction with the functional sequences, in order to characterise the tumours at the time of diagnosis, but particularly to monitor the treatment response and identify residual disease or tumour recurrence in treated patients; this being an essential part of practising personalised medicine.
Author's contribution- 1.
Responsible for the integrity of the study: ESA, TMN and VSV.
- 2.
Study conception: ESA, TMN and VSV.
- 3.
Study design: ESA, TMN and VSV.
- 4.
Data acquisition: N/A.
- 5.
Analysis and interpretation of the data: N/A.
- 6.
Statistical processing: N/A.
- 7.
Literature search: ESA, TMN and VSV.
- 8.
Drafting of the paper: ESA, TMN and VSV.
- 9.
Critical review of the manuscript with relevant intellectual contributions: ESA, TMN and VSV.
- 10.
Approval of the final version: ESA, TMN and VSV.
The authors declare that they have no conflicts of interest.
Please cite this article as: Santos Armentia E, Martín Noguerol T, Suárez Vega V. Técnicas avanzadas de resonancia magnética en patología tumoral de cabeza y cuello. Radiología. 2019;61:191–203.

