


Our objective is to evaluate how useful an artificial intelligence (AI) tool is to chest radiograph readers with various levels of expertise for the diagnosis of COVID-19 pneumonia when the tool has been trained on a non-COVID-19 pneumonia pathology.
MethodsData was collected for patients who had previously undergone a chest radiograph and digital tomosynthesis due to suspected COVID-19 pneumonia. The gold standard consisted of the readings of two expert radiologists who assessed the presence and distribution of COVID-19 pneumonia on the images. Six medical students, two radiology trainees, and two other expert thoracic radiologists participated as additional readers. Two radiograph readings and a third supported by the AI Thoracic Care Suite tool were performed. COVID-19 pneumonia distribution and probability were assessed along with the contribution made by AI. Agreement and diagnostic performance were analysed.
ResultsThe sample consisted of 113 cases, of which 56 displayed lung opacities, 52.2% were female, and the mean age was 50.70 ± 14.9. Agreement with the gold standard differed between students, trainees, and radiologists. There was a non-significant improvement for four of the six students when AI was used. The use of AI by students did not improve the COVID-19 pneumonia diagnostic performance but it did reduce the difference in diagnostic performance with the more expert radiologists. Furthermore, it had more influence on the interpretation of mild pneumonia than severe pneumonia and normal radiograph findings. AI resolved more doubts than it generated, especially among students (31.30% vs 8.32%), followed by trainees (14.45% vs 5.7%) and radiologists (10.05% vs 6.15%).
ConclusionFor expert and lesser experienced radiologists, this commercial AI tool has shown no impact on chest radiograph readings of patients with suspected COVID-19 pneumonia. However, it aided the assessment of inexperienced readers and in cases of mild pneumonia.
Evaluar la utilidad de una herramienta de inteligencia artificial (IA) para los lectores de radiografías de tórax con distintos niveles de experiencia con el objetivo de diagnosticar la neumonía COVID-19 cuando la herramienta ha sido entrenada en una patología de neumonía no COVID-19.
MétodosSe recogieron datos de los pacientes que se habían sometido previamente a una radiografía de tórax y a una tomosíntesis digital por sospecha de neumonía COVID-19. El estándar de referencia consistió en las lecturas de dos radiólogos expertos que evaluaron la presencia y distribución de la neumonía COVID-19 en las imágenes. Seis estudiantes de medicina, dos residentes de radiología y otros dos radiólogos torácicos expertos participaron como lectores adicionales. Se realizaron dos lecturas radiográficas y una tercera con el apoyo de la herramienta de IA Thoracic Care Suite. Se evaluaron la distribución y la probabilidad de la neumonía COVID-19 junto con la contribución de la IA. Se analizaron la concordancia y el rendimiento diagnóstico.
ResultadosLa muestra estaba formada por 113 casos, de los cuales 56 presentaban opacidades pulmonares, el 52,2% eran mujeres y la edad media era de 50,70 ± 14,9 años. La concordancia con el estándar de referencia difirió entre estudiantes, residentes y radiólogos. Hubo una mejora no significativa para cuatro de los seis estudiantes cuando se utilizó la IA. El uso de la IA por parte de los estudiantes no mejoró el rendimiento diagnóstico de la neumonía COVID-19, pero sí redujo la diferencia en el rendimiento diagnóstico entre los radiólogos más expertos. Además, influyó más en la interpretación de la neumonía leve que de la grave y de los hallazgos radiográficos normales. La IA resolvió más dudas de las que generó, especialmente entre los estudiantes (31,30 frente a 8,32%), seguidos de los residentes (14,45 frente a 5,7%) y los radiólogos (10,05% frente a 6,15%).
ConclusiónPara los radiólogos expertos y los menos experimentados, esta herramienta comercial de IA no ha mostrado ningún impacto en las lecturas de radiografías de tórax de pacientes con sospecha de neumonía COVID-19. Sin embargo, ayudó a la evaluación de los lectores inexpertos y en los casos de neumonía leve.
The first imaging test to be performed when COVID-19 pneumonia is suspected is chest radiograph, due to its lower cost and greater availability.1 Although it is a very accessible test, there are many places in the world that do not have the necessary equipment or expert radiologists trained to interpret the tests correctly.2 On the other hand, in developed countries, work overload and limited radiologists resources mean that many radiology departments may not systematically report radiographs from the emergency department, and this may occur especially in pandemic peaks when the overload may increase. Therefore, artificial intelligence (AI) may prove to be a useful tool to help those healthcare professionals with less experience in radiology to interpret chest radiographs.
Data available from previous publications on AI may not necessarily translate into clinical outcomes,3 and commercial software is not trained for specific processes but rather responds to basic questions based on the detection of lesions such as nodules or consolidations.4 For this reason, it is interesting to assess the impact of these commercially available AI tools, which are not specifically trained to diagnose thoracic complications of COVID-19. For this purpose, it will be necessary to include in the analysis readers with different degrees of experience, to investigate the impact of the AI tool on each of them.
Our hypothesis is that a commercial AI software will have an impact on the reading of chest radiographs of patients with suspected COVID-19 pneumonia in all readers, regardless of their experience, from less to more experience (students, residents of radiology, radiologists).
Our objectives are to analyse (1) the intra-observer agreement to determinate the “Probability of COVID-19 pneumonia” with radiograph and the “Probability of involvement of each lung zone”; (2) each reader's agreement with the gold standard for “Probability of COVID-19 pneumonia” with radiograph and the “Probability of involvement of each lung zone”; with and without AI support; (3) the diagnostic performance of the readers before and after applying the AI; and (4) the readers' opinion of the overall benefit of the AI.
Material and methodsThis study was authorised by our Institutional Ethics Committee (Internal Code EST: 38/20). Due to the characteristics of the project, the Committee did not consider it necessary for the patients included to sign an informed consent form.
PatientsThe sample was selected from a database created during the first three waves of the disease. Inclusion criteria were: 1) suspicion/confirmation of COVID-19 infection; 2) suspicion of pneumonia; and 3) having a chest radiograph and 3D thoracic digital tomosynthesis so that it could serve as reference test. The only exclusion criterion was if the images were of insufficient quality to be assessed.
Two radiologists with 14 and 11 years of experience from the Emergency Radiology Unit assessed the probability of involvement (yes/no) for each lung zone in the chest radiographs of 480 patients using both chest radiographs and 3D tomosynthesis images. From these, those cases were selected in which the two radiologists agreed on their verdict of involvement (yes/no) for all lung zones (Fig. 1). Thus, the pathological radiograph group consisted of 56 cases with agreement in the distribution of lung opacities. When the radiologists disagreed in determining the probability of COVID-19 pneumonia, a final decision was made by consensus. In addition, a randomised sample of 57 cases with chest radiographs without opacities according to both radiologists was added, which constituted the group of normal radiographs (Fig. 2).
 Posteroanterior chest radiograph with normal findings. Division of the radiograph into 6 lung fields. This was done by drawing an upper horizontal line (lower border of the aortic arch) and a lower horizontal line (lower border of the right inferior pulmonary vein).")

Sample selection.
Cases in which the contribution of artificial intelligence was assessed according to the severity of pneumonia and in normal versus pathological cases are shown in bold.
* According to both radiologists after evaluating blindly the radiographs and 3D tomosynthesis.
** According to the most experienced radiologist assessing the radiograph.
The following readers participated in the analysis: two fourth-year medical students (student 4-1 and student 4-2), two fifth-year medical students (student 5-1 and student 5-2), two sixth-year medical students (student 6-1 and student 6-2), one second-year radiology resident, one third-year radiology resident and two expert radiologists other than the gold standard (radiologist 1 and radiologist 2), with 20 and 13 years of experience in thoracic radiology, respectively. The total number of radiographs was evaluated in 3–5 sessions of 3−4 h each for each assessment.
Part 1 (Fig. 3)Prior to the first assessment of the radiographs, a short seminar was held to explain the technical aspects of the assessment. The radiographs were then accessed anonymously by means of the medical record number and the date of the test.
. Abbreviations: AI: artificial intelligence; AUC: area under the curve.")
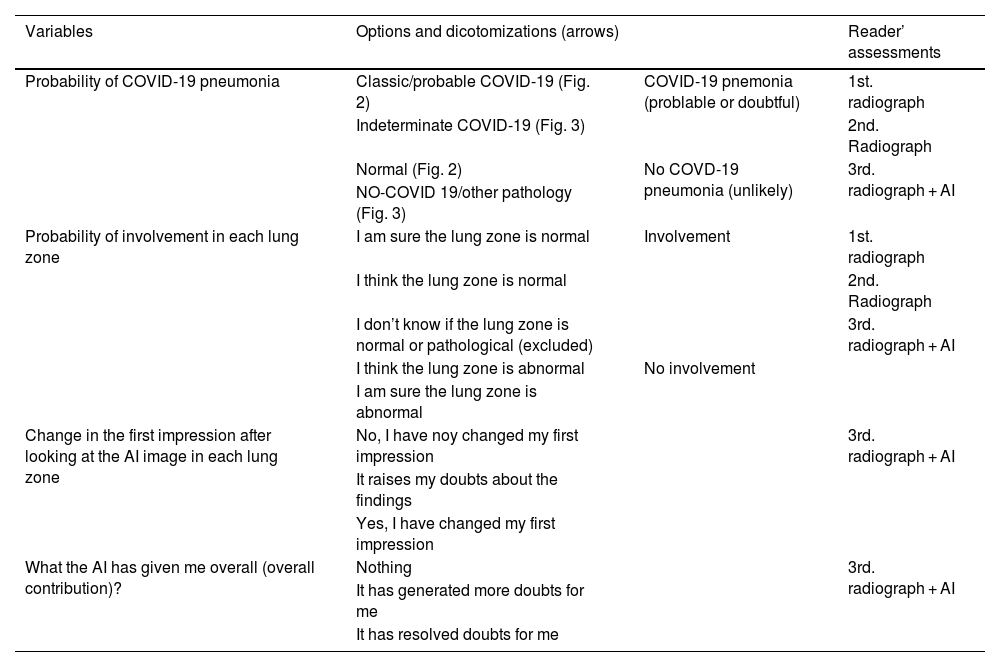
The variables assessed in the first assessment, described in Table 1, were:
- a)
Probability of COVID-19 pneumonia according to radiographs, based on the British Society of Thoracic Radiology classification5 (Figs. 4 and 5).
- b)
Probability of involvement in each lung zone. For that, the chest radiographs were analysed after dividing the image into 6 lung zones (Fig. 1).
 Posteroanterior chest radiograph with normal findings. (b) Posteroanterior chest radiograph with findings compatible with classic COVID-19 pneumonia.")
 Posteroanterior chest radiograph with findings compatible with indeterminate COVID-19 pneumonia. (b) Posteroanterior chest radiograph with findings compatible with non-COVID-19 disease (bacterial pneumonia).")
Definition of variables, dichotomization, and assessment where the variables were recruited.
| Variables | Options and dicotomizations (arrows) | Reader’ assessments | |
|---|---|---|---|
| Probability of COVID-19 pneumonia | Classic/probable COVID-19 (Fig. 2) | COVID-19 pnemonia (problable or doubtful) | 1st. radiograph |
| Indeterminate COVID-19 (Fig. 3) | 2nd. Radiograph | ||
| Normal (Fig. 2) | No COVD-19 pneumonia (unlikely) | 3rd. radiograph + AI | |
| NO-COVID 19/other pathology (Fig. 3) | |||
| Probability of involvement in each lung zone | I am sure the lung zone is normal | Involvement | 1st. radiograph |
| I think the lung zone is normal | 2nd. Radiograph | ||
| I don’t know if the lung zone is normal or pathological (excluded) | 3rd. radiograph + AI | ||
| I think the lung zone is abnormal | No involvement | ||
| I am sure the lung zone is abnormal | |||
| Change in the first impression after looking at the AI image in each lung zone | No, I have noy changed my first impression | 3rd. radiograph + AI | |
| It raises my doubts about the findings | |||
| Yes, I have changed my first impression | |||
| What the AI has given me overall (overall contribution)? | Nothing | 3rd. radiograph + AI | |
| It has generated more doubts for me | |||
| It has resolved doubts for me | |||
Abbreviations: AI: artificial intelligence.
This part was separated in time from part 1 by at least 4 weeks.
A short preparation phase was performed, consisting of a video made exclusively for this project by General Electric Healthcare on how to use the AI software Thoracic Care Suite (GE Healthcare. Milwaukee, WI, USA).
Then, in order to be able to determine intra-observer variability and not attribute this variation entirely to the interpretation of the IA image, a second assessment of the radiographs was performed in which the same variables were analysed as in the first assessment.
Immediately after that, the chest radiograph and the image with the results of the AI software were opened together in a third assessment (Fig. 3). The variables assessed were the same as in the first and second assessment, and two more for describing their opinions about the AI image contribution: (a) Change of the first impression after looking at the AI image in each lung zone, and (b) Overall contribution of AI (Table 1).
Performed analyses and statisticsThe assessment of chest radiograph and tomosynthesis by the two radiologists of the Emergency Radiology Unit was considered as the gold standard.
The variables “Probability of COVID-19 pneumonia” and “Probability of involvement in each lung zone” were dichotomised (Table 1).
The statistical analyses performed were as follows (Fig. 3):
Agreement analysesThe following were analysed:
- -
Intraobserver agreements for “Probability of COVID-19 pneumonia” and “Probability of involvement in each lung zone” of the first and second assessment.
- -
Interobserver agreements with gold standard of students, residents and radiologists for “Probability of COVID-19 pneumonia” and “Probability of involvement in each lung zone” in the first assessment, second assessment and in the assessment of chest radiograph and AI together. We compared the agreements results of the three assessments of each reader to determine the potential improvement with AI.
Cohen's Kappa coefficient (K) with 95% confidence intervals (CI-95%) was used. The agreement degree was established according to the method of Landis and Koch.6 Agreement was considered poor (below 0.2), weak (0.21−0.4), moderate (0.41−0.6), good (0.61−0.8), or excellent (above 0.80).
The AI software was considered to contribute to the reader when the K value when using the AI applied to the radiograph exceeded the K value of the first and second assessments of each reader, for which we also present the percentages of improvement.
Diagnostic performanceThe diagnostic performance for “Probability of COVID-19 pneumonia” of the first assessment, second assessment and assessment with AI for each reader were analysed with the Receiver Operating Curve-ROC and the resulting areas under the curve (AUC) were compared with the DeLong test. Differences in proportions between groups (between the different assessments of students, residents and radiologists) for each assessment were analysed with the Chi-Square test or Fischer's exact test. The evolution over the three successive assessments of the number of significant differences in diagnostic performance (NSDDP) of the students between them, and with residents and radiologists.
Additionally, to determine whether the contribution of assessing the AI image was favourable or unfavourable, a count was made of the number of times the reader’s interpretation changes in the “Probability of involvement of each lung zone”, as well as the number of times this change agreed with the gold standard, and the number of times it disagreed. In addition, to determine whether it would be helpful to have available the AI image in cases of pneumonia with subtle radiological manifestations, a distinction was made between COVID-19 pneumonia with Brixia Score in the group of 56 patients with pathological radiographs. For Brixia Score assessment, chest radiograph is divided in six lung zones (Fig. 1a), and opacities in each zone are quantified as 0: normal; 1: ground glass opacities (GGO); 2: GGO and consolidations with GGO predominance; 3: consolidations with or without GGO, with consolidation predominance. The punctuation ranges from 0 to 18 points.7 A Brixia Score less than or equal to and greater than 9 points according to the emergency radiologist with 14 years of experience, as this is the midpoint of severity according to the Brixia Score (Fig. 2). The frequencies for this count were analysed descriptively.
Study of opinion frequencies in the joint reading of the radiograph with AIThe frequencies of each reader's responses to the questions related to their perception of the IA contribution were analysed descriptively.
The statistical programmes used for the analysis were IBM SPSS Statistics version 20 and MedCalc version 12.7.0.0. A P value of <.05 was considered a significant result.
ResultsSampleA final sample of 113 patients was obtained, 56 with lung opacities, 48 suggestive of COVID-19 pneumonia, 15 with Brixia Score > 9 points (Fig. 2). Fifty-two point two percent were women, with mean age ± standard deviation, median age [interquartilic range] and age range of 50.70 ± 14.9, 49 [40.5–62] and 19–88 years.
No studies were excluded.
For each assessment (Fig. 3), between 3 and 5 sessions of 3−4 h each were held.
Agreement analysesConsidering all the readers, 10 K values were obtained for the “Probability of COVID-19 pneumonia” in each of the three assessments, and 60 K values for the “Probability of involvement of each lung zone”, respectively.
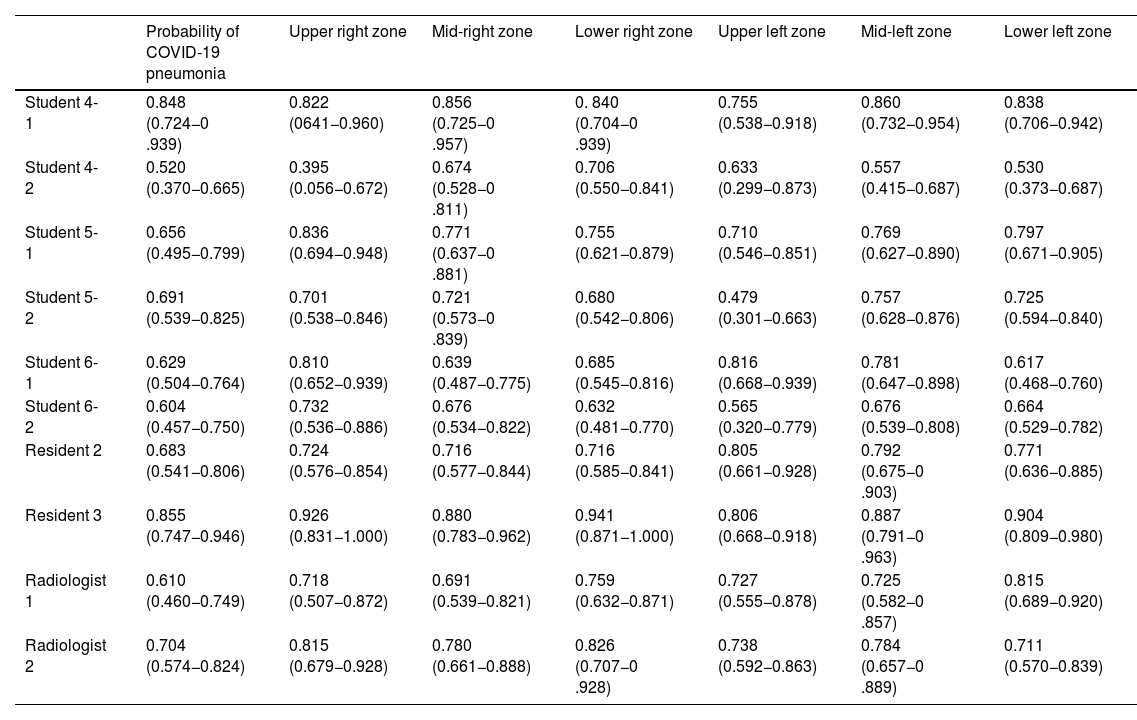
Intraobserver agreements between the first and second assessments (Table 2)For “Probability of COVID-19 pneumonia” with radiograph, intraobserver agreements were predominantly good (7/10, 70%) versus excellent (2/10, 20%) and moderate (1/10, 10%) agreements.
Intraobserver agreements.
| Probability of COVID-19 pneumonia | Upper right zone | Mid-right zone | Lower right zone | Upper left zone | Mid-left zone | Lower left zone | |
|---|---|---|---|---|---|---|---|
| Student 4-1 | 0.848 (0.724−0 .939) | 0.822 (0641−0.960) | 0.856 (0.725−0 .957) | 0. 840 (0.704−0 .939) | 0.755 (0.538−0.918) | 0.860 (0.732−0.954) | 0.838 (0.706−0.942) |
| Student 4-2 | 0.520 (0.370−0.665) | 0.395 (0.056−0.672) | 0.674 (0.528−0 .811) | 0.706 (0.550−0.841) | 0.633 (0.299−0.873) | 0.557 (0.415−0.687) | 0.530 (0.373−0.687) |
| Student 5-1 | 0.656 (0.495−0.799) | 0.836 (0.694−0.948) | 0.771 (0.637−0 .881) | 0.755 (0.621−0.879) | 0.710 (0.546−0.851) | 0.769 (0.627−0.890) | 0.797 (0.671−0.905) |
| Student 5-2 | 0.691 (0.539−0.825) | 0.701 (0.538−0.846) | 0.721 (0.573−0 .839) | 0.680 (0.542−0.806) | 0.479 (0.301−0.663) | 0.757 (0.628−0.876) | 0.725 (0.594−0.840) |
| Student 6-1 | 0.629 (0.504−0.764) | 0.810 (0.652−0.939) | 0.639 (0.487−0.775) | 0.685 (0.545−0.816) | 0.816 (0.668−0.939) | 0.781 (0.647−0.898) | 0.617 (0.468−0.760) |
| Student 6-2 | 0.604 (0.457−0.750) | 0.732 (0.536−0.886) | 0.676 (0.534−0.822) | 0.632 (0.481−0.770) | 0.565 (0.320−0.779) | 0.676 (0.539−0.808) | 0.664 (0.529−0.782) |
| Resident 2 | 0.683 (0.541−0.806) | 0.724 (0.576−0.854) | 0.716 (0.577−0.844) | 0.716 (0.585−0.841) | 0.805 (0.661−0.928) | 0.792 (0.675−0 .903) | 0.771 (0.636−0.885) |
| Resident 3 | 0.855 (0.747−0.946) | 0.926 (0.831−1.000) | 0.880 (0.783−0.962) | 0.941 (0.871−1.000) | 0.806 (0.668−0.918) | 0.887 (0.791−0 .963) | 0.904 (0.809−0.980) |
| Radiologist 1 | 0.610 (0.460−0.749) | 0.718 (0.507−0.872) | 0.691 (0.539−0.821) | 0.759 (0.632−0.871) | 0.727 (0.555−0.878) | 0.725 (0.582−0 .857) | 0.815 (0.689−0.920) |
| Radiologist 2 | 0.704 (0.574−0.824) | 0.815 (0.679−0.928) | 0.780 (0.661−0.888) | 0.826 (0.707−0 .928) | 0.738 (0.592−0.863) | 0.784 (0.657−0 .889) | 0.711 (0.570−0.839) |
Kappa coefficient (K) with 95% confidence intervals in brackets for intra-observer agreement on the first and second readings of chest radiographs for each lung zone and for the probability of pneumonia COVID-19.
For “Probability of involvement of each lung zone” with radiograph, intraobserver agreement was predominantly good (37/60, 61.66%), with a smaller proportion of excellent agreements (18/60, 30%), and an even smaller proportion of moderate (4/60, 6.66%) or weak (1/60, 1.66%) agreements.
Agreements with gold standard in the first, second and third assessmentsFor “Probability of COVID-19 pneumonia” with radiograph (Fig. 6).
 is shown the K value in the centre label, and the percentage of improvement (“+”) or worsening (“-”) or no change (“/”) of the AI compared to the highest value of the first and second assessment in the top label; no change has been considered when the AI generated an intermediate value between the first and second reader assessment. Abbreviations: AI: artificial intelligence; MS4-1: fourth year medical student number 1; MS4-2: fourth year medical student number 2; MS5-1: fifth year medical student number 1; MS5-2: fifth year medical student number 2; MS6-1: sixth year medical student number 1; MS6-2: sixth year medical student number 2; RR2: second year Radiology resident; RR3: third year Radiology resident; ER1: expert radiologist number 1; ER2: expert radiologist number 2.")
Agreement for “Probability of COVID-19 pneumonia with radiograph” between each reader and the gold standard.
For each assessment, the kappa coefficient corresponds to the bar centre and their 95% confidence intervals to the bar limits.
For the assessment with artificial intelligence (AI) is shown the K value in the centre label, and the percentage of improvement (“+”) or worsening (“-”) or no change (“/”) of the AI compared to the highest value of the first and second assessment in the top label; no change has been considered when the AI generated an intermediate value between the first and second reader assessment.
Abbreviations: AI: artificial intelligence; MS4-1: fourth year medical student number 1; MS4-2: fourth year medical student number 2; MS5-1: fifth year medical student number 1; MS5-2: fifth year medical student number 2; MS6-1: sixth year medical student number 1; MS6-2: sixth year medical student number 2; RR2: second year Radiology resident; RR3: third year Radiology resident; ER1: expert radiologist number 1; ER2: expert radiologist number 2.
Twenty K-values were obtained after pooling the K-value of each reader for the first and second assessment. As above, all readers' agreements with the gold standard at the first and second assessment without AI were predominantly good (14/20, 70%) versus excellent (2/20, 10%) and moderate (4/20, 20%) agreements. With AI, agreements were good (9/10, 90%) except one moderate agreement (1/10, 10%).
For “Probability of involvement of each lung zone” (Supplementary tables 1a–1f).
One hundred and twenty K-values were obtained after pooling the K-value of each reader for the first and second assessment. Overall, agreements with the gold standard at the first and second assessment without using AI in all participants was mostly good (66/120, 55%), with minor proportions of moderate (27/120, 22.5%) and excellent (25/120, 20.83%) agreements, and anecdotal proportions of weak agreements (2/120, 1.66%).
With AI, agreements with gold standard across all participants was mostly good (30/60, 50%), with minor proportions of excellent (20/60, 33.3%) and moderate (7/60, 11.66%) agreements, and anecdotal proportions of weak (2/60, 3.33%) and poor (1/60, 1.66%) agreements.
As for the effect in the students group, AI increased agreements with gold standard by 50% (18/36), decreased it by 19.44% (7/36) and was indifferent for 30.55% (11/36). In the residents and radiologists group, AI increased agreements by 37.5% (9/24), decreased it by 45.83% (11/24) and was indifferent for 16.66% (4/24; column “percentage of +/-” in supplementary Table 1).
The agreement with the gold standard for “Probability of involvement of each lung zone” was significantly lower for the students group compared with residents and radiologists’ group (P < .001). No significant differences were found in all other comparisons. The agreement with the gold standard for “Probability of COVID-19 pneumonia” improved for all students after the AI assessment compared with the first and second assessment, except for the students 4-1 and 6-2 (Fig. 6), with no significant differences.
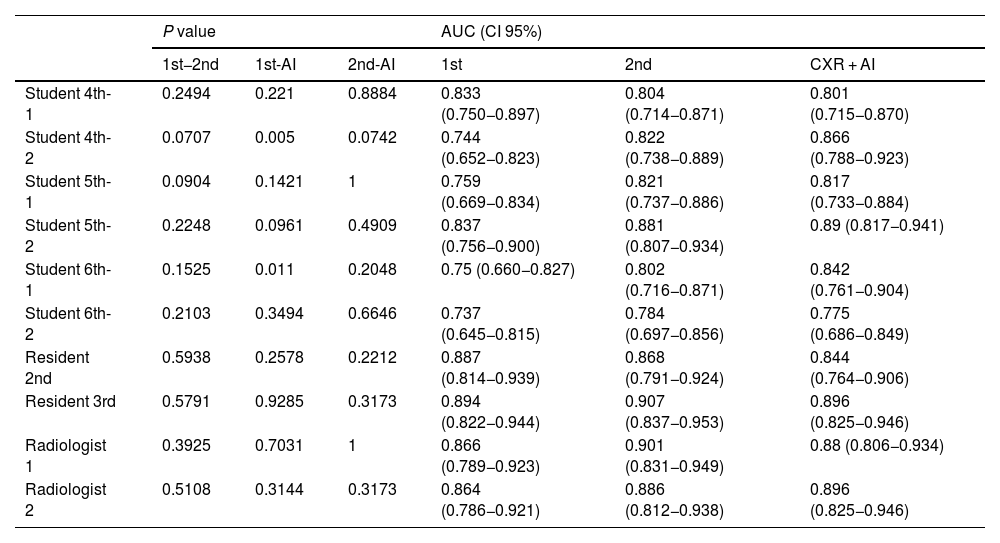
Diagnostic performanceFor “Probability of COVID-19 pneumonia” in the first, second and three assessmentsDifferences for each reader (Table 3)- -
In students without AI, the AUC ranged from 0.737 to 0.881. With AI the AUC ranged from 0.775 to 0.890. In two of the students (student 4-2; student 6-1) AI improved the diagnostic performance of the first assessment. There were no significant differences in the remaining students.
- -
In residents and radiologists, without using AI, the AUC ranged between 0.864 and 0.907. Using AI the AUC ranged from 0.844 to 0.896. There was no statistically significant difference between the diagnostic performances of the three assessments for each of the readers.
Table 3.Diagnostic performance of each reader in their first assessment, second assessment and joint assessment with artificial intelligence.
P value AUC (CI 95%) 1st−2nd 1st-AI 2nd-AI 1st 2nd CXR + AI Student 4th-1 0.2494 0.221 0.8884 0.833 (0.750−0.897) 0.804 (0.714−0.871) 0.801 (0.715−0.870) Student 4th-2 0.0707 0.005 0.0742 0.744 (0.652−0.823) 0.822 (0.738−0.889) 0.866 (0.788−0.923) Student 5th-1 0.0904 0.1421 1 0.759 (0.669−0.834) 0.821 (0.737−0.886) 0.817 (0.733−0.884) Student 5th-2 0.2248 0.0961 0.4909 0.837 (0.756−0.900) 0.881 (0.807−0.934) 0.89 (0.817−0.941) Student 6th-1 0.1525 0.011 0.2048 0.75 (0.660−0.827) 0.802 (0.716−0.871) 0.842 (0.761−0.904) Student 6th-2 0.2103 0.3494 0.6646 0.737 (0.645−0.815) 0.784 (0.697−0.856) 0.775 (0.686−0.849) Resident 2nd 0.5938 0.2578 0.2212 0.887 (0.814−0.939) 0.868 (0.791−0.924) 0.844 (0.764−0.906) Resident 3rd 0.5791 0.9285 0.3173 0.894 (0.822−0.944) 0.907 (0.837−0.953) 0.896 (0.825−0.946) Radiologist 1 0.3925 0.7031 1 0.866 (0.789−0.923) 0.901 (0.831−0.949) 0.88 (0.806−0.934) Radiologist 2 0.5108 0.3144 0.3173 0.864 (0.786−0.921) 0.886 (0.812−0.938) 0.896 (0.825−0.946) Abbreviations: AI: artificial intelligence; 1st−2nd: P value of the first and second assessment; 1st-AI: P value of the first assessment and the assessment with the AI; 2nd-AI: P value of the second assessment and the assessment with the AI; AUC: area under the curve; CI-95%: 95% confidence interval; 1st: AUC of the first assessment; 2nd: AUC of the second assessment; CXR + AI: AUC of assessment with IA.
Overall, there was a decreasing in the number of statistically significant differences (NSDDP) between the students group and the residents and radiologists’ group in the first assessment (21 NSDDP 66.66%) and second assessment (17 NSDDP, 58.33%), and the assessment with AI (15 NSDDP, 45.83%, Fig. 7).
. For each assessment, the area under the curve (AUC) corresponds to the bar centre and their 95% confidence intervals to the bar limits. The arrows represent the significant differences according to the DeLong test for each medical student with the rest of the readers. The number of significant differences decreases between the first and second assessment, and between the second and the assessment with AI. There were no significant differences between resident radiologists, expert radiologists or between residents and experts in the first, second and AI assessments. Abbreviations: AI: artificial intelligence; MS4-1: fourth year medical student number 1; MS4-2: fourth year medical student number 2; MS5-1: fifth year medical student number 1; MS5-2: fifth year medical student number 2; MS6-1: sixth year medical student number 1; MS6-2: sixth year medical student number 2; RR2: second year Radiology resident; RR3: third year Radiology resident; ER1: expert radiologist number 1; ER2: expert radiologist number 2.")
Comparison of the diagnostic performance for the first and second assessment, and for the assessment with artificial intelligence (AI).
For each assessment, the area under the curve (AUC) corresponds to the bar centre and their 95% confidence intervals to the bar limits. The arrows represent the significant differences according to the DeLong test for each medical student with the rest of the readers. The number of significant differences decreases between the first and second assessment, and between the second and the assessment with AI. There were no significant differences between resident radiologists, expert radiologists or between residents and experts in the first, second and AI assessments.
Abbreviations: AI: artificial intelligence; MS4-1: fourth year medical student number 1; MS4-2: fourth year medical student number 2; MS5-1: fifth year medical student number 1; MS5-2: fifth year medical student number 2; MS6-1: sixth year medical student number 1; MS6-2: sixth year medical student number 2; RR2: second year Radiology resident; RR3: third year Radiology resident; ER1: expert radiologist number 1; ER2: expert radiologist number 2.
Considering the 6 students, 2 residents and 2 radiologists and the 6 lung zones of the 113 patients, the evaluation would consist of 6780 observations of lung zone involvement. In 331 areas no verdict of probability of involvement was given by the readers, so 6449 lung areas were assessed for this analysis.
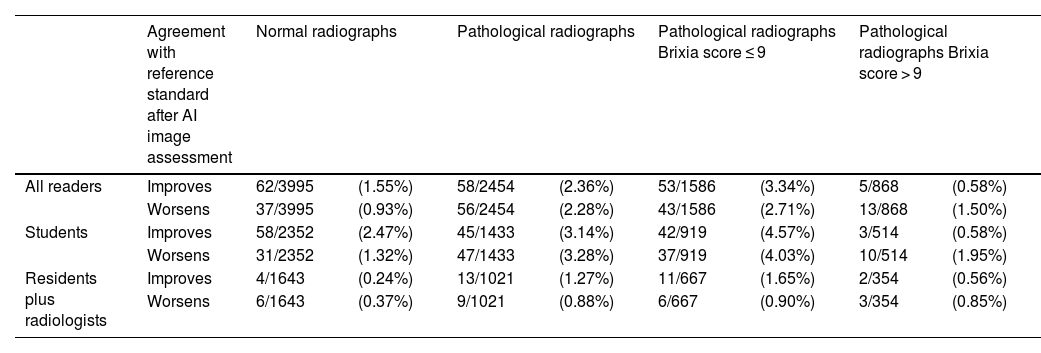
After assessing the AI image, the probability of lung zone involvement was modified in 213/6449 (3.3%) lung zones. Assessing the AI image influenced the zonal assessment of pathological rather than normal radiographs. Within the group of patients with COVID-19 pneumonia, assessing the AI image modified more frequently the assessment of lung zones for mild pneumonias (Brixia Score less than or equal to 9 points) than in severe pneumonia. This influence was always greater for the student group (>3% vs <1.5% of lung zones in the whole sample; >4% vs <2% in mild pneumonias). However, interpreting the AI image did not always improve the agreement with the gold standard, but worsened it in a similar proportion (Table 4).
Changes in lung zone involvement after the interpretation of the AI image, and effect on agreement with the reference standard.
| Agreement with reference standard after AI image assessment | Normal radiographs | Pathological radiographs | Pathological radiographs Brixia score ≤ 9 | Pathological radiographs Brixia score > 9 | |||||
|---|---|---|---|---|---|---|---|---|---|
| All readers | Improves | 62/3995 | (1.55%) | 58/2454 | (2.36%) | 53/1586 | (3.34%) | 5/868 | (0.58%) |
| Worsens | 37/3995 | (0.93%) | 56/2454 | (2.28%) | 43/1586 | (2.71%) | 13/868 | (1.50%) | |
| Students | Improves | 58/2352 | (2.47%) | 45/1433 | (3.14%) | 42/919 | (4.57%) | 3/514 | (0.58%) |
| Worsens | 31/2352 | (1.32%) | 47/1433 | (3.28%) | 37/919 | (4.03%) | 10/514 | (1.95%) | |
| Residents plus radiologists | Improves | 4/1643 | (0.24%) | 13/1021 | (1.27%) | 11/667 | (1.65%) | 2/354 | (0.56%) |
| Worsens | 6/1643 | (0.37%) | 9/1021 | (0.88%) | 6/667 | (0.90%) | 3/354 | (0.85%) | |
All lung zones were summed. Readers were grouped as students against residents plus radiologists.
Data are shown in absolute and relative frequencies.
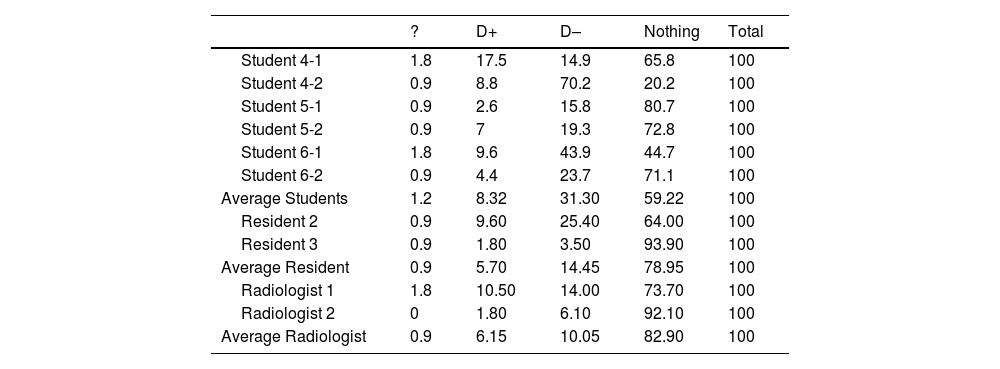
For the overall contribution of AI on average, the AI (a) resolved doubts 31.30%, 14.45% and 10.05%, (b) generated doubts in 8.32%, 5.70% and 6.15%, and (c) provide nothing in 59.22%, 78.95% and 82.90% for students, residents and radiologist, respectively (Table 5).
Frequency in percentages of opinion on “What the artificial intelligence has given me overall” in the interpretation of chest radiograph of patients with suspected COVID-19 pneumonia.
| ? | D+ | D– | Nothing | Total | |
|---|---|---|---|---|---|
| Student 4-1 | 1.8 | 17.5 | 14.9 | 65.8 | 100 |
| Student 4-2 | 0.9 | 8.8 | 70.2 | 20.2 | 100 |
| Student 5-1 | 0.9 | 2.6 | 15.8 | 80.7 | 100 |
| Student 5-2 | 0.9 | 7 | 19.3 | 72.8 | 100 |
| Student 6-1 | 1.8 | 9.6 | 43.9 | 44.7 | 100 |
| Student 6-2 | 0.9 | 4.4 | 23.7 | 71.1 | 100 |
| Average Students | 1.2 | 8.32 | 31.30 | 59.22 | 100 |
| Resident 2 | 0.9 | 9.60 | 25.40 | 64.00 | 100 |
| Resident 3 | 0.9 | 1.80 | 3.50 | 93.90 | 100 |
| Average Resident | 0.9 | 5.70 | 14.45 | 78.95 | 100 |
| Radiologist 1 | 1.8 | 10.50 | 14.00 | 73.70 | 100 |
| Radiologist 2 | 0 | 1.80 | 6.10 | 92.10 | 100 |
| Average Radiologist | 0.9 | 6.15 | 10.05 | 82.90 | 100 |
Abbreviations: AI: artificial intelligence;? : percentage of missed cases; D+: percentage of cases in which the AI has given me doubts; d-: percentage of cases in which the AI has resolved my doubts; Nothing: percentage of cases in which the AI has not contributed at all.
With respect to “Changing the first impression for probability of involvement of each lung zone”, the opinion of the three groups of readers was that, when the AI software influenced their self-confidence, it resolved their doubts more often than it generated them, especially in students, followed by residents and finally radiologists. The AI did not change the first impression of the readers in more than 89.03% of the cases (Supplementary tables 2a–2f).
DiscussionThe main results of this study can be summarised as follows: 1) In most case the opinion of the readers states that the AI does not change its opinion, but it resolved more doubts than those it generated. 2) The AI evaluation facilitate the students assessment of the “Probability of COVID-19 pneumonia”, improving the interobserver agreement with the gold standard for 4/6 students, and reducing the number of significant differences in diagnosis performance with the group of residents and radiologists. 3) The AI algorithm influenced readers' interpretation more often in radiographs with mild pneumonias than in severe or absent pneumonias, especially for students, although this change in interpretation does not always improve the agreement with the gold standard. 4) Finally, although different analyses support these contributions, no significant differences were found in most of the comparisons.
Our hypothesis assumed the beneficial effect of commercial AI software for all readers, but our results only support some benefits for medical students. The reasons for the discrepancies with published studies8–13 we believe lie in the AI software. In our case, unlike Deep Learning models from those research studies, which do show promising performance of AI alone11,12 or AI in support of radiologists8–10,13 versus radiologists alone, this is a commercial application software not trained for establishing the probability of COVID-19, but for the probability of basic lung lesions such as nodules or lung consolidations. Even so, the students, although in most cases they did not consider the software to change their opinion, when it influenced them, it allowed them to resolve rather than generate doubts. Most of them increased the agreements with the gold standard, two of them increased their diagnostic performance with its use and decrease the number of NSDDP of students and residents and radiologists. As for the influence of the algorithm depending on the severity of pneumonia, in normal radiographs, many of which will be detected as normal by the AI-processed image, the change in interpretation by the reader will be modest. In severe pneumonias, the greater number of affected areas and the greater degree of involvement facilitates the reader's interpretation, and an AI-processed image available will most likely not help either. In mild pneumonias there will be a more subtle and doubtful involvement, where the AI-processed image may have more influence on the interpretation, especially in less experienced readers. Currently commercial AI software has been trained on small parcels of knowledge. As our work highlights, this softwares can be useful in specific settings, always after validation and without assuming their usefulness in all circumstances, e.g. for both ruling out and confirming disease, or in any field of work, regardless of the user's level of experience. This work opens the door to the development of tools applicable on a large scale in the training of users with limited experience in reading chest radiographs, such as the large community of medical students or family physicians. It would be appropriate to set up working teams made up of participants from specific fields to focus the efforts and resources involved in developing IA tools towards specific and useful practical solutions.
Our study has some limitations. The final sample size was small, and the number of readers was not large enough to obtain results that would allow us to have solid data of these groups. In view of the high intra and interobserver agreement and diagnosis performance by radiograph assessment with no AI for the students included in this group, this may be the reason for not finding statistically significant differences in most comparisons. These students may not represent the student’s population of this University so it is not excluded that the software could have better results in inexperienced readers than this study has shown. On the other hand, it would have been optimal to include other specialists, since in work overload of Radiology Departments, they would often find themselves without support in reading chest radiographs. Using thoracic tomosynthesis as part of the gold standard could be considered a limitation due to its limited and unproven use. Although tomosynthesis is not equivalent to CT, it has been used in this study because of the better inter-observer agreement achieved for COVID-19 pneumonia compared to radiography.14 Finally, the AI tool used is not trained for reading chest radiographs with COVID-19 pneumonia, but it is still an available tool, unlike most of the experimental ones.
In conclusion, this untrained commercial AI tool for COVID-19 has shown no impact on the reading of chest radiographs of patients with suspected COVID-19 pneumonia in expert readers neither in those with lower experience The AI evaluation facilitates the assessment of the probability of COVID-19 pneumonia on the interpretation of inexperienced readers and in the face of mild pneumonia.
Authorship1. Responsible for the integrity of the study: JMPM, JMGS.
2. Study design: JMPM, JMGS.
3. Study design: JMPM, JMGS.
4. Data collection: MPL, JMPM, MSC, CJP, RRM, LME, CGH, DGG, PHM, LCC, EGG, MNPM, SMR, JGM.
5. Data analysis and interpretation: MPL, JMPM, JMGS.
6. Statistical processing: JMPM.
7. Bibliographic search: JMPM, MPL.
8. Writing of the paper: MPL, JMPM, JMGS.
9. Critical revision of the manuscript with intellectually relevant contributions: All of authors.
10. Approval of the final version: All of authors.
FundingThis research has not received specific support from public sector agencies, the commercial sector or non-profit organizations.
The following is Supplementary data to this article:

