


Botulinum toxin A (BTA) improves the kinematic parameters of gait in patients with spasticity of lower limbs, but there are no studies in which kinetic parameters are measured with instrumented insoles. We therefore used instrumented insoles to perform a functional assessment of therapeutic results in patients with lower limb spasticity after brain injury or spinal cord infiltration indicating BTA.
Material and methodsTen patients (11 lower limbs) were seen in a Neurorehabilitation Unit. The tests carried out included clinical examination, gait assessment (Functional Ambulation Categories (FAC); Hospital de Sagunto Gait Scale), and biomechanical assessment (Biofoot/IBV version 5.0), before and three weeks after infiltration with BTA. Statistics: t-test for related samples of clinical variables, functional variables and biomechanical variables before and after infiltration. Level of significance P<.05. Qualitative method was used to assess whether changes in the biomechanical variables tended towards normal values.
ResultsBTA improves muscle tone, joint arch and frequency of spasms (P<.01). The patient sample showed a high level of satisfaction with the improvement in symptoms. There were no changes in walking ability after injection. There were no statistically significant changes in biomechanical parameters, but there was improved gait cadence. The relatively small statistical significance close to P=.1 of the peak pressure in the heel after injection indicates the need for further studies with instrumented insoles in people with spasticity due to central nervous system injury.
ConclusionsWith the decrease in muscle tone after infiltration with BTA the clinical symptoms associated with muscle tone improved without any functional changes in gait scales. The changes in the biomechanical parameters show that larger studies using instrumented insoles should be performed in the population with spasticity after a central nervous system injury is treated with BTA infiltration.
El objetivo del presente trabajo es la valoración funcional y cinemática en pacientes con espasticidad de miembros inferiores tras lesión encefálica o medular con indicación de infiltración con toxina botulínica (TBA).
Material y métodosDiez pacientes (11 extremidades inferiores) atendidos en unidad de neurorrehabilitación. Examen clínico, funcional (functional ambulation categories, valoración marcha del Hospital de Sagunto) y biomecánico (plantillas instrumentadas Biofoot/IBV versión 5,0) antes y 3 semanas después de la infiltración con TBA. Estadísticos: prueba de la t para muestras relacionadas de las variables clínicas, funcionales y biomecánicas antes y después de la infiltración. Nivel de significación inferior a 0,05. Modo cualitativo para valorar si los cambios en las variables biomecánicas orientan a una aproximación a los parámetros de normalidad.
ResultadosLa infiltración con TBA mejora el tono muscular, el arco articular y la frecuencia de espasmos (p < 0,01). La población infiltrada muestra un nivel alto de satisfacción con la mejora de los síntomas. No hay cambios funcionales en habilidad para la marcha tras la infiltración. En los parámetros biomecánicos mejora de la cadencia de marcha y la presión máxima en retropié se aproxima a la significación estadística cercana a 0,1.
ConclusionesCon la disminución del tono muscular tras infiltración con TBA, mejoran los síntomas clínicos derivados de esta sin cambios funcionales en escalas de marcha. Los cambios en los parámetros biomecánicos indican la necesidad de ampliar los estudios con plantillas instrumentadas en población con espasticidad tras lesión del sistema nervioso central tratada con infiltración de TBA.
Spasticity is a motor disorder characterised by velocity-dependent hyperactivity of the myotatic reflex arc. It manifests as an increase in muscular resistance to stretching (tonic stretch reflex) and exaggeration of deep tendon reflexes1 as a result of pyramidal tract dysfunction. It is associated with muscle weakness and loss of movement selectivity (synkinesia).
The most frequent causes of spasticity in adults are acquired brain damage and spinal cord injury (SCI). Spasticity primarily affects the antigravity muscle groups and tends to appear from proximal to distal muscles. Common spasticity distribution patterns depend on the underlying neurological disease: in hemiplegia secondary to stroke, the lower limb normally remains extended with a talipes equinovarus. In SCI and multiple sclerosis, the most common pattern is flexion and abduction of the lower limbs.2
When managing a case of spasticity, we must first determine the purpose of making measurements and the context in which this will be done.
Objectives in treating spasticity include achieving functional improvement (increasing ability to change postures and walk, improving reach and dexterity, facilitating correct posture, and using orthotics), reducing symptoms (spasm frequency, pain relief, spasm prevention, improving personal image), and optimising other treatments and services.
Different treatment methods are used to control spasticity, including pharmacological treatments considered adjuvant to physical therapy and posture correction. When targeting specific muscle groups (in focal spasticity), serial casting, orthotics, and neuromuscular blockade are indicated. Neuromuscular blockade methods include local anaesthetic nerve block, phenol and alcohol blocks, and botulinum toxin, which is the current drug of choice.
Using repeatable3 and reliable measurement tools when diagnosing and monitoring changes in different diseases allows us to detect the small deviations that distinguish normal patterns from pathological ones, plus any responses to the treatments in use. One such tool is the instrumented insole system. Its main feature is its ability to measure plantar pressure during walking by using stationary pressure sensors or transducers attached to the base of a flexible insole which is placed inside the shoe of the subject being studied. The data it generates are transmitted to a computer with special software for processing those data. Since the tool is portable and easy to install, it is widely used in clinics.
Few studies using instrumented insoles describe pressure distribution in the hemiplegic population. Kinetic studies generally mention another type of measurement tool, the dynamometric platform.4 We found no articles reporting use of this method to study the variations in plantar pressure that may be caused by botulinum toxin injections.
The purpose of this study is to determine the effectiveness of botulinum toxin treatment in patients with lower limb spasticity following a brain or spinal cord injury by using clinical examination, functional gait assessment scales, and instrumented insoles. The documented portability and usefulness of these insoles will help us evaluate any changes in plantar support parameters which may be evoked by BT injections in spastic leg muscles during the drug's duration of action.
Material and methodsSubjectsPatients who had suffered different types of brain or spinal cord injuries and were attended in a neuro-rehabilitation unit. All displayed subacute or chronic spasticities in the lower limbs.
LocationNeuro-rehabilitation unit, Hospital La Magdalena, Castellón, Spain.
Inclusion criteria- –
Patients aged 18 years and older.
- –
Spasticity in 1 or 2 legs following injury to the brain or spinal cord.
- –
Talipes equinovarus with or without spasticity in adductor muscles and hyperextension of the hallux.
- –
Course of the injury: subacute or chronic.
- –
Patient monitoring: in-hospital or outpatient.
- –
No cognitive deficiencies.
- –
Signed informed consent statement.
- –
Paediatric age.
- –
Presence of cognitive or behavioural disorders.
- –
Presence of peripheral nerve injury.
- –
Clinical instability.
- 1.
Clinical assessment
- a.
Clinical spasticity assessment scale:
- b.
Assessment of passive range of motion using conventional goniometry for the joint or joints in question, depending on the spasticity pattern observed (hip, knee, ankle).
- c.
Assessment of strength of affected leg muscles using the Medical Research Council (MRC) scale,7 depending on the spasticity pattern observed.
- a.
- 2.
Functional gait assessment
- 3.
Instrumented gait assessment: Biofoot/IBV instrumented insoles, version 5.0. The system consists of two flexible polyester insoles measuring 0.5mm thick and containing 64 piezoelectric sensors, each of which measures 5mm in diameter. Each insole is connected to its own amplifier, which is located in a box strapped to the patient's ankle with Velcro tape. The amplifiers are connected with cables to a transmission module attached to the patient's waist. This module uses digital telemetry to send the data to a computer. Data sent by the insoles may be viewed as pressure maps or digital images with different formats, two- or three-dimensional graphical displays, or parameters. All measurements are taken with the subject walking a corridor 15m long. Insoles were placed in the patient's own shoes. Patients who used orthoses for equinovarus deformities were asked to remove them because they would invalidate the pressure measurements. Patients were permitted to use their habitual assisted walking devices (single canes, walkers, etc.) (Fig. 1). The patient was instructed to walk down the corridor at a comfortable pace during each session.
A minimum number of measurements (normally 2) were taken to ensure that data were gathered correctly since walking cadence is typically slow to very slow in these patients. For that reason, our sampling frequency was 100Hz and measuring time was 15seconds. This recording allowed us to record data from 5 to 7 steps per foot. Fig. 2 shows a graph of the data obtained using the insoles in a single session.
We calculated the mean of each patient's 5 to 7 steps in order to establish that patient's average step. This average step was then exported to the database. For purposes of calculating pressures by zone, the foot was divided into 3 anatomical regions: the forefoot, midfoot, and heel.
- 4.
Additional data:
- a.
Evaluation of the patient's degree of satisfaction with regard to subjective benefit provided by treatment with botulinum toxin injections using an adaptation of the FACES pain scale.10 This scale shows 6 faces with different expressions ranging from a wide smile to a grimace of severe pain. Each is assigned to an even ordinal number. The happiest face corresponds to the maximum score (10) and the anguished face corresponds to a score of 0. Scores higher than the arithmetic mean (6 points) are considered good, and 90% of our study cases reported good scores.
- b.
Consumption of medications that may affect muscle tone.
- a.

: pressure sensors; maximum pressures; forces; isobars.")
During the first evaluation of BT injection as a treatment option, the patient signed an informed consent statement, completed an initial study using instrumented insoles, and received an injection with BT all in the same session.
The patient underwent another clinical, functional, and biomechanical assessment 3 weeks after the injection. At this time, patients were asked to describe their level of satisfaction.
Toxin used in treatmentBotulinum toxin type A (BTA): Dysport® or Botox®. The toxin's commercial preparation and dosage, and the muscles receiving injections were recorded on the patient's personal data sheet. According to standard instructions, Dysport® toxin was diluted in 2.5ml saline solution and Botox® toxin was diluted in 2ml saline solution. The toxin was injected using electromyography (EMG) so as to confirm the exact muscular location.
Processing of clinical dataFor easy comprehension of data having to do with articular balance or muscle balance, readings for articular balance were categorised as either deficient or not deficient with respect to normal values for the affected joint or joints. To evaluate muscle strength, we used the arithmetic sum of the muscle balance for the affected muscles in each of the patients: hip flexors and adductors, knee extensors, dorsiflexors and invertors of the foot, extensor and flexor of the hallux, and the flexor digitorum brevis.
Statistical method- 1.
Descriptive analysis of variables:
- a.
Clinical variables: spasticity assessment (modified Ashworth scale, spasm frequency, and hip adductor tone); articular balance; muscle balance.
- b.
Functional variables (gait scales): FAC, HSGS.
- c.
Additional data (degree of satisfaction; medications consumed).
- a.
- 2.
Paired samples t test to compare means of listed variables before and after injection. Applied to:
- a.
Clinical variables
- b.
Functional variables
- c.
Biomechanical variables,
- –
Spatial–temporal variables: walking cadence, stance phase for each foot.
- –
Kinetic variables: maximum pressure (MP) on forefoot for each foot (normal/affected); MP on midfoot for each foot (normal/affected); MP on heel for each foot (normal/affected); mean maximum pressure (MMP) on forefoot for each foot (normal/affected); MMP on midfoot for each foot (normal/affected); MMP on heel for each foot (normal/affected);
- –
- a.
- 3.
We used the qualitative method to determine whether any changes in biomechanical variables after botulinum toxin injection caused patients’ values to tend towards the normal parameters recorded in the literature.
Values of P<.05 were considered statistically significant. We used SPSS version 15.0 for statistical analysis.
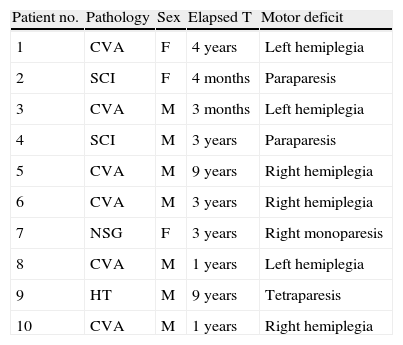
ResultsDescription of the sampleClinical variablesBT injections were administered to 10 patients in a total of 11 lower limbs; patients comprised 7 men and 3 women with an age range of 30 to 69 years (mean: 52.9 years). Mean age in men was 51 years and mean age in women was 57 years (Table 1). The cause of the injury was cerebrovascular accident in 6 patients; spinal cord injury in 2 patients; head trauma in 1 patient; and neurosurgery (for meningioma) in 1 patient.
Clinical characteristics of the study sample.
| Patient no. | Pathology | Sex | Elapsed T | Motor deficit |
| 1 | CVA | F | 4 years | Left hemiplegia |
| 2 | SCI | F | 4 months | Paraparesis |
| 3 | CVA | M | 3 months | Left hemiplegia |
| 4 | SCI | M | 3 years | Paraparesis |
| 5 | CVA | M | 9 years | Right hemiplegia |
| 6 | CVA | M | 3 years | Right hemiplegia |
| 7 | NSG | F | 3 years | Right monoparesis |
| 8 | CVA | M | 1 years | Left hemiplegia |
| 9 | HT | M | 9 years | Tetraparesis |
| 10 | CVA | M | 1 years | Right hemiplegia |
CVA: cerebrovascular accident; SCI: spinal cord injury; NSG: neurosurgery; HT: head trauma.
Focal neurological deficits corresponded to left hemiplegia in 4 cases; right hemiplegia in 3 cases; paraparesis in 2 patients; and impairment in all 4 limbs in 1 patient. Elapsed time between disease onset and the time of the study was variable, ranging from 9 years (1 patient) to 3 months (2 patients, who were still hospitalised and undergoing neuro-rehabilitation at the time of the study).
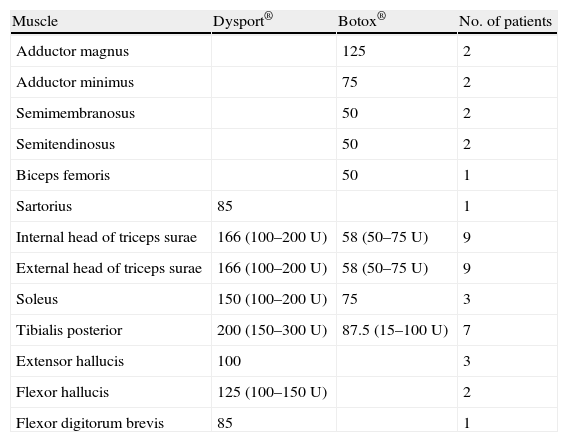
Dysport® toxin was used in 6 patients (7 limbs) and Botox® toxin in the remaining 4 patients. Doses of both brands of toxin were calculated for each patient depending on the degree of hypertonia and the muscles involved. Table 2 lists the muscles receiving injections, the doses used, and the number of patients receiving injections to the specified muscles.
Description of muscles receiving injections and mean toxin dose.
| Muscle | Dysport® | Botox® | No. of patients |
| Adductor magnus | 125 | 2 | |
| Adductor minimus | 75 | 2 | |
| Semimembranosus | 50 | 2 | |
| Semitendinosus | 50 | 2 | |
| Biceps femoris | 50 | 1 | |
| Sartorius | 85 | 1 | |
| Internal head of triceps surae | 166 (100–200U) | 58 (50–75U) | 9 |
| External head of triceps surae | 166 (100–200U) | 58 (50–75U) | 9 |
| Soleus | 150 (100–200U) | 75 | 3 |
| Tibialis posterior | 200 (150–300U) | 87.5 (15–100U) | 7 |
| Extensor hallucis | 100 | 3 | |
| Flexor hallucis | 125 (100–150U) | 2 | |
| Flexor digitorum brevis | 85 | 1 |
Mean dose of toxin administrated by commercial brand. In parentheses: minimum and maximum amount of toxin for each treated muscle. Dilution: Dysport® toxin was diluted in 2.5ml saline solution and Botox® toxin was diluted in 2ml saline solution.
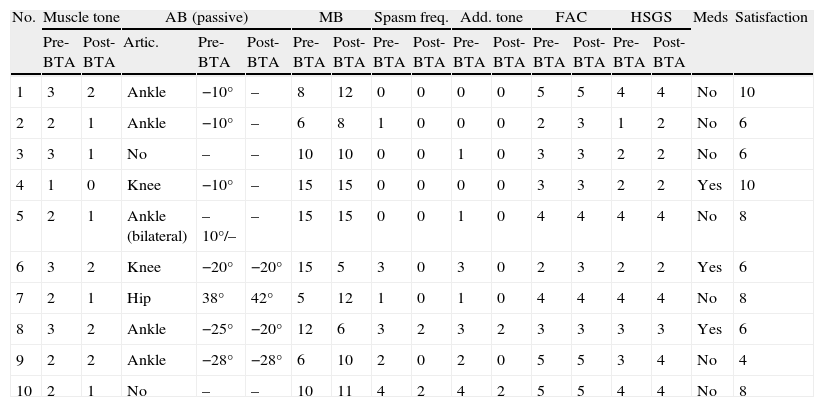
Clinical examination data that were included in the protocol designed for the pre-injection study and for the study 3 weeks after the injection are shown in Table 3. The mean muscle tone value measured on the modified Ashworth scale for the sample studied prior to BT injection was 2.1 (2–3); 3 weeks after injection, it was 1.2 (1–2).
Clinical characteristics of the sample before and after administration of BTA.
| No. | Muscle tone | AB (passive) | MB | Spasm freq. | Add. tone | FAC | HSGS | Meds | Satisfaction | ||||||||
| Pre-BTA | Post-BTA | Artic. | Pre-BTA | Post-BTA | Pre-BTA | Post-BTA | Pre-BTA | Post-BTA | Pre-BTA | Post-BTA | Pre-BTA | Post-BTA | Pre-BTA | Post-BTA | |||
| 1 | 3 | 2 | Ankle | −10° | – | 8 | 12 | 0 | 0 | 0 | 0 | 5 | 5 | 4 | 4 | No | 10 |
| 2 | 2 | 1 | Ankle | −10° | – | 6 | 8 | 1 | 0 | 0 | 0 | 2 | 3 | 1 | 2 | No | 6 |
| 3 | 3 | 1 | No | – | – | 10 | 10 | 0 | 0 | 1 | 0 | 3 | 3 | 2 | 2 | No | 6 |
| 4 | 1 | 0 | Knee | −10° | – | 15 | 15 | 0 | 0 | 0 | 0 | 3 | 3 | 2 | 2 | Yes | 10 |
| 5 | 2 | 1 | Ankle (bilateral) | –10°/– | – | 15 | 15 | 0 | 0 | 1 | 0 | 4 | 4 | 4 | 4 | No | 8 |
| 6 | 3 | 2 | Knee | −20° | −20° | 15 | 5 | 3 | 0 | 3 | 0 | 2 | 3 | 2 | 2 | Yes | 6 |
| 7 | 2 | 1 | Hip | 38° | 42° | 5 | 12 | 1 | 0 | 1 | 0 | 4 | 4 | 4 | 4 | No | 8 |
| 8 | 3 | 2 | Ankle | −25° | −20° | 12 | 6 | 3 | 2 | 3 | 2 | 3 | 3 | 3 | 3 | Yes | 6 |
| 9 | 2 | 2 | Ankle | −28° | −28° | 6 | 10 | 2 | 0 | 2 | 0 | 5 | 5 | 3 | 4 | No | 4 |
| 10 | 2 | 1 | No | – | – | 10 | 11 | 4 | 2 | 4 | 2 | 5 | 5 | 4 | 4 | No | 8 |
AB: articular balance (note that knee and ankle scores are shown as negative figures with respect to normal values, and hip scores as degrees of passive range of motion in abduction); MB: muscle balance (arithmetic sum of muscles involved in spasticity patterns); HSGS: Hospital de Sagunto Gait Scale; FAC: Functional Ambulation Categories; spasm freq.: spasm frequency; meds: consumption of medications that decrease muscle tone; No.: patient number; satisf.: level of satisfaction according to modified FACES scale; add. tone: adductor tone rating.
Passive range of motion was limited due to spasticity in the ankle in 5 patients, in the knee in 2 patients, and in the hip in 1 patient. Two patients experienced no limitations in passive range of motion in the lower limbs. The mean value for articular restriction was 14.63° (0°–38°) prior to the injection and 9.09° after the injection (0°–42°). This means that articular balance for passive mobilisation became less restricted in 6 cases; range of motion remained unchanged in 5 cases (including those with no movement restrictions).
The muscle balance score shown in Table 3 corresponds to the arithmetic sum of the muscles affected by spasticity patterns (0–5); prior to the injection, the mean motor score in the study population was 8.9, and after the injection it was 9.5. Prior to the injection, 6 patients suffered spasms; 3 weeks after the injection, only 2 patients continued to suffer spasms, but their frequency and intensity had decreased (level 2 on the spasm scale).
For all limbs in which hypertonia was measured in the hip adductor muscles (7 cases), hypertonia decreased after injection, reaching normal levels in 5 cases. In the 2 cases in which the spasticity pattern was dominant (the 2 cases of SCI), tone improved after the injection but did not reach normal levels.
Functional variablesMean scores on the scales assessing gait were similar before and after BT injection: FAC pre-BTA: 3.6; FAC post-BTA: 3.8. HSGS pre-BTA: 2.9; HSGS post-BTA: 3.1.
Additional informationThree patients were taking medications that reduce muscle tone (antiepileptic agents in 2 cases and oral baclofen in 1 case). The mean score for patients’ level of satisfaction measured with the modified FACES scale was 7.2 (0–10).
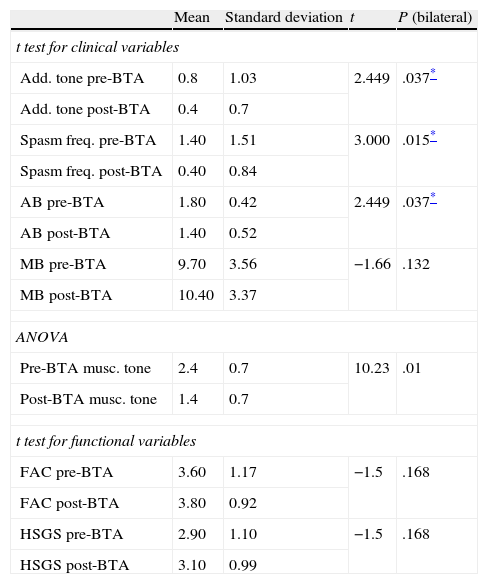
Paired sample t testStatistical analysis of the influence of botulism toxin on clinical variables (Table 4)We compared the following variables before and after botulinum toxin treatment: adductor muscle tone, spasm frequency, and pre/post-injection articular and muscle balance. To this end, we used the t test for paired samples. We were unable to use the t test for paired samples in the specific case of pre-injection and post-injection muscle tone since typical deviation of these differences was zero. Instead, we used an ANOVA study to analyse the above variables (Table 4).
Paired sample t test for clinical and functional variables ANOVA test for factor of treatment.
| Mean | Standard deviation | t | P (bilateral) | |
| t test for clinical variables | ||||
| Add. tone pre-BTA | 0.8 | 1.03 | 2.449 | .037* |
| Add. tone post-BTA | 0.4 | 0.7 | ||
| Spasm freq. pre-BTA | 1.40 | 1.51 | 3.000 | .015* |
| Spasm freq. post-BTA | 0.40 | 0.84 | ||
| AB pre-BTA | 1.80 | 0.42 | 2.449 | .037* |
| AB post-BTA | 1.40 | 0.52 | ||
| MB pre-BTA | 9.70 | 3.56 | −1.66 | .132 |
| MB post-BTA | 10.40 | 3.37 | ||
| ANOVA | ||||
| Pre-BTA musc. tone | 2.4 | 0.7 | 10.23 | .01 |
| Post-BTA musc. tone | 1.4 | 0.7 | ||
| t test for functional variables | ||||
| FAC pre-BTA | 3.60 | 1.17 | −1.5 | .168 |
| FAC post-BTA | 3.80 | 0.92 | ||
| HSGS pre-BTA | 2.90 | 1.10 | −1.5 | .168 |
| HSGS post-BTA | 3.10 | 0.99 | ||
AB: articular balance (note that knee and ankle scores are shown as negative figures with respect to normal values; hip scores are shown as degrees of passive range of motion in abduction); HSGS: Hospital de Sagunto Gait Scale; FAC: Functional Ambulation Categories; spasm freq.: spasm frequency; add. tone: adductor tone rating; musc. tone: muscle tone.
The results point to significant differences between the mean values of all of the variables except for muscle balance (P=.132). The statistical significance level is less than .01 for the variable “decreased muscle tone”. Statistical significance level is <.05 for the following: adductor muscle (P=.037), spasm frequency (P=.015) and articular balance in passive mobilisation (P=.037).
Statistical analysis of the influence of botulism toxin on functional variables (Table 4)For functional variables (FAC, HSGS) the t test for paired samples did not show significant differences before and after toxin injection. Interestingly enough, the results are the same according to both the FAC and the HSGS scales (P=.168)
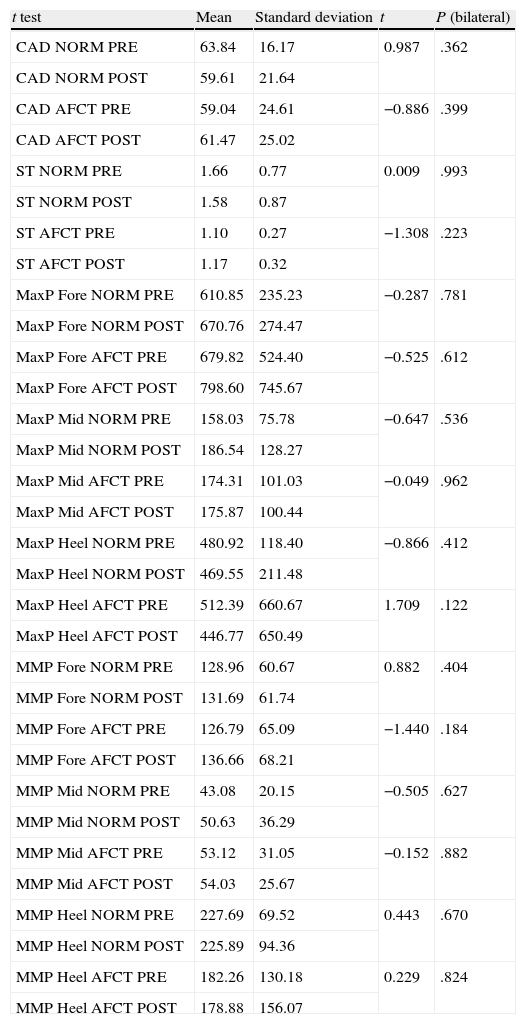
Statistical analysis of the influence of BTA on biomechanical variables (Table 5)Spatial–temporal variables: stance phase and cadenceAs is to be expected, the movements of the normal foot and the affected foot are asymmetrical, so the stance phase for the normal foot is longer than that for the affected foot. Following injection with BTA, the stance phase for the normal foot decreases slightly and the stance phase for the affected foot increases accordingly (Fig. 3). However, these differences are not statistically significant and gait remains asymmetrical (P=.993) for the normal foot; P=.223 for the affected foot. The cadence data also shows asymmetry between the two lower limbs in our study sample. Before toxin is injected, the normal limb displays a faster gait cycle (63.84steps/min) than the affected limb (59.04steps/min) (Table 5). At 3 weeks after the injection, the gait cycle for the affected foot was faster than the other (61.47steps/min vs 59.61steps/min) (Table 5).
 compared with those in the healthy population (left). Right feet in the healthy population were randomly selected for comparison with normal feet in patients (blue bars), and left feet with affected feet in patients (black bars).")
Graph of spatial–temporal biomechanical variables: stance time and cadence for normal and affected feet before and after BTA injections (right) compared with those in the healthy population (left). Right feet in the healthy population were randomly selected for comparison with normal feet in patients (blue bars), and left feet with affected feet in patients (black bars).
Paired sample t test for biomechanical variables.
| t test | Mean | Standard deviation | t | P (bilateral) |
| CAD NORM PRE | 63.84 | 16.17 | 0.987 | .362 |
| CAD NORM POST | 59.61 | 21.64 | ||
| CAD AFCT PRE | 59.04 | 24.61 | −0.886 | .399 |
| CAD AFCT POST | 61.47 | 25.02 | ||
| ST NORM PRE | 1.66 | 0.77 | 0.009 | .993 |
| ST NORM POST | 1.58 | 0.87 | ||
| ST AFCT PRE | 1.10 | 0.27 | −1.308 | .223 |
| ST AFCT POST | 1.17 | 0.32 | ||
| MaxP Fore NORM PRE | 610.85 | 235.23 | −0.287 | .781 |
| MaxP Fore NORM POST | 670.76 | 274.47 | ||
| MaxP Fore AFCT PRE | 679.82 | 524.40 | −0.525 | .612 |
| MaxP Fore AFCT POST | 798.60 | 745.67 | ||
| MaxP Mid NORM PRE | 158.03 | 75.78 | −0.647 | .536 |
| MaxP Mid NORM POST | 186.54 | 128.27 | ||
| MaxP Mid AFCT PRE | 174.31 | 101.03 | −0.049 | .962 |
| MaxP Mid AFCT POST | 175.87 | 100.44 | ||
| MaxP Heel NORM PRE | 480.92 | 118.40 | −0.866 | .412 |
| MaxP Heel NORM POST | 469.55 | 211.48 | ||
| MaxP Heel AFCT PRE | 512.39 | 660.67 | 1.709 | .122 |
| MaxP Heel AFCT POST | 446.77 | 650.49 | ||
| MMP Fore NORM PRE | 128.96 | 60.67 | 0.882 | .404 |
| MMP Fore NORM POST | 131.69 | 61.74 | ||
| MMP Fore AFCT PRE | 126.79 | 65.09 | −1.440 | .184 |
| MMP Fore AFCT POST | 136.66 | 68.21 | ||
| MMP Mid NORM PRE | 43.08 | 20.15 | −0.505 | .627 |
| MMP Mid NORM POST | 50.63 | 36.29 | ||
| MMP Mid AFCT PRE | 53.12 | 31.05 | −0.152 | .882 |
| MMP Mid AFCT POST | 54.03 | 25.67 | ||
| MMP Heel NORM PRE | 227.69 | 69.52 | 0.443 | .670 |
| MMP Heel NORM POST | 225.89 | 94.36 | ||
| MMP Heel AFCT PRE | 182.26 | 130.18 | 0.229 | .824 |
| MMP Heel AFCT POST | 178.88 | 156.07 |
CAD AFCT POST cadence affected side after BTA; CAD AFCT PRE: cadence affected side before BTA; CAD NORM POST: cadence normal side after BTA; CAD NORM PRE; cadence normal side before BTA; ST AFCT POST: stance time affected side after BTA; ST AFCT PRE: stance time affected side before BTA; ST NORM POST: stance time normal side after BTA; ST NORM PRE: stance time normal side before BTA; MaxP Fore AFCT POST: maximum pressure forefoot affected side after BTA; MaxP Fore AFCT PRE: maximum pressure forefoot affected side after BTA; MaxP Fore NORM POST: maximum pressure forefoot normal side after BTA; MaxP Fore NORM PRE: maximum pressure forefoot normal side before BTA; MaxP Mid AFCT POST: maximum pressure midfoot affected side after BTA; MaxP Mid NORM POST: maximum pressure midfoot normal side after BTA; MaxP Mid AFCT PRE: maximum pressure midfoot affected side before BTA; MaxP Mid NORM PRE: maximum pressure midfoot normal side before BTA; MaxP Heel AFCT POST: maximum pressure heel affected side after BTA; MaxP Heel AFCT PRE: maximum pressure heel affected side before BTA; MaxP Heel NORM POST: maximum pressure heel normal side after BTA; MaxP Heel NORM PRE: maximum pressure heel normal side before BTA; MMP Fore AFCT POST: mean maximum pressure forefoot affected side after BTA; MMP Fore AFCT PRE: mean maximum pressure forefoot affected side before BTA; MMP Fore NORM POST: mean maximum pressure forefoot normal side after BTA; MMP Fore NORM PRE: mean maximum pressure forefoot normal side before BTA; MMP Mid AFCT POST: mean maximum pressure midfoot affected side after BTA; MMP Mid AFCT PRE: mean maximum pressure midfoot normal side; MMP Mid NORM POST: mean maximum pressure midfoot normal side after BTA; MMP Mid NORM PRE: mean maximum pressure midfoot normal side before BTA; MMP Heel AFCT POST: mean maximum pressure heel affected side after BTA;MMP Heel AFCT PRE: mean maximum pressure heel affected side before BTA; MMP Heel NORM POST: mean maximum pressure heel normal side after BTA; MMP Heel NORM PRE: mean maximum pressure heel normal side before BTA.
Before the toxin injection, the highest MP was found in the forefoot, followed by the heel, and last of all in the midfoot on both the normal and the affected sides (Fig. 4A). Three weeks after the toxin injection, MP measurements in the normal foot followed the same pattern with an increase in the mean values registered in the forefoot and in the midfoot and a decrease in MP on the heel. These differences are not statistically significant (forefoot: P=.781; heel: P=.412; midfoot: P=.536). For the affected foot, MP continued to follow the same pressure ranking after the injection: forefoot (increased), heel (decreased) and midfoot (increased). However, the differences were more marked in the forefoot and heel, while variations in the midfoot were slight. The t test shows that differences between mean MP in the affected foot before and after toxin injection were not statistically significant (forefoot: P=.612; midfoot: P=.962). However, we should note that the difference in MP in the heel on the affected side approaches 0.1 (P=.122) (Table 5).
 Maximum pressure. (B) Mean peak pressure. The left-hand column represents the normal foot and the right-hand column represents the affected foot. Units: kPa. The directionality of each segment (ascending or descending) represents either an increase or decrease in pressure in each area of the foot (forefoot, midfoot, heel) after BTA injection.")
Graph of pressure measurements recorded before and after treatment. (A) Maximum pressure. (B) Mean peak pressure. The left-hand column represents the normal foot and the right-hand column represents the affected foot. Units: kPa. The directionality of each segment (ascending or descending) represents either an increase or decrease in pressure in each area of the foot (forefoot, midfoot, heel) after BTA injection.
Pressure distribution for the variable MMP was as follows: heel, forefoot, and midfoot for both feet. Prior to injecting the toxin, the mean MMPs in the forefoot and in the midfoot were similar in normal and affected feet (Table 5 and Fig. 4B). However, MMP measured in the heel of the normal foot was much higher than that sustained by the heel of the affected foot (227.69kPa and 182.26kPa, respectively). Following injection of toxin, the MMP distribution throughout the 3 zones of both the normal and the affected foot retained the same order (heel, forefoot, and midfoot). There were few changes in mean values, meaning that differences were not statistically significant (Table 5). However, as we saw with MP values, the differences were more pronounced on the affected side than on the normal side following BTA (Table 5 and Fig. 4B). Mean values displayed a descending tendency for the heel and an ascending tendency for the forefoot and the midfoot in both the normal and the affected feet.
DiscussionThe initial purpose of our study was to examine the effect of botulinum toxin injections on the clinical, functional, and biomechanical gait patterns in patients with lower limb spasticity arising from brain or spinal cord injury. As might be expected, BTA injections caused noticeable changes in clinical and biomechanical variables, but these changes have different degrees of statistical significance that must be evaluated according to the sample size.
Clinical and functional variablesThe benefits of botulinum toxin for treating focal spasticity have been thoroughly studied in the literature. BTA has been clearly shown to effectively decrease muscle tone in spastic muscles, consequently increasing the articulation's passive range of motion and improving the subject's walking ability.6–8,11,12 Meta-analyses of double-blind randomised studies comparing placebos and BTA conclude that this technique can be used to control spasticity following a stroke.13 BTA is also useful for improving pain and disability arising from lower limb spasticity in patients with SCI.14
Our results are similar to data found in the literature. While we only studied 10 patients (11 affected lower limbs), we observed statistically significant differences in articular balance, muscle tone, spasm frequency, and adductor muscle tone. As it was to be expected, no significant differences were found in the muscular balance of limbs in our study due to the toxin's action mechanism and weakness of the paretic muscles.
According to different authors, the concept of walking ability covers a number of factors including walking speed,11,12 energy expenditure,12 use of walking aids,13 and the patient's subjective evaluation. We opted for using 2 validated gait scales, the FAC and the HSGS, as an objective method for evaluating walking ability following BTA injections. Data obtained in our study showed no changes on either of the scales. This may be due to the small sample size and the fact that walking patterns in most of the patients are well-established due to the time elapsed since onset of their conditions. These results are coherent with results from preliminary studies in which no changes were observed on standard ordinal gait scales.15
When assessing the clinical and functional benefits of botulinum toxin injections, it is widely accepted that a personal objective for the patient should be established by agreement among healthcare professionals, patients, and caregivers.13,16 With this in mind, we arbitrarily decided to use a qualitative scale in order to evaluate patients’ opinions as a source of complementary data, although this fell outside the scope of the study. The FACES scale was designed so that patients could use an intuitive approach to assessing their pain level. It is compatible with our objectives and can be used by patients with severe language deficiencies. By applying this scale, we have been able to verify the good results of BTA use in terms of subjective satisfaction, with 90% of our patients expressing satisfaction (FACES scale≥6). Since measuring patient satisfaction was an arbitrary choice, we did not investigate any statistical correlations.
Although 2 types of toxin with differing degrees of diffusibility were used in the study, we do not consider this a data skew. Toxin preparations were diluted as much as possible according to their containers, each patient received only one brand of toxin, and the second measurement taken with the insoles took place after sufficient time had passed to observe any benefits of treatment. On the other hand, using EMG to guide injections is a technique that ensures greater proximity to the motor end plate than if the injection site is located using only anatomical reference points. This fact compensates for any differences between the 2 brands of toxin.17
Biomechanical variablesWhen performing biomechanical gait analysis, we differentiate between kinematic studies (involving angular values) and kinetic studies (involving ground reaction force). The variables under study are stance time and cadence, which are spatial–temporal characteristics of the gait cycle.18 Recent studies have shown improvements in other kinematic variables not included in our study following use of botulinum toxin.19,20
Instrumented insoles are accepted as a reliable, repeatable procedure for evaluating plantar pressure in the normal population.21 Few studies using this measurement system have been carried out in the hemiplegic population; such studies tend to employ other methods (dynamometric platforms).4 We found no articles reporting use of this method for the purpose of studying the variations in plantar pressure that may be caused by botulinum toxin injections. Instrumented insoles measure a number of biomechanical parameters, but we selected those with the most references in the literature.
Spatial–temporal variables in the gait cycle (Table 5 and Fig. 3)In hemiplegic patients (Table 5) stance time on the normal foot is double and cadence is approximately half of the values recorded in the normal population (115steps/min).22 Gait is asymmetrical between the normal foot and the affected foot. Numerous studies demonstrate an increase in walking speed in subjects with a range of different pathologies after BTA injections.11,19,23 However, the difference in our sample was not statistically significant.
Kinetic variablesOur study of kinetic variables cannot be compared to earlier studies because they were carried out using a different measurement system (dynamometric platforms). To that end, we will analyse our data based on the differences between values measured before and after toxin treatment. We will also compare them with data from the healthy population evaluated qualitatively. In the study of MPs, we observed that the pressure distribution pattern coincided with that of the healthy population, although mean values were naturally different (Table 5 and Fig. 4A).21,24,25 The differences between MP values between the normal and the affected foot increased in both the forefoot and the heel after the injection. Since they were not statistically significant, however, we were unable to draw conclusions. We would like to point out that the difference in the MP in the heel of the affected foot approached a significance level of 0.1 (P=.122). This means that statistically significant differences would probably appear given a larger sample size.
There were few changes in pressure distribution among the different areas of the foot after BTA injection (Table 5 and Fig. 4B), and we can therefore state that BTA barely caused modifications in MP in the feet of the study population. The differences found in analogous regions of each subject's feet do not permit us to draw any conclusions. If we compare our data to those reported by Martínez Nova et al.21 in a healthy population, we observe that the values for the forefoot and midfoot tend to approach normal values, while this is not true for the heel. Once again, these results should be interpreted cautiously due to the disparity and near lack of data in the literature, and to the small sample size in our study.
Conclusions- –
The results of this study support the utility of botulinum toxin for decreasing tone in targeted muscles, improving passive range of motion, and reducing spasm frequency in patients with spasms caused by different processes.
- –
There were no changes in walking ability after BTA injection in our sample according to functional walking scale measurements.
- –
There were no statistically significant changes in spatial–temporal or kinetic variables after treatment, although changes in MP in the heel of the affected foot did tend towards the statistical significance level.
Our results indicate a need for a more in-depth gait analysis after botulinum toxin treatment, using kinetic methods such as instrumented insoles. Instrumented insoles are portable and user-friendly even in subjects with severe muscle tone alterations due to central nervous system injury.
Conflicts of interestThe authors have no conflicts of interest to declare.
We would like to thank the ORTOPRONO orthopaedic clinic for their assistance with the technical aspects of our study.
Please cite this article as: Béseler MR, et al. Valoración de la marcha mediante plantillas instrumentadas en pacientes con espasticidad de miembros inferiores tras infiltración con toxina botulínica. Neurología. 2012;27:519–30.
