


Despite improved survival rates, stroke represents an increasing healthcare and socioeconomic burden. We describe the main characteristics of patients with ischaemic stroke and resource use and associated expenditure one year before and 3 years after stroke, using a population-based dataset.
MethodsThe information technology systems of the Catalan Health Service were used to identify patients with ischaemic strokes occurring between January 2012 and December 2016. For each patient, information from one year before the stroke and up to 3 years thereafter was linked across databases. We describe annual and monthly resource use and healthcare expenditure per patient.
ResultsWe identified 36 044 patients with ischaemic stroke (mean age, 74.7 ± 13.3 years). The survival rate at 3 years was 63%. Average expenditure per patient was €3230 the year before stroke, €11 060 for year 1 after stroke, €4104 for year 2, and €3878 for year 3. The greatest determinants of cost in year 1 were hospitalisation (including initial hospitalisation), representing 45% of the difference in expenditure compared to the previous year, and convalescence and rehabilitation services, representing 33% of this difference. After year one, the increase in expenditure was mainly determined by additional hospital admissions and drug treatment.
ConclusionAfter ischaemic stroke, healthcare expenditure increases primarily because of initial hospitalisation. After year one, the expenditure decreases but remains above baseline values. Information from population-based datasets is useful for improving the planning of stroke services.
A pesar del aumento de la supervivencia, el ictus representa una carga en salud y socioeconómica creciente. Mediante el uso de bases de datos poblacionales describimos las características principales de los pacientes con ictus isquémico y comparamos el uso de recursos y el gasto asociado un año antes y 3 años después del evento.
MétodosSe identificaron en los sistemas de Información del Servicio Catalán de la Salud todos los pacientes con ictus isquémico entre los años 2012 y 2016. Se relacionaron todos los contactos con el sistema sanitario desde un año antes del episodio índice hasta 3 años después. Se describió el uso de recursos y el gasto sanitario mensual y anual por paciente en los distintos recursos.
ResultadosSe identificaron 36.044 pacientes con ictus isquémico, edad media (DE) de 74,7 (13,3) años. La supervivencia a los 3 años fue del 63%. El gasto medio por paciente en el año previo fue de 3.230€, de 11.060€ el primer año desde el ictus, de 4.104€ el segundo y 3.878€ el tercero. Los mayores determinantes de gasto en el primer año fueron las hospitalizaciones (incluyendo la hospitalización inicial), representando el 45% de la diferencia con respecto al año previo al ictus, y en segundo lugar el gasto en convalecencia y rehabilitación (un 33%). Después del primer año, los mayores determinantes del incremento en el gasto respecto al año previo fueron las nuevas hospitalizaciones y el tratamiento farmacológico.
ConclusiónDespués de un ictus isquémico, el gasto en atención sanitaria aumenta principalmente por las necesidades iniciales de hospitalización y después del primer año se reduce, aunque manteniéndose por encima de los valores previos al ictus. La información derivada de bases de datos poblacionales es útil para mejorar la organización de los servicios de atención al ictus.
The growing burden of stroke has led to an increase in healthcare expenditure. In addition to the high hospitalisation rates, long hospital stays, and need for rehabilitation associated with stroke,1 the disease continues to be the leading cause of long-term disability.2 Advances in acute ischaemic stroke care have increased survival rates, but this has also resulted in greater numbers of survivors presenting sequelae and dependence.
Several studies have evaluated the cost of stroke, with results varying greatly according to context, perspectives, study design, and data sources.3–5 However, no study has quantified the cost of stroke using patient data in our setting, a public, free-to-use healthcare system with universal coverage. Furthermore, few studies have compared the costs associated with stroke management against healthcare costs before stroke to calculate the incremental costs potentially attributable to stroke.
The information technology systems of the Catalan Health Service gather data on healthcare resource use from different sources, providing population-based data from all healthcare system users. With the system, healthcare resource use can be quantified and the direct costs to the healthcare system can be calculated.6,7
The purpose of this study is to quantify and describe healthcare expenditure (excluding costs associated with emergency medical transport and orthotic/prosthetic material) associated with ischaemic stroke among users of the Catalan Health Service. We quantified expenditure using a bottom-up approach based on resource use by all individuals presenting stroke between 2012 and 2016, conducting retrospective, longitudinal follow-up from one year before stroke to 3 years after the episode.
MethodsData sourcesThe Registry of Morbidity and Resource Utilisation of Catalonia (MUSSCAT, for its Spanish initials) includes detailed information on the healthcare services used by the population covered. It includes data from the minimum basic dataset on hospital discharges, primary care consultations, community healthcare, emergency department visits, and mental health care (provided both on an inpatient and on an outpatient basis), in addition to drug dispensing data and medical billing data for specialist consultations, non-emergency medical transport, outpatient rehabilitation, home oxygen therapy, and dialysis.
Minimum basic datasets include automated cross-validation systems that ensure data consistency and identify any potential errors. Furthermore, as the data included are used for payment for medical services, the database is subject to external audits every 3-5 years to ensure data quality and reliability.
The analysis of anonymised administrative data does not require patient informed consent.
Study population and follow-upWe included all patients admitted to hospital due to ischaemic stroke (ICD-9-CM codes 433.XX [occlusion and stenosis of precerebral arteries] and 434.XX [occlusion of cerebral arteries]) between January 2012 and December 2016. We excluded patients with history of stroke in the 7 years prior to the event. The time period before stroke was defined as the 12 months before the date of hospitalisation due to stroke, and the follow-up period was defined either as the 3 years following the episode, or as the time between the date of hospitalisation due to stroke and either the date of death or 31 December 2016, whichever occurred first.
Comorbidities and/or medical history were coded using the International Classification of Diseases, 9th Revision, Clinical Modification (ICD-9-CM) (online Supplementary material, Table I).
We identified all drugs prescribed (number of packages of any drug), particularly drugs for secondary cardiovascular prevention, non-steroidal anti-inflammatory drugs, analgesics, and antidepressants using the Anatomical Therapeutic Chemical classification codes (online Supplementary material, Table II).
Statistical analysisData are expressed as percentages or means (standard deviation [SD]). We compared baseline patient data between men and women.
Rates of resource use and average healthcare expenditure per patient were calculated for 30-day or 365-day periods from the date of admission. For each 30-day period, we calculated the quotient between the sum of activity (or healthcare expenditure) performed over a given period and the mean number of patients at risk during said period ([number of patients at the beginning of the period + number of patients at the end of the period]/2), similarly to the method used in actuarial survival analysis.
To calculate the rate of healthcare resource use per person-year and the mean healthcare expenditure per person-year, we calculated the time at risk for each patient in each period; time at risk ended with death or end of follow-up on 31 December 2016. The numerator is the sum of activity (or expenditure) during that period, and the denominator is the number of person-years (summation of number of days at risk, divided by 365).
We established a standard cost or fee to estimate expenditure for each contact (each instance healthcare service use).6 This method accounts for 97.1% of the Catalan Health Service’s budget.
To calculate and graphically represent progression after stroke, we defined 7-day periods from the date of admission due to stroke and gathered data on patient outcomes (death, at an assisted-living residence, at a long-stay hospital, in hospital) at the end of each period. Survivors not institutionalised at an assisted-living residence or in a healthcare centre were considered to be living at home.8 At baseline (before hospital admission), only 2 options were considered: home or assisted-living residence.
To estimate resource use and healthcare expenditure attributable to stroke, we calculated the ratio between the rate of use for each resource and the difference in costs between the year before stroke and each year after stroke. We calculated incremental expenditure (after stroke vs before stroke) for each type of resource (hospital care, primary care, community healthcare and rehabilitation, drug dispensing).
Statistical analysis was performed using the R statistical software, version 3.4.3.
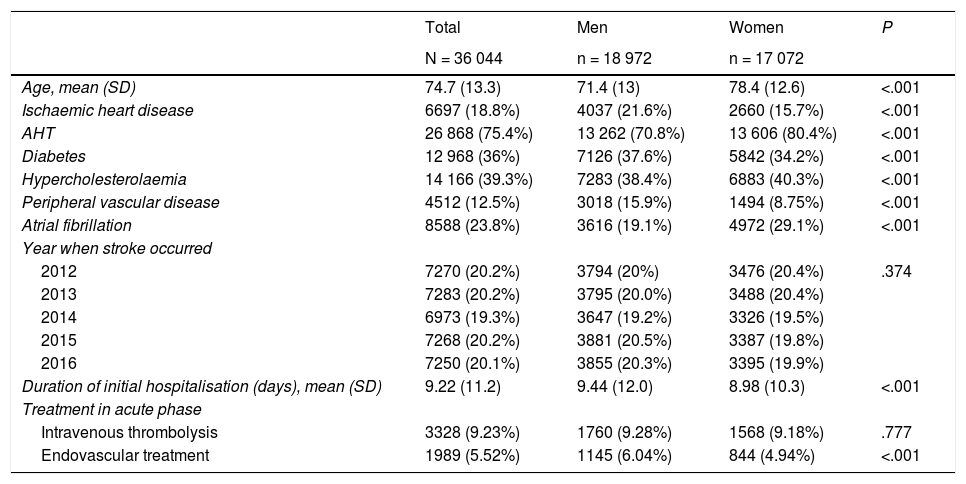
ResultsWe identified a total of 36 044 patients older than 18 years who were admitted due to ischaemic stroke and had no history of stroke in the previous 7 years (Fig. 1). Table 1 shows the baseline characteristics of the study population. Women accounted for 47.4% of the sample; mean age was 71.4 years (SD: 13) in men and 78.4 (12.6) years in women. Fig. 2 shows the age and sex distribution of the sample. The in-hospital mortality rate was 9%; 32 850 patients were discharged; and 74% of patients survived the first year, 68% survived the second year, and 63% survived the third year (Fig. 3).

Baseline patient and stroke characteristics, by sex.
| Total | Men | Women | P | |
|---|---|---|---|---|
| N = 36 044 | n = 18 972 | n = 17 072 | ||
| Age, mean (SD) | 74.7 (13.3) | 71.4 (13) | 78.4 (12.6) | <.001 |
| Ischaemic heart disease | 6697 (18.8%) | 4037 (21.6%) | 2660 (15.7%) | <.001 |
| AHT | 26 868 (75.4%) | 13 262 (70.8%) | 13 606 (80.4%) | <.001 |
| Diabetes | 12 968 (36%) | 7126 (37.6%) | 5842 (34.2%) | <.001 |
| Hypercholesterolaemia | 14 166 (39.3%) | 7283 (38.4%) | 6883 (40.3%) | <.001 |
| Peripheral vascular disease | 4512 (12.5%) | 3018 (15.9%) | 1494 (8.75%) | <.001 |
| Atrial fibrillation | 8588 (23.8%) | 3616 (19.1%) | 4972 (29.1%) | <.001 |
| Year when stroke occurred | ||||
| 2012 | 7270 (20.2%) | 3794 (20%) | 3476 (20.4%) | .374 |
| 2013 | 7283 (20.2%) | 3795 (20.0%) | 3488 (20.4%) | |
| 2014 | 6973 (19.3%) | 3647 (19.2%) | 3326 (19.5%) | |
| 2015 | 7268 (20.2%) | 3881 (20.5%) | 3387 (19.8%) | |
| 2016 | 7250 (20.1%) | 3855 (20.3%) | 3395 (19.9%) | |
| Duration of initial hospitalisation (days), mean (SD) | 9.22 (11.2) | 9.44 (12.0) | 8.98 (10.3) | <.001 |
| Treatment in acute phase | ||||
| Intravenous thrombolysis | 3328 (9.23%) | 1760 (9.28%) | 1568 (9.18%) | .777 |
| Endovascular treatment | 1989 (5.52%) | 1145 (6.04%) | 844 (4.94%) | <.001 |


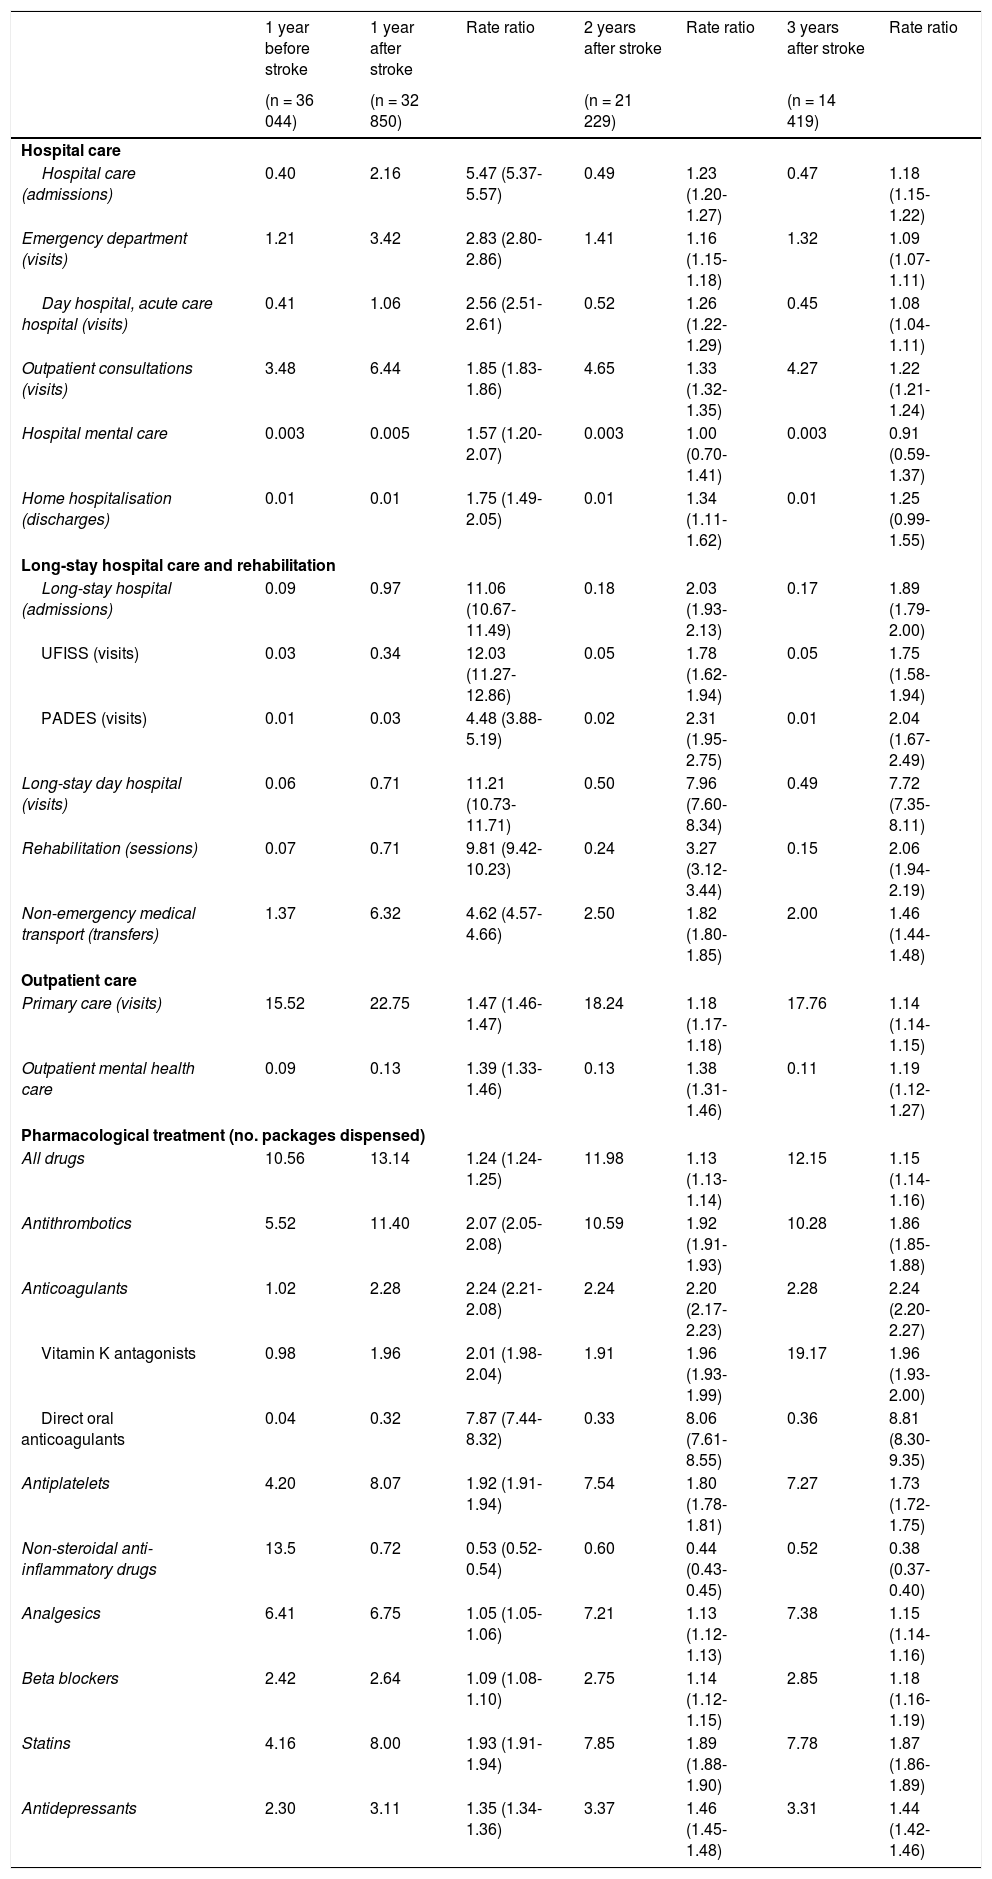
Table 2 shows the utilisation rates for different healthcare resources, by patient-year. Mean hospitalisation time was 2.3 days per patient in the year before stroke, 17.1 days in the first year after stroke, and 3.1 and 2.8 days in the second and third years after stroke, respectively. Mean time spent at a long-stay hospital was 2.2 days per patient in the year before stroke, 35.5 days in the first year after stroke, and 4.6 and 3.9 days in the second and third years after stroke, respectively.
Resource use (units/patient-year) one year before and up to 3 years after ischaemic stroke.
| 1 year before stroke | 1 year after stroke | Rate ratio | 2 years after stroke | Rate ratio | 3 years after stroke | Rate ratio | |
|---|---|---|---|---|---|---|---|
| (n = 36 044) | (n = 32 850) | (n = 21 229) | (n = 14 419) | ||||
| Hospital care | |||||||
| Hospital care (admissions) | 0.40 | 2.16 | 5.47 (5.37-5.57) | 0.49 | 1.23 (1.20-1.27) | 0.47 | 1.18 (1.15-1.22) |
| Emergency department (visits) | 1.21 | 3.42 | 2.83 (2.80-2.86) | 1.41 | 1.16 (1.15-1.18) | 1.32 | 1.09 (1.07-1.11) |
| Day hospital, acute care hospital (visits) | 0.41 | 1.06 | 2.56 (2.51-2.61) | 0.52 | 1.26 (1.22-1.29) | 0.45 | 1.08 (1.04-1.11) |
| Outpatient consultations (visits) | 3.48 | 6.44 | 1.85 (1.83-1.86) | 4.65 | 1.33 (1.32-1.35) | 4.27 | 1.22 (1.21-1.24) |
| Hospital mental care | 0.003 | 0.005 | 1.57 (1.20-2.07) | 0.003 | 1.00 (0.70-1.41) | 0.003 | 0.91 (0.59-1.37) |
| Home hospitalisation (discharges) | 0.01 | 0.01 | 1.75 (1.49-2.05) | 0.01 | 1.34 (1.11-1.62) | 0.01 | 1.25 (0.99-1.55) |
| Long-stay hospital care and rehabilitation | |||||||
| Long-stay hospital (admissions) | 0.09 | 0.97 | 11.06 (10.67-11.49) | 0.18 | 2.03 (1.93-2.13) | 0.17 | 1.89 (1.79-2.00) |
| UFISS (visits) | 0.03 | 0.34 | 12.03 (11.27-12.86) | 0.05 | 1.78 (1.62-1.94) | 0.05 | 1.75 (1.58-1.94) |
| PADES (visits) | 0.01 | 0.03 | 4.48 (3.88-5.19) | 0.02 | 2.31 (1.95-2.75) | 0.01 | 2.04 (1.67-2.49) |
| Long-stay day hospital (visits) | 0.06 | 0.71 | 11.21 (10.73-11.71) | 0.50 | 7.96 (7.60-8.34) | 0.49 | 7.72 (7.35-8.11) |
| Rehabilitation (sessions) | 0.07 | 0.71 | 9.81 (9.42-10.23) | 0.24 | 3.27 (3.12-3.44) | 0.15 | 2.06 (1.94-2.19) |
| Non-emergency medical transport (transfers) | 1.37 | 6.32 | 4.62 (4.57-4.66) | 2.50 | 1.82 (1.80-1.85) | 2.00 | 1.46 (1.44-1.48) |
| Outpatient care | |||||||
| Primary care (visits) | 15.52 | 22.75 | 1.47 (1.46-1.47) | 18.24 | 1.18 (1.17-1.18) | 17.76 | 1.14 (1.14-1.15) |
| Outpatient mental health care | 0.09 | 0.13 | 1.39 (1.33-1.46) | 0.13 | 1.38 (1.31-1.46) | 0.11 | 1.19 (1.12-1.27) |
| Pharmacological treatment (no. packages dispensed) | |||||||
| All drugs | 10.56 | 13.14 | 1.24 (1.24-1.25) | 11.98 | 1.13 (1.13-1.14) | 12.15 | 1.15 (1.14-1.16) |
| Antithrombotics | 5.52 | 11.40 | 2.07 (2.05-2.08) | 10.59 | 1.92 (1.91-1.93) | 10.28 | 1.86 (1.85-1.88) |
| Anticoagulants | 1.02 | 2.28 | 2.24 (2.21-2.08) | 2.24 | 2.20 (2.17-2.23) | 2.28 | 2.24 (2.20-2.27) |
| Vitamin K antagonists | 0.98 | 1.96 | 2.01 (1.98-2.04) | 1.91 | 1.96 (1.93-1.99) | 19.17 | 1.96 (1.93-2.00) |
| Direct oral anticoagulants | 0.04 | 0.32 | 7.87 (7.44-8.32) | 0.33 | 8.06 (7.61-8.55) | 0.36 | 8.81 (8.30-9.35) |
| Antiplatelets | 4.20 | 8.07 | 1.92 (1.91-1.94) | 7.54 | 1.80 (1.78-1.81) | 7.27 | 1.73 (1.72-1.75) |
| Non-steroidal anti-inflammatory drugs | 13.5 | 0.72 | 0.53 (0.52-0.54) | 0.60 | 0.44 (0.43-0.45) | 0.52 | 0.38 (0.37-0.40) |
| Analgesics | 6.41 | 6.75 | 1.05 (1.05-1.06) | 7.21 | 1.13 (1.12-1.13) | 7.38 | 1.15 (1.14-1.16) |
| Beta blockers | 2.42 | 2.64 | 1.09 (1.08-1.10) | 2.75 | 1.14 (1.12-1.15) | 2.85 | 1.18 (1.16-1.19) |
| Statins | 4.16 | 8.00 | 1.93 (1.91-1.94) | 7.85 | 1.89 (1.88-1.90) | 7.78 | 1.87 (1.86-1.89) |
| Antidepressants | 2.30 | 3.11 | 1.35 (1.34-1.36) | 3.37 | 1.46 (1.45-1.48) | 3.31 | 1.44 (1.42-1.46) |
Online Supplementary material Figs. I-VII show the progression of the monthly use rates of the most relevant resources; a change in resource use can be observed in the months following stroke. The use of some resources increases in the months before stroke. For example, primary care consultations (Fig. I) increased from 120 to 150 per 100 patients/month before admission due to stroke, hospital admissions (Fig. II) increased from 2.5 to 5 per 100 patients/month, and emergency department visits (Fig. IV) increased from 7.5 to 12 per 100 patients/month.
Taking the year before stroke as a reference, significant increases (rate ratios > 1) can be observed in the utilisation rate of nearly all healthcare resources (Table 2), with the exception of use of non-steroidal anti-inflammatory drugs, for which utilisation rates decreased.
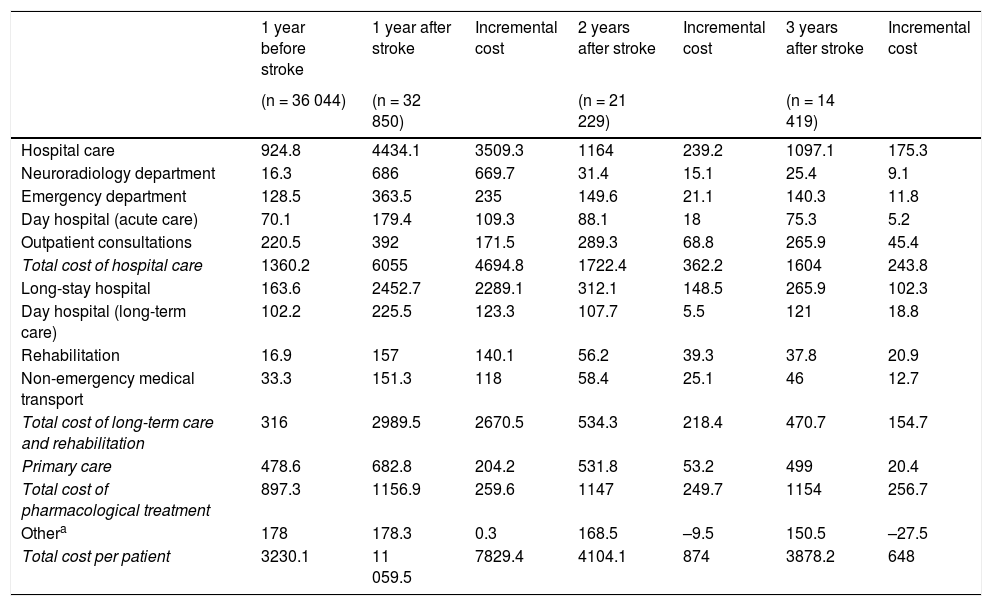
Table 3 presents the expenditure associated with the healthcare resources used. Resource use in the year before stroke was associated with a cost of €3230 per patient. In the first year after stroke, healthcare expenditure amounted to €11 060 per patient-year: €4434 corresponded to the costs associated with hospitalisation due to acute stroke plus any subsequent hospitalisations during the first year, and €2289 corresponded to the costs associated with institutionalisation in long-stay hospitals. During the second and third years, total expenses amounted to €4104 and €3878, respectively. Fig. 4 shows monthly healthcare expenditure per patient on different healthcare resources during the study period.
Average expenditure (€) per patient-year, one year before and up to 3 years after ischaemic stroke.
| 1 year before stroke | 1 year after stroke | Incremental cost | 2 years after stroke | Incremental cost | 3 years after stroke | Incremental cost | |
|---|---|---|---|---|---|---|---|
| (n = 36 044) | (n = 32 850) | (n = 21 229) | (n = 14 419) | ||||
| Hospital care | 924.8 | 4434.1 | 3509.3 | 1164 | 239.2 | 1097.1 | 175.3 |
| Neuroradiology department | 16.3 | 686 | 669.7 | 31.4 | 15.1 | 25.4 | 9.1 |
| Emergency department | 128.5 | 363.5 | 235 | 149.6 | 21.1 | 140.3 | 11.8 |
| Day hospital (acute care) | 70.1 | 179.4 | 109.3 | 88.1 | 18 | 75.3 | 5.2 |
| Outpatient consultations | 220.5 | 392 | 171.5 | 289.3 | 68.8 | 265.9 | 45.4 |
| Total cost of hospital care | 1360.2 | 6055 | 4694.8 | 1722.4 | 362.2 | 1604 | 243.8 |
| Long-stay hospital | 163.6 | 2452.7 | 2289.1 | 312.1 | 148.5 | 265.9 | 102.3 |
| Day hospital (long-term care) | 102.2 | 225.5 | 123.3 | 107.7 | 5.5 | 121 | 18.8 |
| Rehabilitation | 16.9 | 157 | 140.1 | 56.2 | 39.3 | 37.8 | 20.9 |
| Non-emergency medical transport | 33.3 | 151.3 | 118 | 58.4 | 25.1 | 46 | 12.7 |
| Total cost of long-term care and rehabilitation | 316 | 2989.5 | 2670.5 | 534.3 | 218.4 | 470.7 | 154.7 |
| Primary care | 478.6 | 682.8 | 204.2 | 531.8 | 53.2 | 499 | 20.4 |
| Total cost of pharmacological treatment | 897.3 | 1156.9 | 259.6 | 1147 | 249.7 | 1154 | 256.7 |
| Othera | 178 | 178.3 | 0.3 | 168.5 | –9.5 | 150.5 | –27.5 |
| Total cost per patient | 3230.1 | 11 059.5 | 7829.4 | 4104.1 | 874 | 3878.2 | 648 |

Taking the year prior to stroke as a reference, healthcare expenditure was 3.5 times greater the first year after stroke, and 28% and 20% higher in the second and third years, respectively. Fig. 5 shows the distribution of incremental costs by resource category (hospital care, primary care, long-stay hospital care or rehabilitation, and pharmacological treatment).
Discussion
This study estimated the healthcare expenditure associated with management of patients with ischaemic stroke and attended under the Catalan Health Service, and quantified the proportion of the cost that is attributable to stroke. Average expenditure per patient was €11 060 the first year (€7829 more than in the year before stroke). Healthcare expenditure decreased in the second and third years, stabilising at approximately €340 per month after 18 months (€100 more than before stroke).
Increases in expenditure mainly result from the initial hospitalisation (during the first year) and additional hospital admissions (in subsequent years). During the second and third years after stroke, expenditure associated with hospitalisation decreases considerably; the costs of consultations (outpatient and primary care consultations) and pharmacological treatment do not decrease during this period, however. The percentage of total expenditure attributed to long-stay hospital care and rehabilitation is greater in the first year after stroke, but continues to be a significant component of healthcare expenditure in subsequent years. In the second and third years, a considerable percentage of the incremental costs is attributable to pharmacological treatment: in the third year after stroke, annual drug expenditure per patient is €257 higher than before stroke.
In general terms, 40% of the incremental expenditure potentially attributable to stroke corresponds to drug dispensing, 26% to hospitalisation, and 24% to long-stay hospital care and rehabilitation. The increased use of hospital resources after stroke has already been studied in other settings.9,10 Although an analysis of the causes of readmission is beyond the scope of this study, stroke recurrence and other cardiovascular events are known to account for a considerable proportion of readmissions.10,11 The cost associated with stroke the first year after the event is addressed in great detail in the CONOCES study,3 a prospective study collecting data from 16 Spanish hospitals for the year 2012. Several other studies have analysed the costs of stroke, with estimates varying greatly (€5337-€27 711) depending on the context, perspective, study design, and data sources.3–5 The CONOCES study3 estimated the average direct healthcare cost at €8491 for the first year after stroke. This figure is similar to our estimate, demonstrating that administrative databases constitute a reliable source of information for estimating resource use and healthcare expenditure.
In addition to the well-known age-related increase in healthcare resource use, expenditure on these patients increases substantially after stroke. Furthermore, although resource use decreases after the acute and subacute phases, expenditure on some resources is far from reaching baseline (pre-stroke) levels. These include the costs associated with hospital care, specialised care (outpatient consultations), pharmacological treatment (particularly antithrombotics and other drugs for secondary prevention of cardiovascular disease, and, interestingly, use of analgesics and antidepressants, probably as a result of disability), and resources for patients with disability (long-stay hospitals, rehabilitation, non-emergency medical transport). Therefore, while average expenditure stabilises within 2 years of stroke, annual expenditure in the third year continues to be substantially greater than before stroke.
Patients with stroke are usually individuals of advanced age with multiple comorbidities, which means that many will already be using a considerable amount of healthcare resources prior to stroke. In fact, healthcare expenditure before stroke in our sample amounted to €3130 per patient; this is 3 times greater than the average expenditure per patient in 2014 (€990) and comparable to the average expenditure for patients older than 80 years.8 The value of comparing healthcare expenditure before and after stroke lies in the ability to estimate the costs attributable to stroke.
Although it is beyond the scope of the present study, a detailed analysis of the reasons for hospitalisation before stroke (which may include other manifestations of cardiovascular disease and episodes of atrial fibrillation) may enable the identification of patients at greater risk of stroke, which would in turn help in developing follow-up protocols for certain patient profiles to prevent or delay ischaemic stroke. This approach may be adopted by future studies using clinical and administrative databases.
Unlike similar studies analysing healthcare costs before and after stroke,9,11,12 our study also analysed non-hospital healthcare costs, which represent a considerable percentage of overall healthcare expenditure.4 In any case, our study did not analyse the social costs of disability, assumed by the healthcare system, and the costs assumed by patients and their families (informal care costs,13 direct costs associated with home adaptations, and indirect costs associated with patients’ or caregivers’ loss of productivity at work), which are believed to be even greater than healthcare costs.3
Population databases provide a large quantity of information relevant to the healthcare system (quality indicators), enabling the generation of new hypotheses for more detailed studies of clinical interest. For example, we were surprised to observe an increase in the use of certain resources in the months prior to stroke (hospitalisation, emergency department visits, and primary care consultations), which may have been associated with minor strokes or transient ischaemic attacks before the stroke that motivated the initial hospitalisation.
Population databases also enable the analysis of a complete patient cohort; the MUSSCAT registry provides exhaustive data on healthcare contacts and resource use, with the exception of emergency medical transport and orthotic/prosthetic material; these resources are relevant for patients with stroke, and exclusion of these data may have led to an underestimation of healthcare expenditure. Our cost estimates may be comparable to the actual healthcare system expenditure, since most resources are linked to a billing record, with the exception of hospitalisation and primary care consultations; the costs associated with these resources are estimated based on diagnosis-related groups14 and type of consultation (type of healthcare professional, home/outpatient consultation), respectively. As mentioned previously, healthcare expenditure in the first year after stroke in our study is consistent with estimates from a previous study conducted in our setting3; furthermore, the mortality rate observed in our sample is similar to those reported by specific studies,15,16 which supports the validity of administrative data for these purposes.
However, the use of administrative data is not without limitations. Although registries undergo regular quality controls, the presence of coding errors cannot be ruled out. Furthermore, administrative databases do not gather data on stroke severity or sequelae; resource use as a function of these variables cannot therefore be analysed. Future studies may address this limitation by combining administrative data with clinical data from the stroke registries implemented in Catalonia in recent years15–17; such registries may also be expanded to cover the whole Spanish population with the development of initiatives similar to the Sentinel Stroke National Audit Programme, which gathers data from England, Wales, and Northern Ireland. Our results cannot be extrapolated to other settings since resource costs may vary considerably between healthcare systems,18,19 potentially resulting in substantial differences in the costs associated with ischaemic stroke between countries (ranging from $2822 in Eastern European countries to $22 377 in the United Kingdom), or even between regions within the same country ($7309 vs $146 149 in the United States).4 However, data on resource use, the magnitude of incremental costs, and the percentage of these costs attributable to the use of each resource may be extrapolated to other countries with similar healthcare systems (public, free to use, and universal).
In conclusion, increased healthcare expenditure after ischaemic stroke is mainly explained by the initial need for hospitalisation, with costs decreasing a year after stroke but remaining higher than baseline levels. Information from population databases may be valuable for generating hypotheses for clinical studies and for improving the organisation of stroke care.
Author contributionsA. Ribera participated in study conception and design and in data interpretation, and drafted the first version of the manuscript.
E. Vela and M. Clèries participated in study conception and design and in data analysis and interpretation, and critically reviewed the manuscript.
A. García-Altés and S. Abilleira participated in study conception and design and in data interpretation, and critically reviewed the manuscript.
All authors approved the final version of the manuscript and take full responsibility for the accuracy and integrity of the data presented in the study.
FundingThis study has received no funding.
Conflicts of interestNone.
The following is Supplementary data to this article:
Please cite this article as: Ribera A, Vela E, García-Altés A, Clèries M, Abilleira S. Evolución del gasto en servicios sanitarios antes y después del ictus isquémico: análisis de base poblacional. Neurología. 2022;37:21–30.
