


Brain tractography is a non-invasive medical imaging technique which enables in vivo visualisation and various types of quantitative studies of white matter fibre tracts connecting different parts of the brain. We completed a quantitative study using brain tractography with diffusion tensor imaging in patients with mild cognitive impairment, patients with Alzheimer disease (AD), and normal controls, in order to analyse the reproducibility and validity of the results.
Subjects and methodsFractional anisotropy (FA) and mean diffusivity (MD) were measured across the uncinate fasciculus (UNC) and the posterior cingulate fasciculus (PCF) in images, obtained from a database and a research centre, representing 52 subjects distributed among the 3 study groups. Two observers took the measurements twice in order to evaluate intra- and inter-observer reproducibility.
ResultsMeasurements of FA and MD of the UNC delivered an intraclass correlation coefficient above 0.9; ICC was above 0.68 for the PCF. Patients with AD showed lower values of FA and higher MD values in the right UNC in images from the research centre. A comparison of the measurements from the 2 centres revealed significant differences.
ConclusionWe established a reproducible methodology for performing tractography of the tracts in question. FA and MD indexes may serve as early indicators of AD. The type of equipment and the method used to acquire images must be considered because they may alter results as shown by comparing the 2 data sets in this study.
La tractografía cerebral es una técnica que permite visualizar los fascículos de sustancia blanca que conectan distintas partes del cerebro y realizar estudios cuantitativos de diversa índole sobre ellos. En este trabajo de investigación se realizó un estudio cuantitativo por tractografía cerebral mediante imágenes de resonancia magnética potenciadas en difusión en pacientes con deterioro cognitivo leve, enfermedad de Alzheimer y controles normales, con el fin de analizar la reproducibilidad y validez de los resultados.
Sujetos y métodosSe realizaron mediciones de anisotropía fraccional (FA) y difusividad media (MD) en el fascículo uncinado y el fascículo cingulado posterior, en imágenes obtenidas de una base de datos y de un centro de investigación, en 52 sujetos distribuidos en los 3 grupos de interés. Dos observadores realizaron las mediciones 2 veces para evaluar la reproducibilidad intra- e interobservador.
ResultadosEn el estudio de reproducibilidad se obtuvieron coeficientes de correlación intraclase superior a 0,9 para las medidas de FA y MD del fascículo uncinado, y mayor de 0,68 para las del fascículo cingulado posterior. Los pacientes con enfermedad de Alzheimer mostraron menores valores de FA y mayores valores de MD para el fascículo uncinado derecho correspondiente al centro de investigación. Existieron diferencias significativas en la comparación entre los datos de la base de datos y los del centro de investigación.
ConclusionesSe estableció una metodología reproducible para realizar tractografía en los fascículos estudiados. Los índices de FA y MD podrían ser indicadores tempranos de la enfermedad de Alzheimer, siendo necesario considerar el equipo y el método de adquisición de imágenes ya que pueden influir en los resultados como se comprobó en la comparación entre los 2 conjuntos de datos empleados.
Diffusion-tensor imaging (DTI) is a special magnetic resonance (MR) imaging technique based on the diffusion of water in biological tissues.1 Brain tractography uses DTI images to reconstruct white-matter connections in the brain and model them in 3D. This is currently the only non-invasive technique that can be used to view brain nerve tracts in vivo.2 Nevertheless, the technique has to be validated so that results will be reproducible and usable in quantitative analysis, and so that they reflect real anatomical details.3 Although many different computer programs for performing tractography are available, and some may be freely used for research purposes, the results they deliver may vary from program to program. This may be due to the algorithms they employ or the manageability of the program itself, since reproducibility of results depends to a certain extent on how the user interacts with the software.4 Variations can also be found in multicentre studies due to use of different MRI units and different protocols for the capture of DTI images. These changes may affect the measurements of results employing tractography, as indicated by Fischer et al.5 and Heiervang et al.6 These researchers found that tract volume measurements varied when different diffusion gradients were applied. Furthermore, the Alzheimer's Disease Neuroimaging Initiative (ADNI) has estimated that differences between 1.5T and 3T scanners yield a 5% variation in automatic diagnosis of Alzheimer disease (AD) based on volumetrics.7
AD is the most common type of dementia, and its earliest and most notorious characteristic is memory loss.8 Mild cognitive impairment (MCI) refers to the clinical stage prior to frank dementia in which the patient displays the first changes in memory and cognitive ability that may be observed by other people, but which are not so severe as to interfere with the patient's daily life.9 The 2008 review by Chua et al.10 mentions the differences between measurements of certain nerve fascicles in MCI and AD. Based on the above, tractography is very likely to be a potential clinical tool for early detection and control in patients with those diseases. Preliminary studies show a decrease in white-matter connections in patients with MCI and AD. Especially noticeable are the increased mean diffusivity (MD) and decreased fractional anisotropy (FA) in these patients compared to normal controls. These changes were found in the posterior cingulate fasciculus (PCF),11–13 the uncinate fasciculus (UNC),14,15 or both at once.16
As Spanish-language literature does not yet contain a study on the reproducibility of tractography, or of its use in AD, we present our contribution. Its purpose is to examine the reproducibility of cerebral tractography measurements of specific fascicles, using a single computer program and DTI, in patients with MCI or AD and in normal controls. Patient data were obtained from a database and from a research centre.
Subjects and methodsDiffusion-weighted MR images were obtained from the ADNI database (adni.loni.ucla.edu); other images were provided by the CIEN Foundation (Fundación Centro de Investigación de Enfermedades Neurológicas), a research centre in Madrid (www.fundacioncien.es).
Regarding the ADNI and the CIEN FoundationThe ADNI consortium was launched in 2003 by the National Institute on Ageing, the National Institute of Biomedical Imaging and Bioengineering, the Food and Drug Administration, private pharmaceutical companies, and non-profit organisations as a 5-year public–private partnership financed with 60milliondollars. ADNI's main purpose is to determine if it is possible to combine biomarkers and the parameters from MR and PET images with clinical and neuropsychological assessments in order to measure progression in MCI and early stages of AD. The lead researcher for this initiative is Dr. Michael W. Weiner of the VA Medical Center and University of California in San Francisco. More information can be found at www.adni-info.org.
The CIEN Foundation was created to promote the development of a network of centres that would support, publicise, and coordinate research in all areas of basic, clinical, and epidemiological neurology. It places a special emphasis on problems related to nervous system diseases through its many research units located all across Spain and designed as single-focus centres. In these centres, scientists develop various lines of research in the neurosciences, and they make use of common physical infrastructure and equipment. CIEN was placed in charge of the Project Alzheimer research unit once the Queen Sofía Foundation had granted that institution the use of its building. The research unit places a high priority on research on AD and other forms of dementia, while also undertaking research on other neurodegenerative diseases.
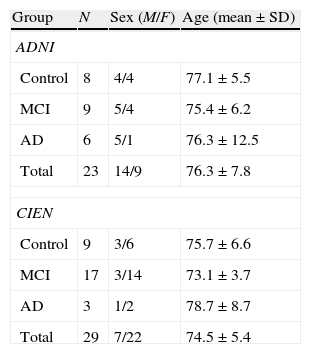
Study populationA total of 52 subjects, 23 from the ADNI database and 29 from CIEN, were included in the study. There were 21 men and 31 women; by diagnostic group, 17 were normal controls, 26 had MCI, and 9 had AD. Mean age was 75.3±6.5 years (mean±typical deviation; range, 55–90 years). There were no age differences between diagnostic groups. Table 1 describes the study sample broken down by group. Patients with AD had a mini-mental state evaluation of 23.3±2.1 with an age of 75.5±7.5. Ratings were 1–2 on the CDR (clinical dementia rating scale). Patients with MCI had no other neurological signs. Mini-mental state evaluation was 27.2±1.7; the verbal memory deficit measured with WMS-R Logical Memory II part A was 5.9±5.2 (maximum, 25) and CDR was 0.5.
Description of study population.
| Group | N | Sex (M/F) | Age (mean±SD) |
| ADNI | |||
| Control | 8 | 4/4 | 77.1±5.5 |
| MCI | 9 | 5/4 | 75.4±6.2 |
| AD | 6 | 5/1 | 76.3±12.5 |
| Total | 23 | 14/9 | 76.3±7.8 |
| CIEN | |||
| Control | 9 | 3/6 | 75.7±6.6 |
| MCI | 17 | 3/14 | 73.1±3.7 |
| AD | 3 | 1/2 | 78.7±8.7 |
| Total | 29 | 7/22 | 74.5±5.4 |
ADNI: Alzheimer's Disease Neuroimaging Initiative (adni.loni.ucla.edu); CIEN: Fundación Centro de Investigación de Enfermedades Neurológicas, Madrid (www.fundacioncien.es); MCI: mild cognitive impairment; SD: standard deviation; AD: Alzheimer disease.
The scans downloaded from the ADNI database were acquired using a 3T MRI unit made by General Electric, model Discovery MR750. An echo planar imaging sequence was used with an echo time of 61.9ms and repetition time of 9050ms. Scans were taken using 41 diffusion-gradient directions with a b-value of 1000s/mm2 and 5 volumes with no diffusion-weighting and a b-value of 0. Image matrix was 256×256 with a pixel size of 1.36mm. Scans from the CIEN Foundation were taken using a 3T MR unit made by General Electric, model Signa HDx. The echo planar imaging sequence had an echo time of 84.9ms and a repetition time of 8200ms. Images used 15 independent diffusion-gradient directions with a b-value of 1000s/mm2 and a volume with no diffusion-weighting and a b-value of 0. Image matrix was 256×256 with a pixel size of 0.93mm. All data were stored in DICOM format and converted to NITFI format using dcm2nii software distributed with the MRIcron software package (www.mccauslandcenter.sc.edu/mricro/mricron/).
Fascicles under studyThe study performed in 2010 by Morikawa et al.17 found that anisotropy and diffusivity indexes were significantly correlated to cognitive capacity in patients with AD. Based on earlier studies,13–17 and the hypothesis that the UNC and PCF play an important role in knowledge and memory,16 we decided to study these bundles in both cerebral hemispheres. For each fascicle, researchers measured AF, MD, and the volume and number of nerve fibres in the fascicle to study measurement reproducibility. Since earlier studies found the AF and MD indexes to have diagnostic significance, data sets were compared within each study group (ADNI and CIEN), and then between those two study groups.
TractographyMedINRIA v 1.9.2 was used to reconstruct UNC and PCF bundles (http://med.inria.fr/).18 This program uses a deterministic algorithm employing the 2-tensor model estimation method. Beginning at a single seed point, each fibre was traced by following the tensor whose main direction of diffusion most closely resembled the preceding direction of diffusion.19 Tractography was performed with an FA1 and FA2 threshold of 0.2; FA1 is the threshold at which the algorithm begins to reconstruct fibres, and FA2 is the threshold indicating that fibres will be reconstructed until their FA drops below that value. The minimum fibre length was set to 10mm, meaning that shorter fibres were not recorded. Fibres were reconstructed voxel by voxel with a reduction threshold of 500. Below this threshold, tensors were not estimated because they corresponded to areas of the image that could not be used to measure the fascicles under study. We also used the MedINRIA filter to reduce noise in the images.
One of the main sources of variation was the location of regions of interest (ROI) for identifying specific white-matter fascicles.3 There are different positioning methods, and the location, size, and shape of the ROIs may vary. Furthermore, fascicles extracted using this technique may include fibres that do not belong to the tract being targeted.6 Since this project studies the interobserver reproducibility of measurements, we first defined a protocol for locating ROIs so as to reconstruct the fascicles in question. Protocols were based on those described by Wakana et al.3 for the UNC and by Kiuchi et al.16 for the PCF. Fig. 1 shows the ROI location and the location of the coronal slice over a sagittal slice to select the left UNC. Two ROIs were drawn over a coronal slice along the most posterior plane marking the separation of the temporal and frontal lobes, using an image without diffusion-weighting (b0) to provide a better view of anatomical structures. The first ROI (in red) was plotted such that it covered the entire temporal lobe; the second (white) covered the projections over the frontal lobe. A colour FA image provided a better view of the second ROI, shown as the small green zone in the image and labelled ‘ROI2’. We then used the ‘AND’ option so that only those fibres passing through both marked ROIs would be selected. For the PCF, we used a colour FA map of a coronal slice in which 2 PCF projections could be seen. The first ROI was then drawn over one projection, and the second ROI over another projection. Fig. 2 shows these locations; projections of the PCF are shown on the colour FA map in blue and the coronal slice is located over a sagittal slice to select the PCF. The ‘AND’ option was also used here so that only fibres passing through both marked ROIs would be selected. These protocols for ROI location were included in an operations manual that was provided to a second observer for the reproducibility study. The manual will also serve as a guide for those interested in performing tractography with MedINRIA 1.9.2. Fig. 3 shows an example of the fascicles delivered by the proposed protocol, with the UNC appearing in green and the PCF in red. Both belong to the left hemisphere.
 within a sagittal plane.")
 within a sagittal plane.")
 and posterior cingulate fasciculus (red).")
We used IBM's SPSS statistical package, v. 20 for data analysis (IBM, NY, USA). The analysis examined each data set separately (ADNI and CIEN data). First, the Kolmogorov–Smirnov test was used to check that measurements followed a normal distribution. We calculated the intraclass correlation coefficient (ICC) to analyse intra- and interobserver reproducibility for measurements of FA, MD, volume, and number of fibres in the left and right UNC and PCF in all subjects. ICC values exceeding 0.80 indicate excellent agreement, while values from 0.60 to 0.79 show substantial agreement.20 One-way ANOVA was used to identify significant differences among means from the 3 study groups. Values of α=0.05 were established as statistically significant for all tests.
As our images had been obtained from 2 separate sources, using different scanners and protocols, we ran a t-test to look for significant differences between the means from the two data sets. Since there were multiple comparisons in each subject group, we applied a Bonferroni correction to obtain a significance level of 0.05/8=0.006 for each group.
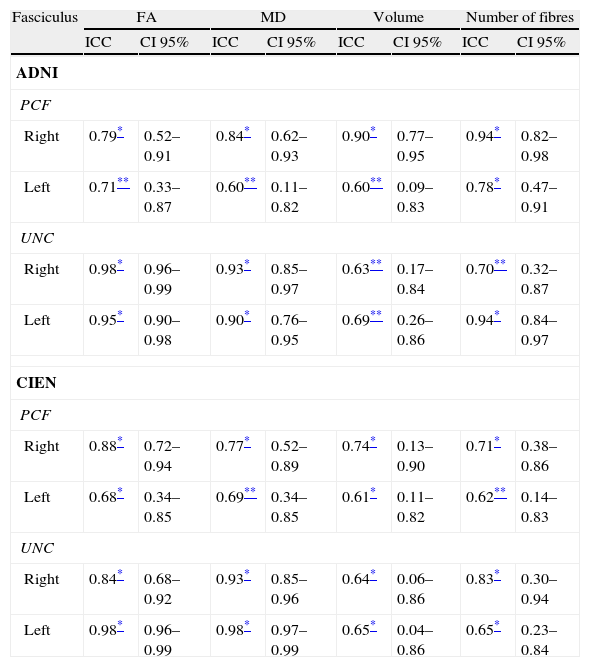
ResultsAll variables display a normal distribution according to the Kolmogorov–Smirnov test. ICC values for intraobserver reproducibility were within the 0.90–0.99 range for the UNC and in the 0.68–0.86 range for the PCF for all 4 measured variables, for both ADNI and CIEN data. In all cases, the confidence interval was 95% with a statistical significance level of P<.001. The interobserver reproducibility analysis yielded the values shown in Table 2. Here, the highest ICC values correspond to the FA and MD indexes for the UNC, and they fall in the 0.84–0.98 range, which indicates excellent agreement. For all other measurements, reproducibility can be described as substantial. Fig. 4 shows a graphic representation of ICC values for variables in the interobserver comparison. Here, we see the highest levels of reproducibility for FA and MD indexes corresponding to the UNC.
Interobserver reproducibility.
| Fasciculus | FA | MD | Volume | Number of fibres | ||||
| ICC | CI 95% | ICC | CI 95% | ICC | CI 95% | ICC | CI 95% | |
| ADNI | ||||||||
| PCF | ||||||||
| Right | 0.79* | 0.52–0.91 | 0.84* | 0.62–0.93 | 0.90* | 0.77–0.95 | 0.94* | 0.82–0.98 |
| Left | 0.71** | 0.33–0.87 | 0.60** | 0.11–0.82 | 0.60** | 0.09–0.83 | 0.78* | 0.47–0.91 |
| UNC | ||||||||
| Right | 0.98* | 0.96–0.99 | 0.93* | 0.85–0.97 | 0.63** | 0.17–0.84 | 0.70** | 0.32–0.87 |
| Left | 0.95* | 0.90–0.98 | 0.90* | 0.76–0.95 | 0.69** | 0.26–0.86 | 0.94* | 0.84–0.97 |
| CIEN | ||||||||
| PCF | ||||||||
| Right | 0.88* | 0.72–0.94 | 0.77* | 0.52–0.89 | 0.74* | 0.13–0.90 | 0.71* | 0.38–0.86 |
| Left | 0.68* | 0.34–0.85 | 0.69** | 0.34–0.85 | 0.61* | 0.11–0.82 | 0.62** | 0.14–0.83 |
| UNC | ||||||||
| Right | 0.84* | 0.68–0.92 | 0.93* | 0.85–0.96 | 0.64* | 0.06–0.86 | 0.83* | 0.30–0.94 |
| Left | 0.98* | 0.96–0.99 | 0.98* | 0.97–0.99 | 0.65* | 0.04–0.86 | 0.65* | 0.23–0.84 |
ICC: intraclass correlation coefficient; FA: fractional anisotropy; CI 95%: 95% confidence interval; MD: mean diffusivity; PCF: posterior cingulate fasciculus; UNC: uncinate fasciculus.

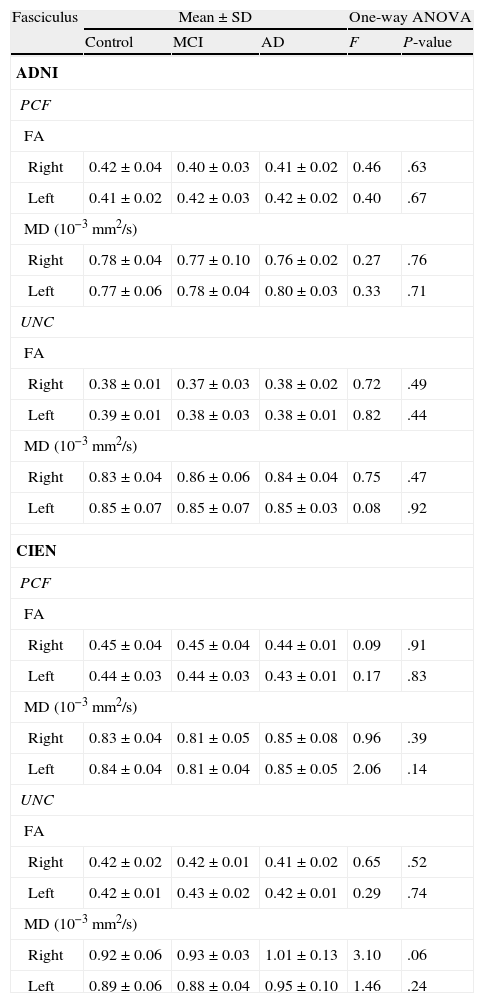
The one-way ANOVA test did not identify significant differences among the means from the 3 study groups. However, as we see in Table 3, one value approached statistical significance (P=.06); this value corresponds to the MD measurement in the right UNC in data provided by CIEN. This nearly significant difference is also shown graphically in Fig. 5, in which the MD value for the AD group is larger than the MCI value, which in turn is higher than the control group value. Inversely, we observed a tendency towards a decrease in FA values for the same fascicle.
Comparison of equality of the means for each group.
| Fasciculus | Mean±SD | One-way ANOVA | |||
| Control | MCI | AD | F | P-value | |
| ADNI | |||||
| PCF | |||||
| FA | |||||
| Right | 0.42±0.04 | 0.40±0.03 | 0.41±0.02 | 0.46 | .63 |
| Left | 0.41±0.02 | 0.42±0.03 | 0.42±0.02 | 0.40 | .67 |
| MD (10−3mm2/s) | |||||
| Right | 0.78±0.04 | 0.77±0.10 | 0.76±0.02 | 0.27 | .76 |
| Left | 0.77±0.06 | 0.78±0.04 | 0.80±0.03 | 0.33 | .71 |
| UNC | |||||
| FA | |||||
| Right | 0.38±0.01 | 0.37±0.03 | 0.38±0.02 | 0.72 | .49 |
| Left | 0.39±0.01 | 0.38±0.03 | 0.38±0.01 | 0.82 | .44 |
| MD (10−3mm2/s) | |||||
| Right | 0.83±0.04 | 0.86±0.06 | 0.84±0.04 | 0.75 | .47 |
| Left | 0.85±0.07 | 0.85±0.07 | 0.85±0.03 | 0.08 | .92 |
| CIEN | |||||
| PCF | |||||
| FA | |||||
| Right | 0.45±0.04 | 0.45±0.04 | 0.44±0.01 | 0.09 | .91 |
| Left | 0.44±0.03 | 0.44±0.03 | 0.43±0.01 | 0.17 | .83 |
| MD (10−3mm2/s) | |||||
| Right | 0.83±0.04 | 0.81±0.05 | 0.85±0.08 | 0.96 | .39 |
| Left | 0.84±0.04 | 0.81±0.04 | 0.85±0.05 | 2.06 | .14 |
| UNC | |||||
| FA | |||||
| Right | 0.42±0.02 | 0.42±0.01 | 0.41±0.02 | 0.65 | .52 |
| Left | 0.42±0.01 | 0.43±0.02 | 0.42±0.01 | 0.29 | .74 |
| MD (10−3mm2/s) | |||||
| Right | 0.92±0.06 | 0.93±0.03 | 1.01±0.13 | 3.10 | .06 |
| Left | 0.89±0.06 | 0.88±0.04 | 0.95±0.10 | 1.46 | .24 |
ADNI: Alzheimer's Disease Neuroimaging Initiative (adni.loni.ucla.edu); CIEN: Fundación Centro de Investigación de Enfermedades Neurológicas, Madrid (www.fundacioncien.es); MCI: mild cognitive impairment; SD: standard deviation; AD: Alzheimer disease; FA: fractional anisotropy; MD: mean diffusivity; PCF: posterior cingulate fasciculus; UNC: uncinate fasciculus.

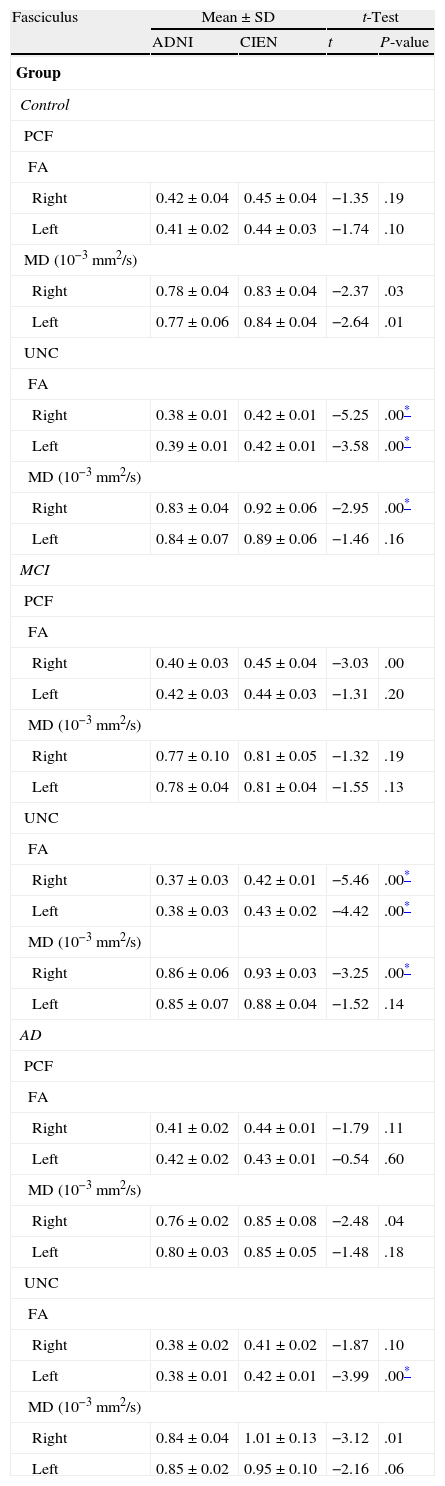
There were significant differences between data provided by ADNI and CIEN for the UNC in all 3 study groups, as determined by the t-test for independent samples (Table 4). Differences were bilateral for FA in the UNC in control and MCI groups, and only left-sided in the AD group. There were differences in MD in the right UNC in both the control and MCI groups. Most of the values measured by the ADNI were lower than those measured by CIEN.
Equality of the means: comparison between ADNI and CIEN data.
| Fasciculus | Mean±SD | t-Test | ||
| ADNI | CIEN | t | P-value | |
| Group | ||||
| Control | ||||
| PCF | ||||
| FA | ||||
| Right | 0.42±0.04 | 0.45±0.04 | −1.35 | .19 |
| Left | 0.41±0.02 | 0.44±0.03 | −1.74 | .10 |
| MD (10−3mm2/s) | ||||
| Right | 0.78±0.04 | 0.83±0.04 | −2.37 | .03 |
| Left | 0.77±0.06 | 0.84±0.04 | −2.64 | .01 |
| UNC | ||||
| FA | ||||
| Right | 0.38±0.01 | 0.42±0.01 | −5.25 | .00* |
| Left | 0.39±0.01 | 0.42±0.01 | −3.58 | .00* |
| MD (10−3mm2/s) | ||||
| Right | 0.83±0.04 | 0.92±0.06 | −2.95 | .00* |
| Left | 0.84±0.07 | 0.89±0.06 | −1.46 | .16 |
| MCI | ||||
| PCF | ||||
| FA | ||||
| Right | 0.40±0.03 | 0.45±0.04 | −3.03 | .00 |
| Left | 0.42±0.03 | 0.44±0.03 | −1.31 | .20 |
| MD (10−3mm2/s) | ||||
| Right | 0.77±0.10 | 0.81±0.05 | −1.32 | .19 |
| Left | 0.78±0.04 | 0.81±0.04 | −1.55 | .13 |
| UNC | ||||
| FA | ||||
| Right | 0.37±0.03 | 0.42±0.01 | −5.46 | .00* |
| Left | 0.38±0.03 | 0.43±0.02 | −4.42 | .00* |
| MD (10−3mm2/s) | ||||
| Right | 0.86±0.06 | 0.93±0.03 | −3.25 | .00* |
| Left | 0.85±0.07 | 0.88±0.04 | −1.52 | .14 |
| AD | ||||
| PCF | ||||
| FA | ||||
| Right | 0.41±0.02 | 0.44±0.01 | −1.79 | .11 |
| Left | 0.42±0.02 | 0.43±0.01 | −0.54 | .60 |
| MD (10−3mm2/s) | ||||
| Right | 0.76±0.02 | 0.85±0.08 | −2.48 | .04 |
| Left | 0.80±0.03 | 0.85±0.05 | −1.48 | .18 |
| UNC | ||||
| FA | ||||
| Right | 0.38±0.02 | 0.41±0.02 | −1.87 | .10 |
| Left | 0.38±0.01 | 0.42±0.01 | −3.99 | .00* |
| MD (10−3mm2/s) | ||||
| Right | 0.84±0.04 | 1.01±0.13 | −3.12 | .01 |
| Left | 0.85±0.02 | 0.95±0.10 | −2.16 | .06 |
MCI: mild cognitive impairment; SD: standard deviation; AD: Alzheimer disease; FA: fractional anisotropy; MD: mean diffusivity; PCF: posterior cingulate fasciculus; UNC: uncinate fasciculus.
FA and MD indexes are imaging parameters that are commonly used to assess changes in white matter in numerous diseases.1–4 Scientists believe that such factors as axonal density, myelination, and homogeneity in axonal orientation affect the degree of anisotropy in diffusion. It is thought that a decrease in FA and an increase in MD reflect a loss of integrity in brain tissue.10
Reproducibility was excellent for FA and MD measurement in the UNC, and substantial for measurements of volume, number of fibres, and all measurements in the PCF. As in our study, Heiervang et al.6 also found that FA and MD measurements were more reproducible than volume measurements. As stated before, the main source of variation of the method is the localisation of the ROIs. UNC measurements are more reproducible because this fascicle is easier to extract than the PCF; tractography in the UNC is not contaminated by other fibres stretching in different directions.17 These results indicate that the method employed for locating ROIs is reproducible, especially for the UNC. The proposed manual for performing tractography with MedINRIA 1.9.2, which was used by the second observer, is a useful reference for those lacking experience with that software. Anyone interested in this manual may receive it by emailing the authors.
The study revealed no significant differences among the 3 study groups. However, for the case that approached statistical significance (MD of the right UNC, measured by CIEN), MD values were higher in AD patients than in MCI patients or in the control group. In turn, FA values in the CIEN database were lower in the AD group than in the other 2 groups for right-sided UNC measurements. This tendency coincides with results from earlier studies.12,13,16 These changes in uncinate fasciculi have also been observed in other types of dementia, such as Lewy body dementia.21 A decrease in FA in anterior and posterior cingulate fascicles is also found in Parkinson's disease,22 suggesting that it should be studied more extensively as a potential marker for neurodegenerative disease.10
Comparisons of the data sets recorded by the two centres showed that there were differences in the parameters measured in each study population. These differences are probably due to variations in the recruitment of patients with different baseline profiles.23 Completing a DTI study is a complex process; in addition to its long acquisition time (which makes it more sensitive to patient movements), DTI requires high-gradient MRI scanners, which are not universally available. According to Fischer et al.,5 the main variation is the number of diffusion gradients used to acquire the images. In our case, FA and MD values in the ADNI data (41 gradients) were lower than those from CIEN data (15 gradients). Nevertheless, results obtained by Heiervang et al.6 contrast with those from our study: they show that fasciculus reconstructions derived using a lower number of gradients (12) have lower MD and higher FA values than those extracted using 60 diffusion-gradient directions. Our study's most important limitation is its small sample size, which very likely explains why we found no significant differences between groups. Due to the limitations previously mentioned for these MRI techniques, they are not routinely used even by ADNI.24
However, despite the limitations of the ADNI and CIEN data, the method presented here is reproducible. When this technique has become more widespread and homogeneous, further studies will be required to test for significant differences between patient groups controlled by stage of dementia. As a result, the differences in FA and MD indexes described here may come to be regarded as biomarkers for AD.
FundingA part of the data used in this study was funded by the Alzheimer's Disease Neuroimaging Initiative (ADNI), (National Institutes of Health Grant U01 AG024904). The ADNI consortium is funded by the National Institute on Aging, the National Institute of Biomedical Imaging and Bioengineering, and by generous contributions from Abbott; Alzheimer's Association; Alzheimer's Drug Discovery Foundation; Amorfix Life Sciences Ltd.; AustraZeneca; Bayer HealthCare; BioClinica, Inc.; Biogen Idec Inc.; Bristol-Myers Squibb Company; Eisai Inc.; Elan Pharmaceuticals Inc.; Eli Lilly and Company; F. Hoffmann-La Roche Ltd and its affiliated company Genentech, Inc.; GE Healthcare; Innogenetics, N.V.; IXICO Ltd.; Janssen Alzheimer Immunotherapy Research & Development, LLC.; Johnson & Johnson Pharmaceutical Research & Development LLC.; Medpace, Inc.; Merck & Co., Inc.; Meso Scale Diagnostics, LLC.; Novartis Pharmaceuticals Corporation; Pfizer Inc.; Servier; Synarc Inc.; and Takeda Pharmaceutical Company. The Canadian Institutes of Health Research provide funding to support clinical ADNI locations in Canada. Contributions from the private sector are channelled through the Foundation for the National Institutes of Health (www.fnih.org). The organisation providing the framework for this consortium is the Northern California Institute for Research and Education; the study is coordinated by the Alzheimer's Disease Cooperative Study at the University of California, San Diego. ADNI data were provided by the Laboratory for Neuro Imaging at the University of California, Los Angeles. This study also received financing in the form of NIH grants P30 AG010129 and K01 AG030514.
Conflicts of interestThe authors have no conflicts of interest to declare.
We are grateful to Dr. Juan Álvarez-Linera at Fundación Centro de Investigación de Enfermedades Neurológicas (CIEN) for letting us use these images.
Part of the data used in the preparation of this article were obtained from the database of the Alzheimer's Disease Neuroimaging Initiative (ADNI) (adni.loni.ucla.edu). Therefore, ADNI investigators contributed to the design and implementation of ADNI and provision of data but did not participate in analysis or writing of this paper. A complete listing of ADNI investigators can be found at: http://adni.loni.ucla.edu/wp-content/uploads/how_to_apply/ADNI_Acknowledgement_List.pdf.
Please cite this article as: Larroza A, Moratal D, D’ocón Alcañiz V, Arana E, por la Alzheimer's Disease Neuroimaging Initiative. Tractografía del fascículo uncinado y el fascículo uncinado posterior en pacientes con deterioro cognitivo leve y enfermedad de Alzheimer. Neurología. 2014;29:11–20.
articles

Neurología (English Edition) follows the Recommendations for the Conduct, Reporting, Editing and Publication of Scholarly Work in Medical Journals