


Alzheimer's disease (AD) is a progressive and irreversible neurodegenerative disease that seriously affects cognitive ability and has become a key public health problem. Many studies have identified the possibility of peripheral blood microRNA as effective non-invasive biomarkers for AD diagnosis, but the results are inconsistent. Therefore, we carried out this meta-analysis to evaluate the diagnostic accuracy of circulating microRNAs in the diagnosis of AD patients.
MethodsWe performed a systematic literature search of the following databases: PubMed, EMBASE, Web of Science, Cochrane Library, Wanfang database and China National Knowledge Infrastructure, updated to March 15, 2021. A random effects model was used to pool the sensitivity, specificity, positive likelihood ratio, negative likelihood ratio, diagnostic odds ratio and area under the curve. Meta-regression and subgroup analysis were performed to explore the sources of heterogeneity, and Deeks’ funnel plot was used to assess whether there was publication bias.
Results62 studies from 18 articles were included in this meta-analysis. The pooled sensitivity was 0.82 (95% CI: 0.78–0.85), specificity was 0.80 (95% CI: 0.76–0.83), PLR was 4. 1 (95% CI: 3.4–4.9), NLR was 0.23 (95% CI: 0.19–0.28), DOR was 18 (95% CI: 13–25) and AUC was 0.88 (95% CI: 0.84–0.90). Subgroup analysis shows that the microRNA clusters of plasma type performed a better diagnostic accuracy of AD patients. In addition, publication bias was not found.
ConclusionsCirculating microRNAs can be used as a promising non-invasive biomarker in AD diagnosis.
La enfermedad de Alzheimer (EA) es una enfermedad neurodegenerativa progresiva e irreversible que afecta gravemente la capacidad cognitiva y se ha convertido en un problema clave de salud pública. Muchos estudios han identificado la posibilidad de que los microARN de sangre periférica sean biomarcadores no invasivos para el diagnóstico de la EA, pero los resultados son inconsistentes. Por lo tanto, llevamos a cabo este metaanálisis para evaluar la precisión diagnóstica de los microARN circulantes en el diagnóstico de pacientes con EA.
MétodosRealizamos una búsqueda bibliográfica sistemática de las siguientes bases de datos: PubMed, EMBASE, Web of Science, Cochrane Library, Wanfang database y China National Knowledge Infrastructure, actualizado a 15 de marzo de 2021. Se utilizó un modelo de efectos aleatorios para agrupar la sensibilidad, especificidad, razón de probabilidad positiva, razón de probabilidad negativa, razón de probabilidades de diagnóstico y área bajo la curva. Se realizó una metarregresión y un análisis de subgrupos para explorar las fuentes de heterogeneidad, y se utilizó el gráfico en embudo de Deek's para evaluar si había sesgo de publicación.
ResultadosEn este metaanálisis se incluyeron 62 estudios de 18 artículos. La sensibilidad combinada fue de 0,82 (IC 95%: 0,78-0,85), la especificidad fue de 0,80 (IC 95%: 0,76-0,83), la PLR fue de 4,1 (IC 95%: 3,4-4,9), la NLR fue de 0,23 (IC 95%: 0,19-0,28), la DOR fue de 18 (IC 95%: 13-25) y el AUC fue de 0,88 (IC 95%: 0,84-0,90). El análisis de subgrupos muestra que los microARN clústeres de tipo plasmático tuvieron una mejor precisión diagnóstica de pacientes con EA. Además, no se encontró sesgo de publicación.
ConclusiónLos microARN circulantes pueden utilizarse como un biomarcador no invasivo prometedor para el diagnóstico de la EA.
Alzheimer's disease (AD) is one of the most common neurodegenerative diseases that usually affects people over the age of 65. It is estimated that AD affects more than 35 million people worldwide, and its incidence is estimated to triple by 2050.1 China, Western Europe, United States and the developing Western Pacific are the most affected countries.2 AD is characterized pathologically by an accumulation of extracellular amyloid-beta plaques and intracellular neurofibrillary tangles.3 AD has an insidious onset and progressive impairment of behavioral and cognitive functions, including language, memory, comprehension, attention, reasoning, and judgment. The diagnosis of AD has been difficult, the current diagnostic techniques include clinical findings, cognitive testing, biomarker detection and neuroimaging evaluation, but there are still some shortcomings in these diagnostic methods. The currently commonly used National Institute of Neurological and Communication Disorders and Stroke/Alzheimer's disease and Related Disorders Association (NINCDS-ADRDA) has 65–96% sensitivity and 23–88% specificity for the clinical diagnosis of AD,4,5 because other dementias such as Lewy bodies dementia, frontotemporal dementia, and vascular dementia could not be completely excluded.6 Determination of the levels of β-amyloid peptide (Aβ), total tau (t-tau) and phosphorylated tau (p-tau) in cerebrospinal fluid (CSF) is used as a specific biomarker of AD, however, the process of lumbar puncture to extract CSF is invasive and complicated, which limits its clinical application. In addition, many studies have shown that the use of positron emission tomography (PET) scanning for Aβ imaging may be a promising method in diagnosis, but its high cost and professional technology do not have general clinical applications. Therefore, it is essential to find a low-risk, high-precision and non-invasive biomarker to make up for the shortcomings of the existing AD detection methods.
MicroRNAs (miRNAs) are a class of small non-coding RNAs of 20–22 nucleotides in length, which regulate gene expression by mediating the degradation of other target mRNAs.7 MiRNA was involved in various cellular and metabolic biological processes, including cell development, proliferation, differentiation, apoptosis and survival,8 which implicated in various neurodegenerative diseases such as AD, Parkinson's disease, Huntington's disease, schizophrenia and amyotrophic lateral sclerosis.9 In recent years, miRNA has attracted attention because of its strong specificity, repeatability and accuracy, and are widely used in clinical practice.10 Peripheral blood miRNAs are noninvasive, easily accessible and cost-effective, so they have become highly anticipated new biomarkers. Many studies have identified the possibility of peripheral blood miRNA as effective non-invasive biomarkers for AD diagnosis. Kumar et al.11 proposed that the up-regulated miR-15b-5p can be used as a high-efficiency biomarker for AD with a sensitivity of 85% and a specificity of 86%. However, Cosín-Tomás et al.12 found that the down-regulated miR-15b-5p has moderate diagnostic efficiency for AD with a sensitivity of 72% and a specificity of 71%. The reasons for the up-regulation and down-regulation of the same miRNA (miR15b-5p) in different articles may be as follows. First, data normalization used to remove variation across samples can minimize systematic technical or experimental variation and thus inappropriate normalization of the data can lead to incorrect conclusions.13 Second, the results of a single study may be influenced by variability in sample collection and processing, RNA isolation, the expression profiling platform.13 Third, miRNA expression is affected by many factors, such as genetics, environment, body mass index, age, etc. In addition, the combination of miR-15b-5p, miR-545-3p and let-7g-5p showed an excellent diagnostic value of AD with a sensitivity of 94% and a specificity of 95%.11 The diagnostic efficacy of miRNA for AD is satisfactory but inconsistent, which requires further validation. The reason may be due to ethnic variability, different test method standards, small number of clinical samples, differences in sample type, and lack of multi-center data demonstration. Therefore, we carried out this meta-analysis to evaluate the diagnostic accuracy of circulating miRNAs in the diagnosis of AD patients.
Materials and methodsSearch strategy and study selectionThe meta-analysis was conducted based on the PRISMA statement.14 We performed a systematic literature search of the following databases: PubMed, EMBASE, Web of Science, Cochrane Library, Wanfang database and China National Knowledge Infrastructure (CNKI). The following medical subject headlines (MeSH) terms and keywords were used for literature retrieval: “Alzheimer's disease” or “AD” or “dementia of the Alzheimer's type” or “Alzheimer dementia” and “microRNA” or “miRNA” or “miR”. The searches were limited to publications with human subjects without language restriction, and the last search was conducted on 15/03/2021. In order to make the article search more comprehensive, we manually searched the references listed in the original article and the retrieved review articles.
Inclusion and exclusion criteriaTwo independent investigators screened literatures based on the inclusion and exclusion criteria. The inclusion criteria were as follows: (1) studies aim to evaluated the diagnostic accuracy of miRNAs in the diagnosis of AD; (2) all included patients were diagnosed with AD based on NINCDS-ADRDA15; (3) the age and sex matched neurologically healthy volunteers with no cognitive impairment or abnormal mental symptoms were enrolled as controls; (4) miRNA levels were measured from peripheral blood samples: whole blood, serum or plasma; (5) studies contained sufficient data on sample size, sensitivity and specificity to construct a diagnostic two-by-two table. The exclusion criteria were as follows: (1) miRNAs obtained from cell lines, animals, brain tissue or CSF; (2) studies without a comparison group; (3) duplicate reports; (4) publications with incomplete information; (5) reviews, case reports, comments and letters to the editors; and (6) systematic reviews or meta-analysis.
Data extraction and quality assessment of included studiesTwo investigators independently selected and screened relevant studies, and if the study was collected by either of the investigators, it was reviewed for further assessment. The following information were extracted from each eligible study: the first author's name, publication year, country, miRNA according to number, differentiated expression (up or downregulated), sample size (number of patients with AD and healthy controls), specimen source (serum or plasma o PMBC), as well as relevant statistical data and methodological quality information. The quality of included studies was independently conducted by two investigators using the Quality Assessment for Diagnostic Accuracy Studies-2 (QUADAS-2) tool,16 any disagreement was resolved by consultation with a third author, and a consensus was finally reached.
Statistical analysisAll statistical analyses were carried out by STATA version 15.1 and Review Manager 5.3. The number of true positive (TP), false positive (FP), true negative (TN) and false negative (FN) in patients from each study was extracted to estimate the pooled sensitivity, specificity, positive likelihood ratio (PLR), negative likelihood ratio (NLR), diagnostic odds ratio (DOR), and area under the summary receiver operating characteristic curve (AUC). The heterogeneity between these studies was evaluated by Higgins's inconsistency index (I2) statistic. If I2>50%, indicated that there was significant heterogeneity, and then a random effects model was applied to the research. To explore the potential sources of heterogeneity, meta-regression analysis and subgroup analysis were performed. At last, Deek's funnel plots were used to explore the potential publication bias, where p<0.05 was considered to be statistically significant.
ResultsLiterature screeningA total of 5111 articles were retrieved from the primary literature search strategy, among which PubMed (n=1251), Embase (n=2035), Web of Science (n=735), Cochrane Library (n=7), Wan-fang database (n=39), and China National Knowledge Infrastructure (CNKI) (n=1044). After removed 923 duplicates, 4188 articles were left for detection. After reviewing titles and abstracts manually, irrelevant studies (n=3124), animal experiments or linear cell studies (n=681), review, letters o case report (n=291) were excluded. Then, we read the full texts carefully of the remaining 92 articles and 74 articles were excluded due to not a case-control study (n=51) o insufficient data (n=23). Finally, 62 studies from 18 articles were included in this meta-analysis. The detailed flow chart of the literature search is shown in Fig. 1.
Study characteristics and quality assessments
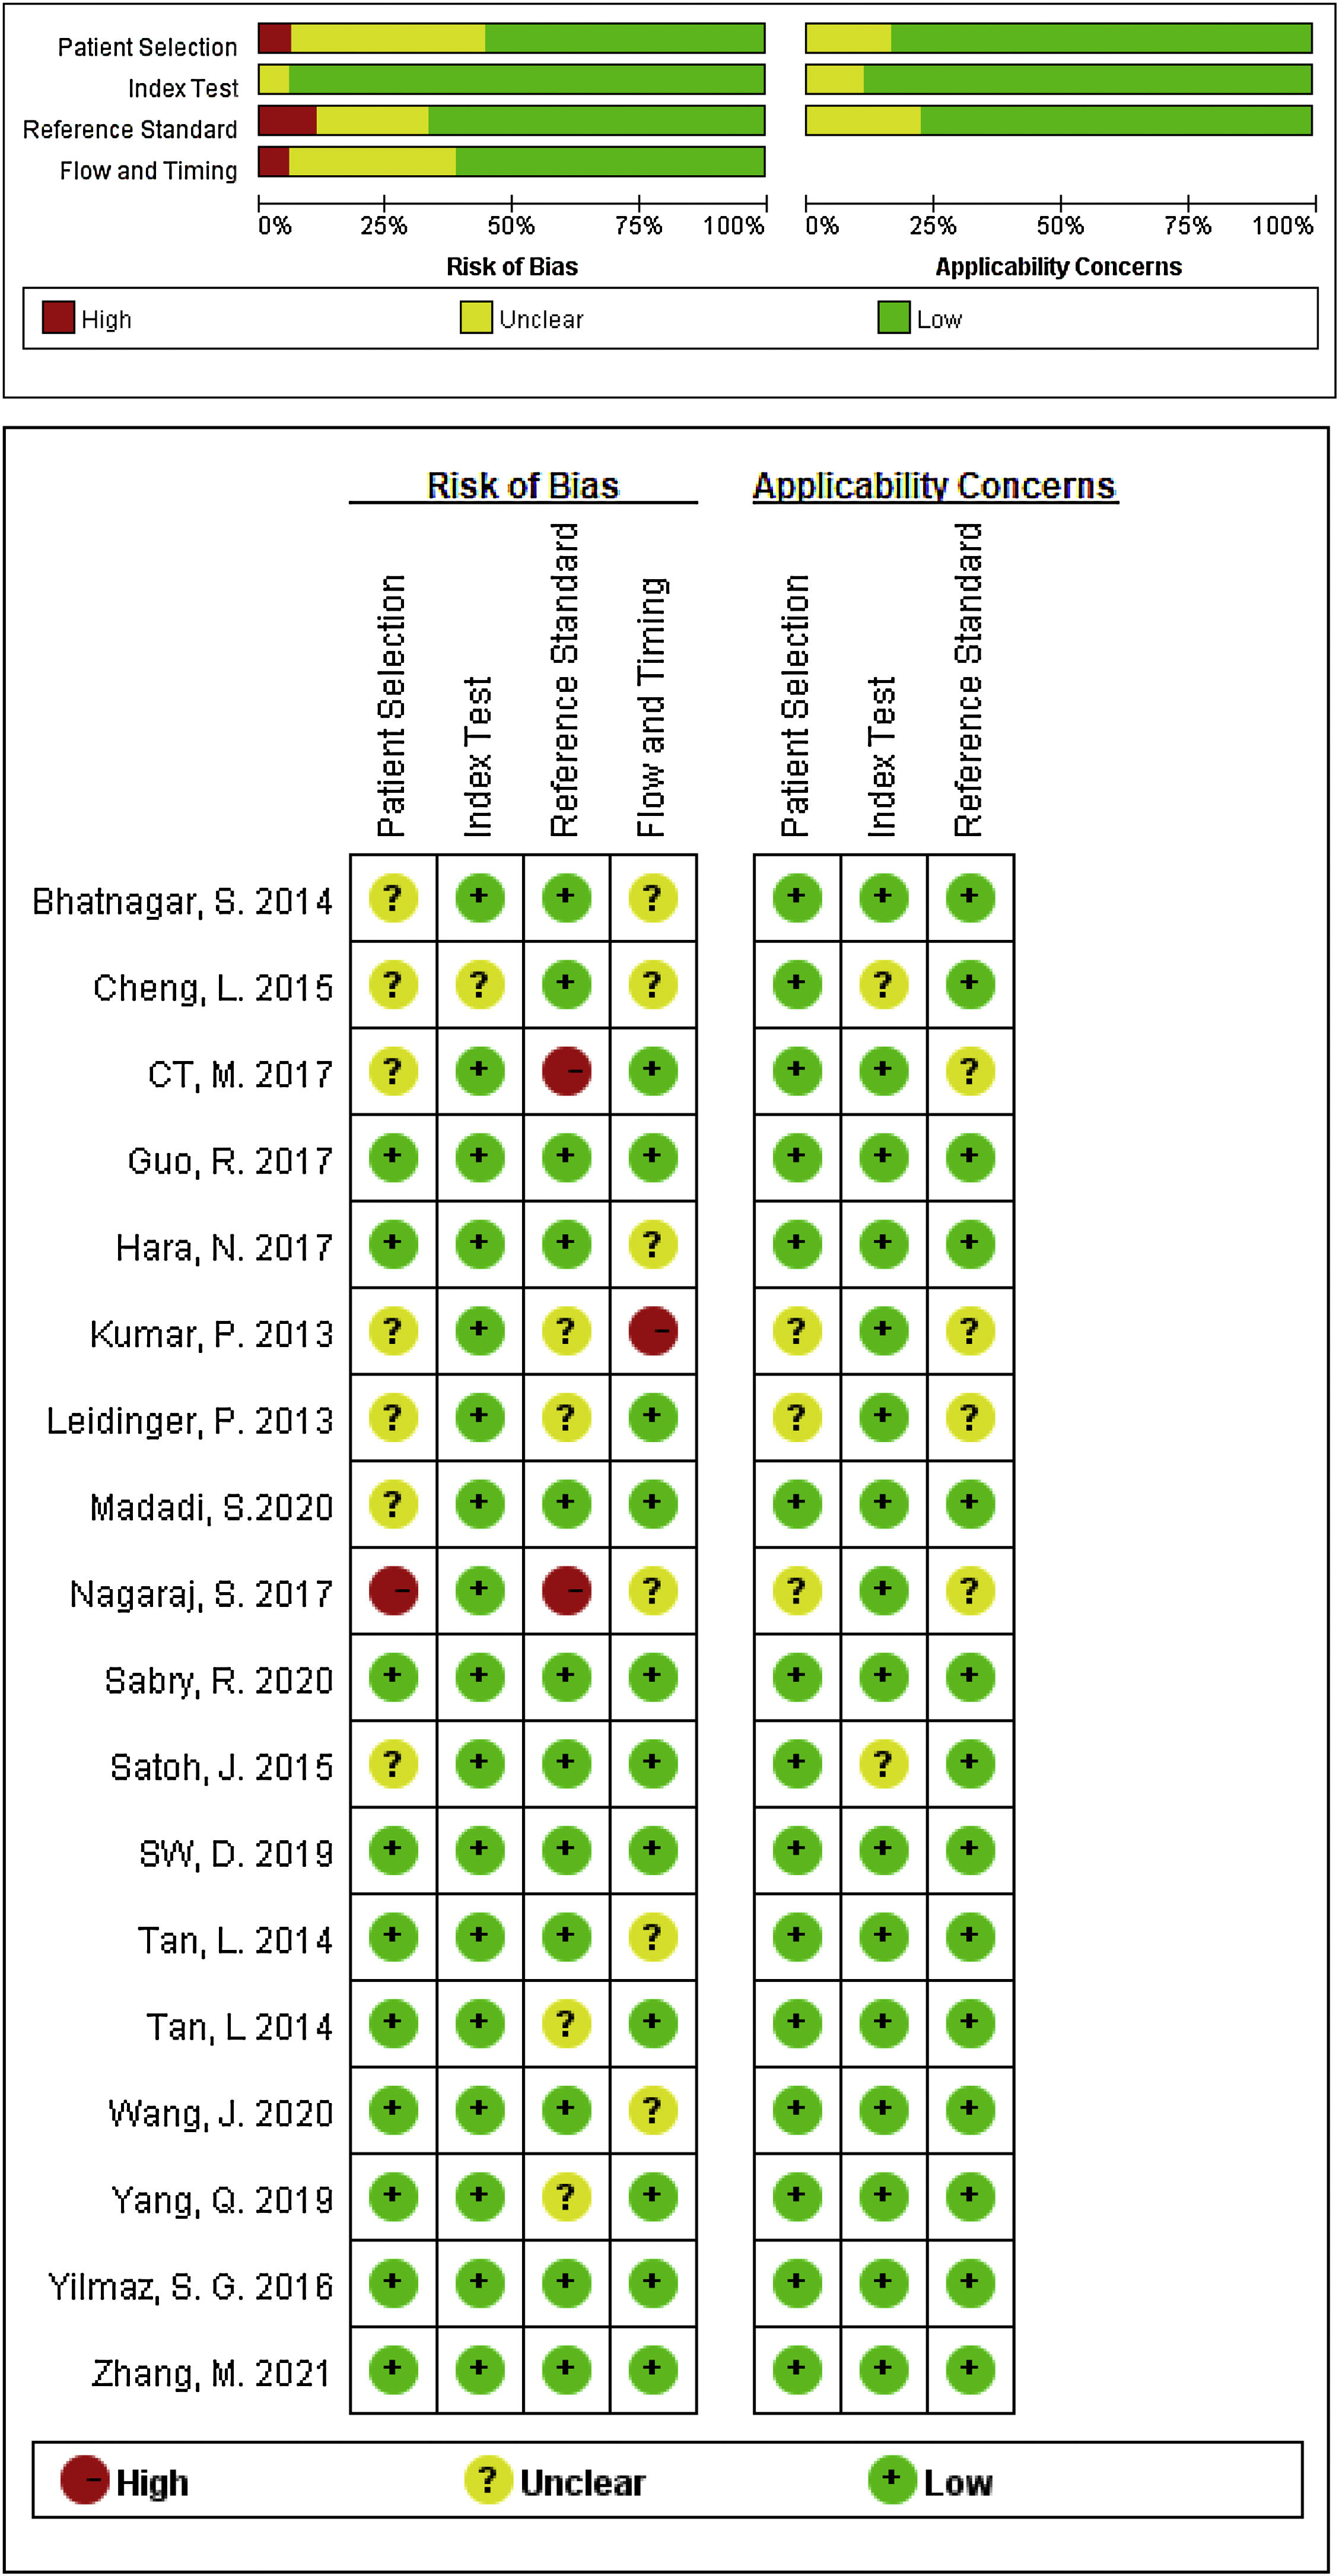
The main characteristics of the 62 included studies were summarized in Table 1, ranging from 2013 to 2021. A total of 3953 AD patients and 3035 healthy controls evaluated the diagnostic accuracy of miRNAs in differentiating AD patients from cognitively normal controls. A total of 44 miRNA studies focused on a single miRNA, and 18 studies involved miRNA clusters. Among the included studies, the expression of miRNA was extracted from serum (n=19), plasma (n=37) and PBMC (n=6) by using the quantitative reverse transcription PCR (qRT-PCR). 41 studies were conducted with Caucasian populations, and 21 studies with Asian populations. The methodological quality assessments of the included articles according to QUADAS-2 tool were summarized in Fig. 2.
Characteristics of the included studies.
| Author | Year | Country | microRNAs | Regulation mode | Sample size | Speci-men | Diagnostic power | |||
|---|---|---|---|---|---|---|---|---|---|---|
| AD | Healthy | Sen | Spe | AUC | ||||||
| Single miRNA | ||||||||||
| Kumar, P.11 | 2013 | USA | miR-15b-5p | Up | 20 | 17 | Plasma | 0.85 | 0.88 | 0.96 |
| Kumar, P.11 | 2013 | USA | miR-142-3p | Up | 20 | 17 | Plasma | 0.65 | 1.00 | 0.96 |
| Kumar, P.11 | 2013 | USA | miR-191-5p | Up | 20 | 17 | Plasma | 0.95 | 0.76 | 0.95 |
| Kumar, P.11 | 2013 | USA | Let-7g-5p | Up | 20 | 17 | Plasma | 0.95 | 0.53 | 0.93 |
| Kumar, P.11 | 2013 | USA | Let-7d-5p | Up | 20 | 17 | Plasma | 0.75 | 0.88 | 0.92 |
| Bhatnagar, S.17 | 2014 | USA | miR-34a | Up | 22 | 27 | Plasma | 0.84 | 0.74 | 0.81 |
| Bhatnagar, S.17 | 2014 | USA | miR-34c | Up | 22 | 27 | Plasma | 0.92 | 0.96 | 0.99 |
| Tan, L.18 | 2014 | China | miR-125b | Up | 105 | 150 | Serum | 0.81 | 0.68 | 0.85 |
| Tan, L.19 | 2014 | China | miR-342-3p | Down | 158 | 155 | Serum | 0.82 | 0.70 | 0.93 |
| Yilmaz, S. G.20 | 2016 | Turkey | miR-9-5p | Down | 172 | 109 | PBMC | 0.59 | 0.59 | 0.64 |
| Yilmaz, S. G.20 | 2016 | Turkey | miR-106a-5p | Down | 172 | 109 | PBMC | 0.68 | 0.93 | 0.79 |
| Yilmaz, S. G.20 | 2016 | Turkey | miR-106b-5p | Down | 172 | 109 | PBMC | 0.61 | 0.68 | 0.63 |
| Yilmaz, S. G.20 | 2016 | Turkey | miR-107 | Down | 172 | 109 | PBMC | 0.64 | 0.62 | 0.69 |
| Guo, R.21 | 2017 | China | miR-26a-5p | Down | 121 | 86 | Serum | 0.85 | 0.57 | 0.75 |
| Guo, R.21 | 2017 | China | miR-181c-3p | Down | 121 | 86 | Serum | 0.72 | 0.73 | 0.78 |
| Guo, R.21 | 2017 | China | miR-126-5p | Down | 121 | 86 | Serum | 0.73 | 0.61 | 0.72 |
| Guo, R.21 | 2017 | China | miR-22-3p | Down | 121 | 86 | Serum | 0.82 | 0.71 | 0.85 |
| Guo, R.21 | 2017 | China | miR-148b-5p | Down | 121 | 86 | Serum | 0.65 | 0.72 | 0.72 |
| Guo, R.21 | 2017 | China | miR-106b-3p | Up | 121 | 86 | Serum | 0.76 | 0.76 | 0.83 |
| Guo, R.21 | 2017 | China | miR-6119-5p | Up | 121 | 86 | Serum | 0.75 | 0.70 | 0.79 |
| Guo, R.21 | 2017 | China | miR-1246 | Up | 121 | 86 | Serum | 0.52 | 0.91 | 0.77 |
| Guo, R.21 | 2017 | China | miR-660-5p | Up | 121 | 86 | Serum | 0.50 | 0.83 | 0.70 |
| Hara, N.22 | 2017 | Japan | miR-501-3p | Down | 36 | 22 | Serum | 0.53 | 1.00 | 0.82 |
| Nagaraj, S.23 | 2017 | Poland | miR-151a-5p | Down | 13 | 9 | Plasma | 1.00 | 0.77 | 0.90 |
| Nagaraj, S.23 | 2017 | Poland | miR-30b-5p | Down | 13 | 9 | Plasma | 0.84 | 0.88 | 0.88 |
| Nagaraj, S.23 | 2017 | Poland | miR-486-5p | Up | 13 | 9 | Plasma | 1.00 | 0.89 | 0.93 |
| Nagaraj, S.23 | 2017 | Poland | miR-33a-5p | Down | 13 | 9 | Plasma | 0.85 | 0.78 | 0.78 |
| Nagaraj, S.23 | 2017 | Poland | miR-483-5p | Up | 13 | 9 | Plasma | 0.92 | 1.00 | 0.99 |
| Nagaraj, S.23 | 2017 | Poland | miR-18a-5p | Down | 13 | 9 | Plasma | 0.92 | 0.67 | 0.79 |
| Nagaraj, S.23 | 2017 | Poland | miR-320a | Up | 13 | 9 | Plasma | 0.69 | 0.67 | 0.65 |
| Nagaraj, S.23 | 2017 | Poland | miR-320b | Up | 13 | 9 | Plasma | 0.61 | 1.00 | 0.83 |
| Nagaraj, S.23 | 2017 | Poland | miR-320c | Up | 13 | 9 | Plasma | 0.38 | 1.00 | 0.67 |
| CT, M.12 | 2017 | Spain | miR-34a-5p | Down | 21 | 21 | Plasma | 0.76 | 0.71 | 0.77 |
| CT, M.12 | 2017 | Spain | miR-545-3p | Down | 21 | 21 | Plasma | 0.94 | 0.76 | 0.75 |
| CT, M.12 | 2017 | Spain | miR-15b-5p | Down | 21 | 21 | Plasma | 0.72 | 0.71 | 0.75 |
| SW, D.24 | 2019 | Spain | miR-92a-3p | Up | 56 | 14 | Plasma | 0.47 | 0.93 | 0.70 |
| SW, D.24 | 2019 | Spain | miR-181c-5p | Up | 56 | 14 | Plasma | 0.70 | 0.86 | 0.78 |
| SW, D.24 | 2019 | Spain | miR-210-3p | Up | 56 | 14 | Plasma | 0.81 | 0.71 | 0.80 |
| Yang, Q.25 | 2019 | China | miR-133b | Down | 105 | 98 | Serum | 0.91 | 0.74 | 0.91 |
| Sabry, R.26 | 2020 | Egypt | miRNA-483-5p | Up | 40 | 20 | Plasma | 0.90 | 0.90 | 0.90 |
| Wang, J.27 | 2020 | China | miR-103 | Down | 120 | 120 | Plasma | 0.80 | 0.84 | 0.89 |
| Wang, J.27 | 2020 | China | miR-107 | Down | 120 | 120 | Plasma | 0.78 | 0.59 | 0.74 |
| Madadi, S.28 | 2020 | Iran | miR-106b | Down | 56 | 50 | Serum | 0.94 | 0.62 | 0.80 |
| Zhang, M.29 | 2021 | China | miR-128 | Up | 117 | 106 | Serum | 0.87 | 0.82 | 0.83 |
| miRNA clusters | ||||||||||
| Kumar, P.11 | 2013 | USA | miR-545-3p+let-7g-5p+miR-15b-5p | Up | 20 | 17 | Plasma | 0.94 | 0.95 | 0.95 |
| Kumar, P.11 | 2013 | USA | miR-545-3p+miR-15b-5p | Up | 20 | 17 | Plasma | 0.90 | 0.94 | 0.97 |
| Kumar, P.11 | 2013 | USA | miR-301a-3p+miR-545-3p+let-7g-5p+miR-15b-5p | Up | 20 | 17 | Plasma | 0.95 | 0.88 | 0.97 |
| Kumar, P.11 | 2013 | USA | miR-191-5p+miR-15b-5p | Up | 20 | 17 | Plasma | 0.95 | 0.82 | 0.96 |
| Kumar, P.11 | 2013 | USA | miR-191-5p+miR-301a-3p+miR-545-3p | Up | 20 | 17 | Plasma | 0.95 | 0.82 | 0.96 |
| Kumar, P.11 | 2013 | USA | miR-191-5p+miR-301a-3p+miR-545-3p+miR-15b-5p | Up | 20 | 17 | Plasma | 0.95 | 0.82 | 0.96 |
| Kumar, P.11 | 2013 | USA | let-7g-5p+miR-15b-5p | Up | 20 | 17 | Plasma | 0.95 | 0.82 | 0.94 |
| Kumar, P.11 | 2013 | USA | miR-301a-3p+let-7g-5p+miR-15b-5p | Up | 20 | 17 | Plasma | 0.95 | 0.82 | 0.93 |
| Leidinger, P.30 | 2013 | Germany | 12 miRNA clusters | Up | 48 | 22 | PBMC | 0.92 | 0.95 | 0.93 |
| Tan, L.19 | 2014 | China | miR-9/miR-125b | Down | 105 | 150 | Serum | 0.80 | 0.71 | 0.81 |
| Tan, L.19 | 2014 | China | miR-9/miR-181c | Down | 105 | 150 | Serum | 0.64 | 0.74 | 0.73 |
| Cheng, L.31 | 2015 | China | 16 miRNA clusters | Up | 15 | 35 | Serum | 0.87 | 0.77 | 0.86 |
| Satoh, J.32 | 2015 | Japan | 27 miRNA clusters | Up | 48 | 22 | PBMC | 0.71 | 0.82 | 0.80 |
| Guo, R.21 | 2017 | China | 9 miRNA clusters | Up | 121 | 86 | Serum | 0.93 | 0.99 | 0.99 |
| SW, D.24 | 2019 | Spain | miR-92a-3p/miR-210-3p | Up | 56 | 14 | Plasma | 0.88 | 0.64 | 0.81 |
| SW, D.24 | 2019 | Spain | miR-92a-3p/miR-181c-5p | Up | 56 | 14 | Plasma | 0.84 | 0.71 | 0.79 |
| SW, D.24 | 2019 | Spain | miR-181c-5p/miR-210-3p | Up | 56 | 14 | Plasma | 0.84 | 0.79 | 0.85 |
| SW, D.24 | 2019 | Spain | miR-92a-3p/miR-181c-5p/miR-210-3p | Up | 56 | 14 | Plasma | 0.93 | 0.71 | 0.86 |
Note: Up: up-regulated, Down: down-regulated, Sen: Sensitivity, Spe: Specificity, AUC: area under the curve, PBMC: peripheral blood mononuclear cells.

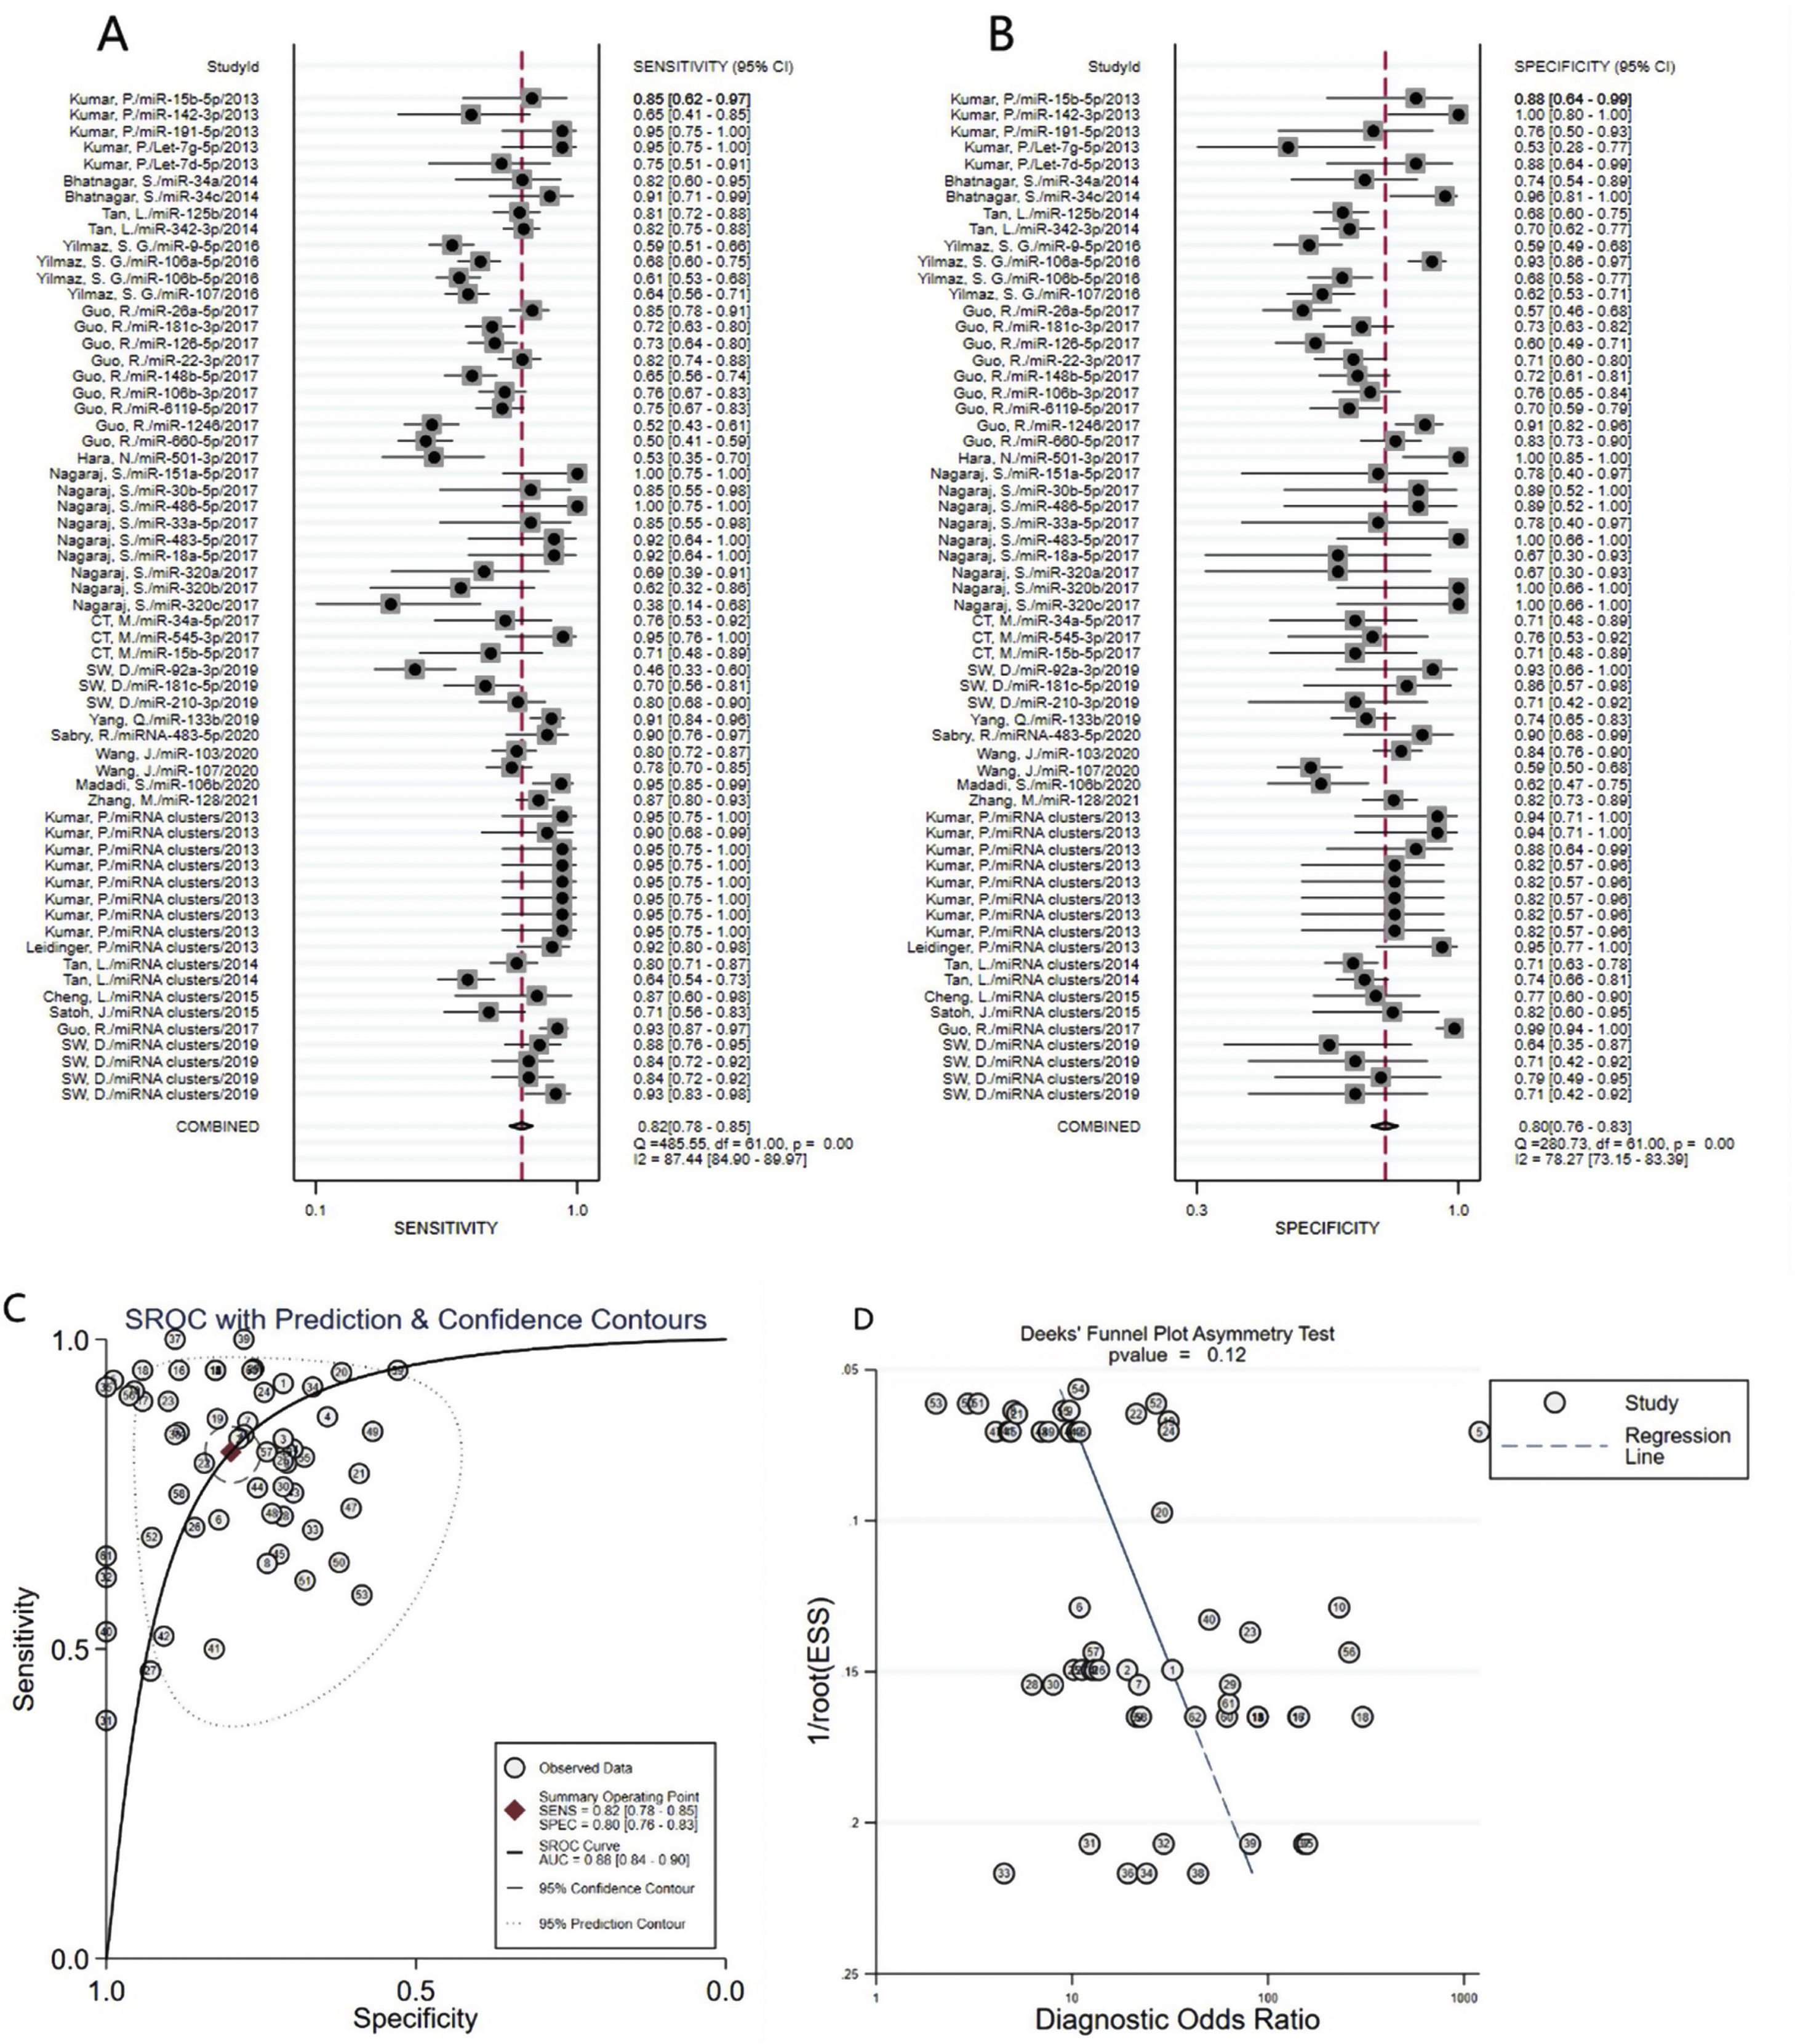
A total of 3953 AD patients and 3035 healthy controls evaluated the diagnostic accuracy of miRNAs in AD patients were included in the pooled analysis. According to the analysis of heterogeneity, the I2 test showed the significantly heterogeneity between study (I2=87.4% for sensitivity and I2=78.3% for specificity), and therefore the random effects model was used in our meta-analysis. The pooled sensitivity was 0.82 (95% CI: 0.78–0.85), specificity was 0.80 (95% CI: 0.76–0.83), PLR was 4. 1 (95% CI: 3.4–4.9), NLR was 0.23 (95% CI: 0.19–0.28), DOR was 18 (95% CI: 13–25) and AUC was 0.88 (95% CI: 0.84–0.90) (Fig. 3A–C) These results indicated that miRNAs could distinguish AD patients from healthy controls with good diagnostic accuracy.
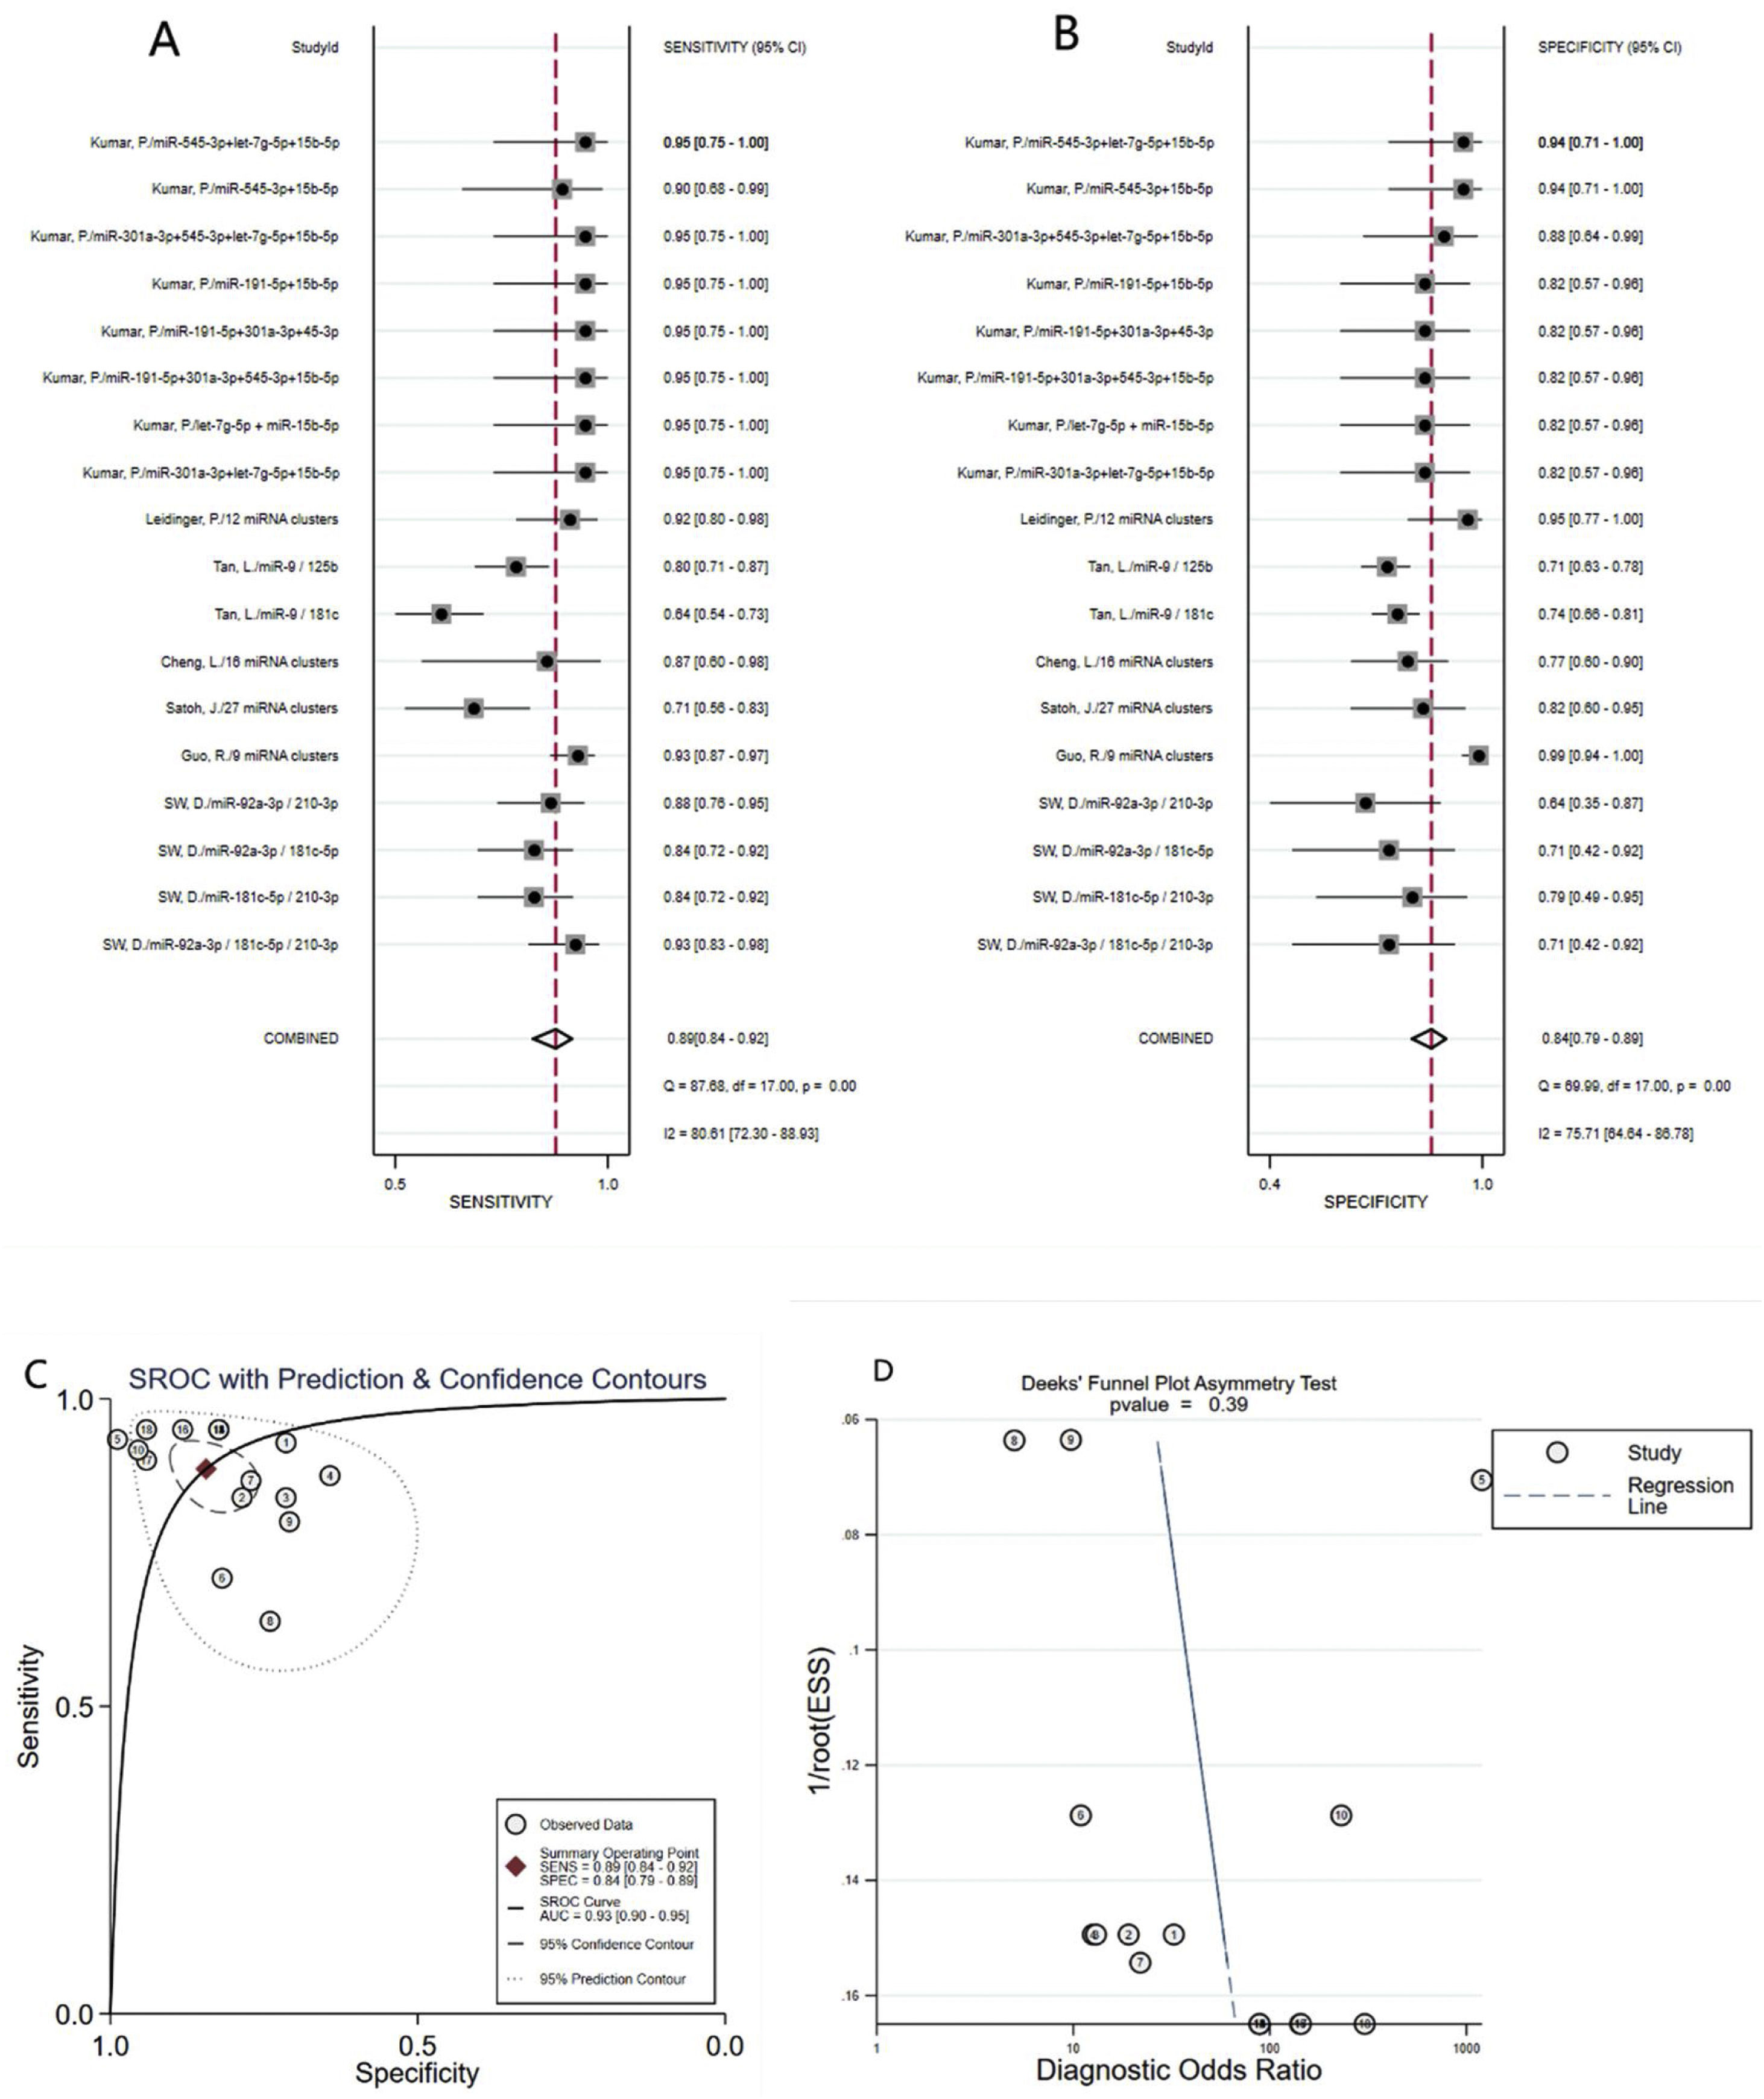
Diagnostic value of miRNA clusters in AD patients, specificity (B), AUC (C) and Funnel plot (D) of miRNAs for diagnosing AD patients from healthy controls among overall studies.")
A total of 18 studies (including 826 AD patients and 658 healthy controls) evaluated the diagnostic value of miRNA clusters in AD patients. The pooled sensitivity was 0.89 (95% CI:0.84–0.92), specificity was 0.84 (95% CI: 0.79–0.89), PLR was 5.7 (95% CI: 4.0–8.1), NLR was 0.14 (95% CI:0.09–0.20), DOR was 42 (95% CI: 22–82), and AUC was 0.93 (95% CI: 0.90–0.95) (Fig. 4A–C). The results show that miRNA clusters had an excellent diagnostic accuracy in AD diagnosis.
Meta-regression analysis and subgroup analysis, specificity (B), AUC (C) and Funnel plot (D) of miRNA clusters for diagnosing AD patients from healthy controls.")
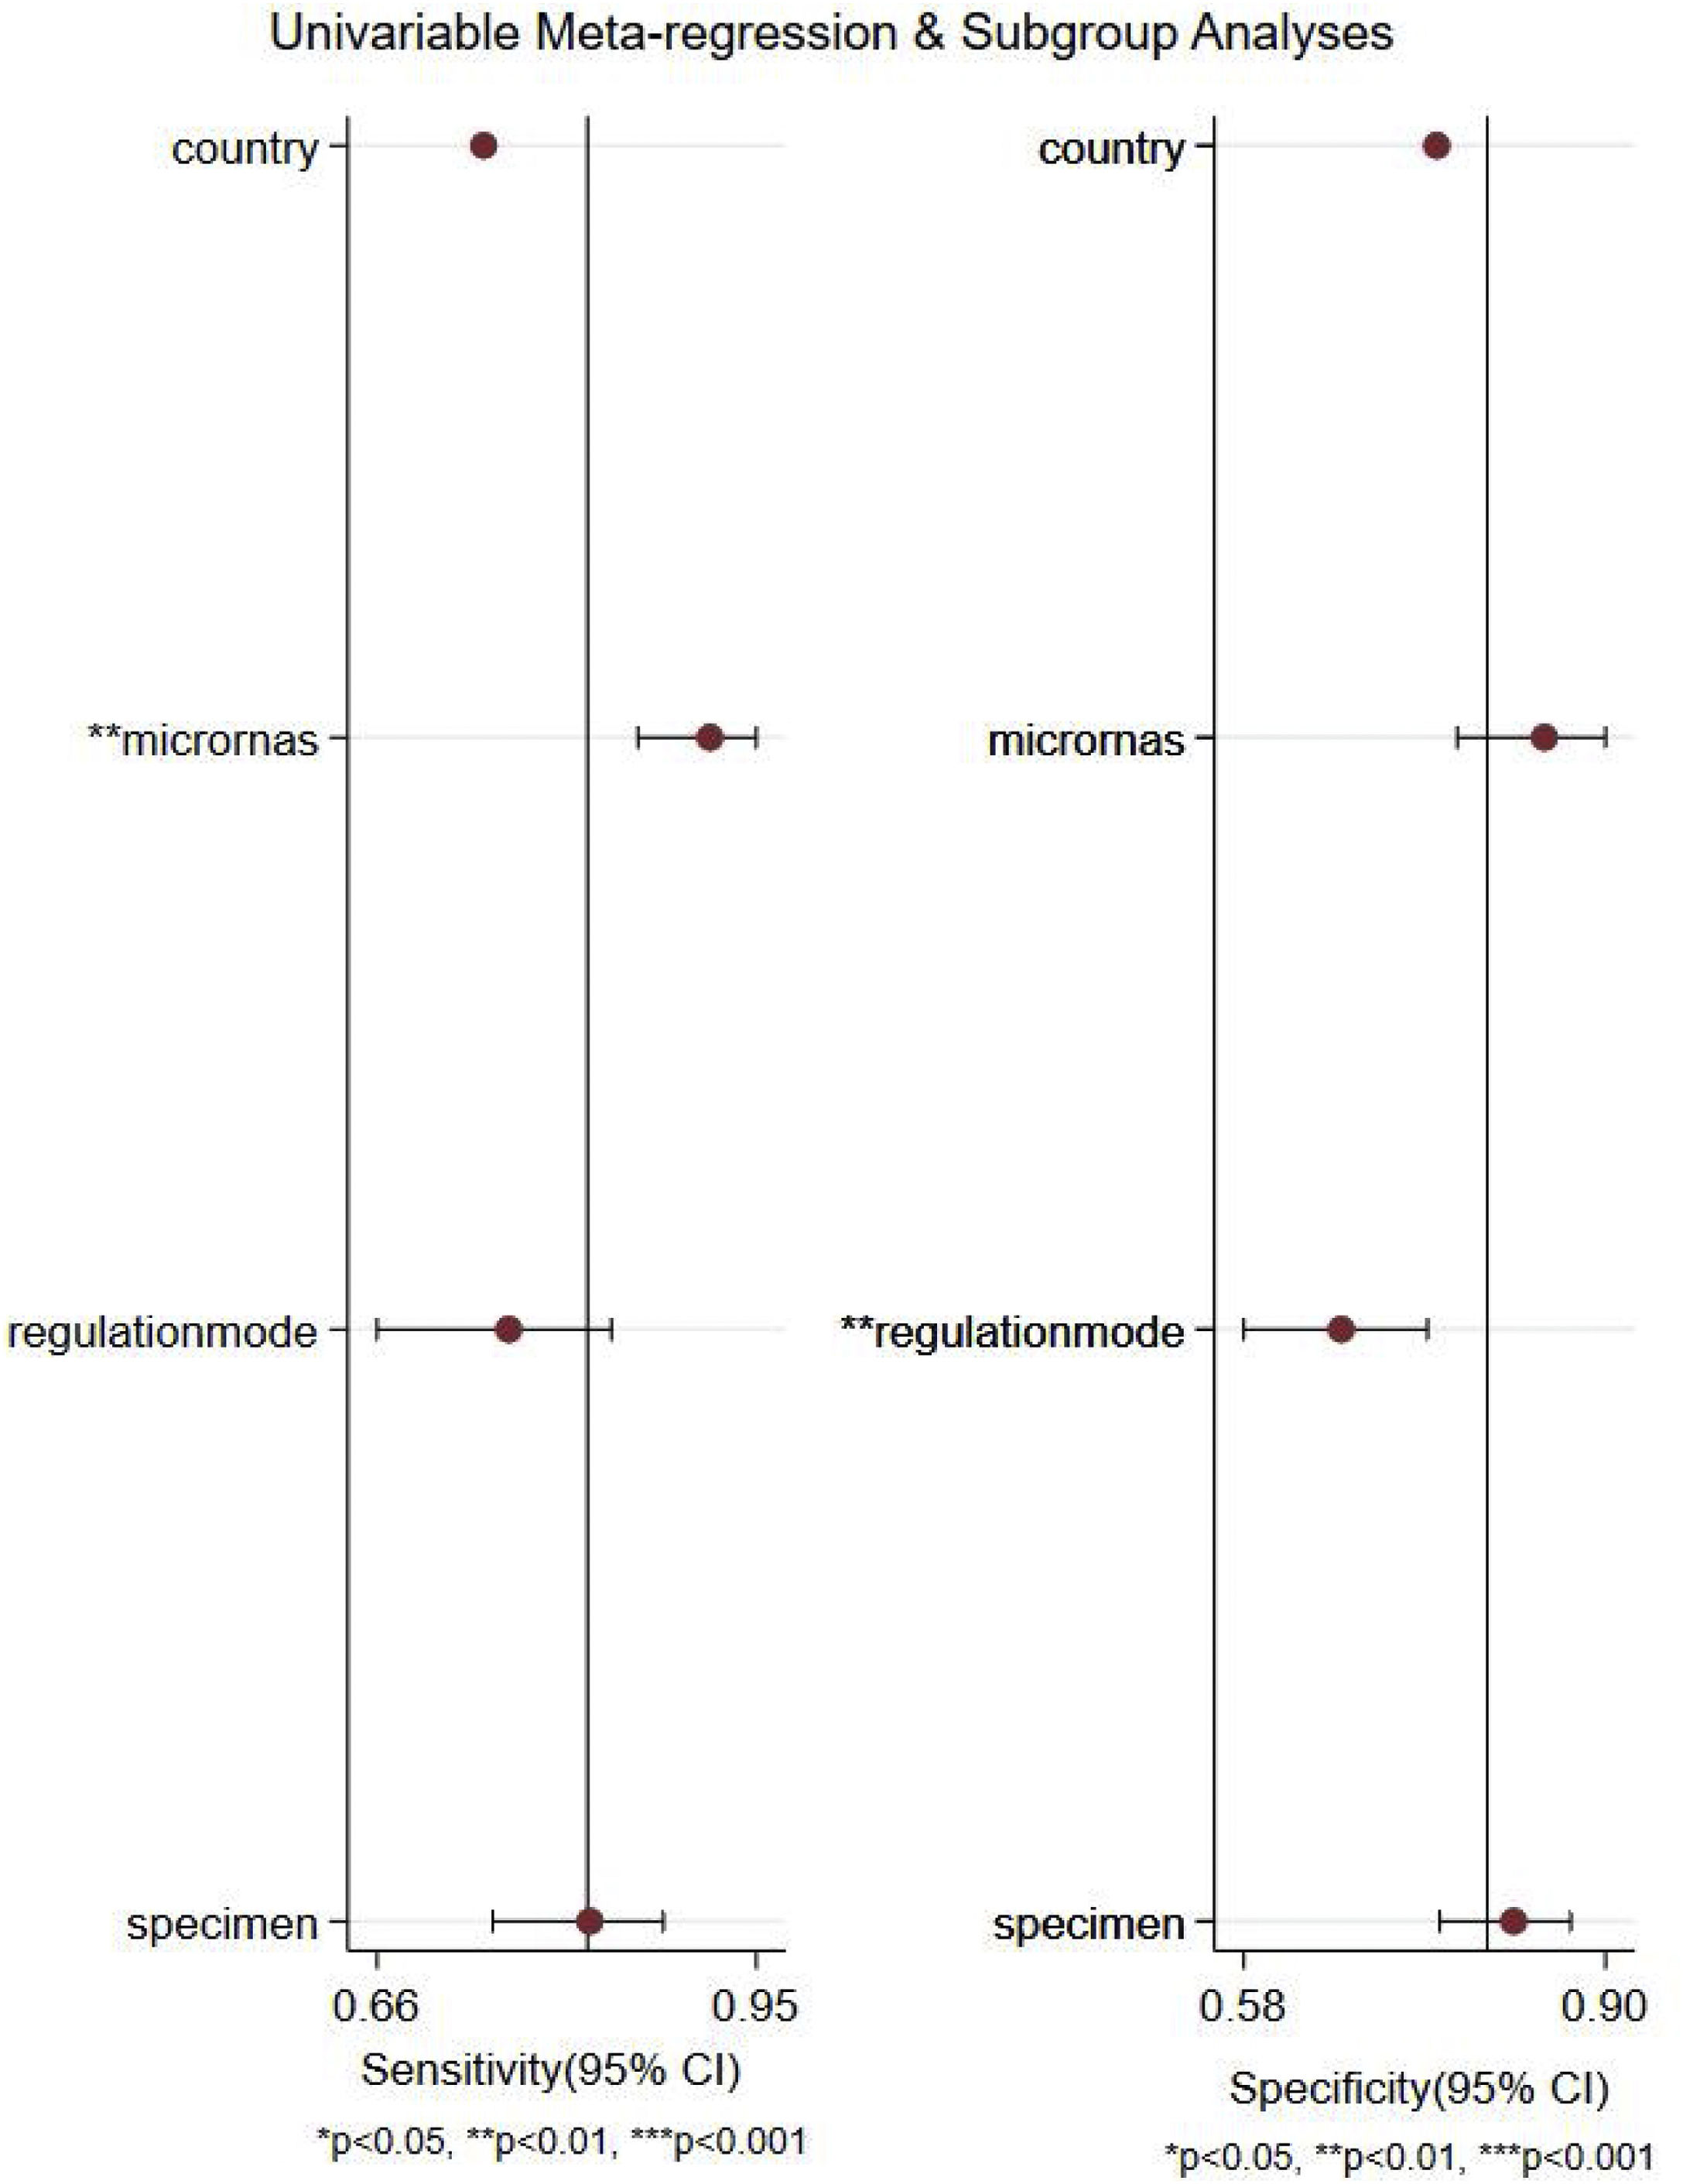
We performed a meta-regression analysis to explore possible sources of between-study heterogeneity in sensitivity and specificity. As shown in Fig. 5, the results of meta-regression analysis suggested that microRNA profiling might explain heterogeneity in sensitivity (p<0.01), and regulation mode might be potential sources of heterogeneity in specificity (p<0.01).

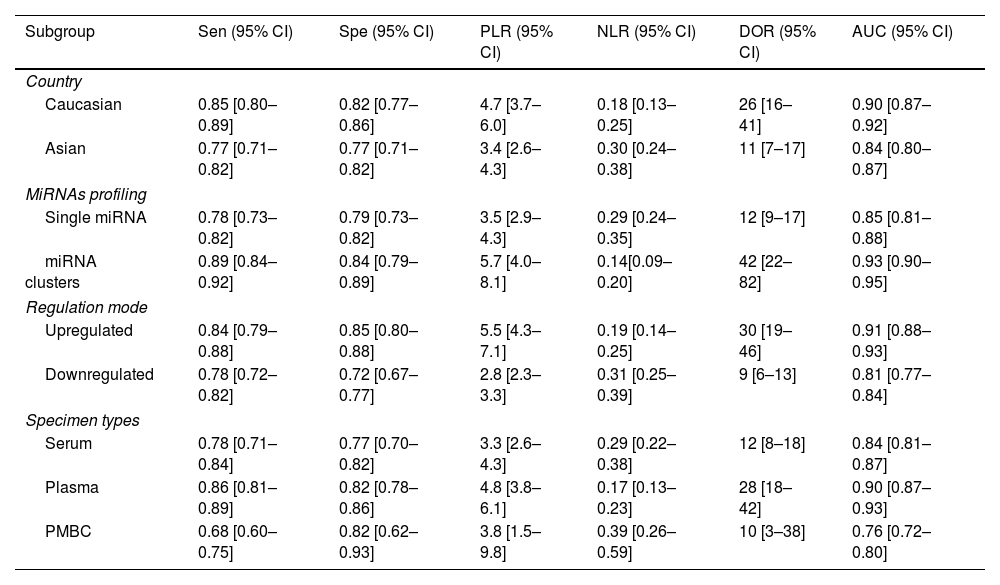
Furthermore, subgroup analyses were also performed to find the sources of heterogeneity based on the country, miRNA profiling, regulation mode and specimen types. As described in Table 2, miRNA cluster showed a better diagnostic accuracy than single ones, with a sensitivity (0.89 vs. 0.78), specificity (0.84 vs. 0.79), PLR (5.7 vs. 3.5), NLR (0.14 vs. 0.29), DOR (42 vs. 12), and AUC (0.93 vs. 0.85). In addition, upregulated miRNA showed a higher diagnostic value than downregulated miRNA, with a sensitivity (0.84 vs. 0.78), specificity (0.85 vs. 0.72), PLR (5.5 vs. 2.8), NLR (0.19 vs. 0.31), DOR (30 vs. 9) and AUC (0.91 vs. 0.81). Moreover, plasma types showed a better diagnostic accuracy than serum and PMBC types, with a sensitivity, specificity, PLR, NLR, DOR, AUC being 0.86, 0.82, 4.8, 0.17, 28, 0.90, respectively. Apart from that, miRNA yield a better diagnosis accuracy in the Caucasian populations than Asian race, with a sensitivity (0.85 vs. 0.77), specificity (0.82 vs. 0.77), PLR (4.7 vs. 3.4), NLR (0.18 vs. 0.30), DOR (26 vs. 11) and AUC (0.90 vs. 0.84).
Summary estimates of diagnostic power and their 95% confidence intervals.
| Subgroup | Sen (95% CI) | Spe (95% CI) | PLR (95% CI) | NLR (95% CI) | DOR (95% CI) | AUC (95% CI) |
|---|---|---|---|---|---|---|
| Country | ||||||
| Caucasian | 0.85 [0.80–0.89] | 0.82 [0.77–0.86] | 4.7 [3.7–6.0] | 0.18 [0.13–0.25] | 26 [16–41] | 0.90 [0.87–0.92] |
| Asian | 0.77 [0.71–0.82] | 0.77 [0.71–0.82] | 3.4 [2.6–4.3] | 0.30 [0.24–0.38] | 11 [7–17] | 0.84 [0.80–0.87] |
| MiRNAs profiling | ||||||
| Single miRNA | 0.78 [0.73–0.82] | 0.79 [0.73–0.82] | 3.5 [2.9–4.3] | 0.29 [0.24–0.35] | 12 [9–17] | 0.85 [0.81–0.88] |
| miRNA clusters | 0.89 [0.84–0.92] | 0.84 [0.79–0.89] | 5.7 [4.0–8.1] | 0.14[0.09–0.20] | 42 [22–82] | 0.93 [0.90–0.95] |
| Regulation mode | ||||||
| Upregulated | 0.84 [0.79–0.88] | 0.85 [0.80–0.88] | 5.5 [4.3–7.1] | 0.19 [0.14–0.25] | 30 [19–46] | 0.91 [0.88–0.93] |
| Downregulated | 0.78 [0.72–0.82] | 0.72 [0.67–0.77] | 2.8 [2.3–3.3] | 0.31 [0.25–0.39] | 9 [6–13] | 0.81 [0.77–0.84] |
| Specimen types | ||||||
| Serum | 0.78 [0.71–0.84] | 0.77 [0.70–0.82] | 3.3 [2.6–4.3] | 0.29 [0.22–0.38] | 12 [8–18] | 0.84 [0.81–0.87] |
| Plasma | 0.86 [0.81–0.89] | 0.82 [0.78–0.86] | 4.8 [3.8–6.1] | 0.17 [0.13–0.23] | 28 [18–42] | 0.90 [0.87–0.93] |
| PMBC | 0.68 [0.60–0.75] | 0.82 [0.62–0.93] | 3.8 [1.5–9.8] | 0.39 [0.26–0.59] | 10 [3–38] | 0.76 [0.72–0.80] |
Sen: sensitivity, Spe: specificity, PLR: positive likelihood ratios, NLR: negative likelihood ratios, DOR: diagnostic odds ratio, AUC: area under the curve, CI: confidence interval, PBMC: peripheral blood mononuclear cells.
The publication bias of the included studies was assessed by Deeks’ funnel plot test. As shown in Figs. 3D and 4D, the pooled Deeks’ test result of the overall study was p=0.12 and the result of microRNA cluster was p=0.39, which suggested no significant publication bias.
DiscussionAlzheimer's disease is the most common cause of dementia in the world and accounts for up to 80% of all dementia diagnoses, its prevalence continues to rise in part because of the aging of the world's population.33 This progressive and irreversible neurodegenerative disease seriously affects cognitive ability and has become a key public health problem, which there is currently no cure. The traditional diagnosis of AD is based on medical history, cognitive impairment tests, and other auxiliary examinations (blood tests and structural imaging of the brain) evaluated through clinical research to rule out non-degeneration causes of symptoms. With the continuous advancement of disease understanding, researchers have begun to pay more attention to biomarkers for early diagnosis of AD. Currently, three biomarkers (Aβ, T-tau, and P-tau) of CSF have been extensively studied and included in modern AD diagnostic research standards, due to their relative high sensitivity and specificity of 85–90%.34 However, the extraction of CSF requires lumbar puncture, which is an invasive operation that limits its general clinical application. Moreover, PET for Aβ imaging cannot be used widely due to it is expensive and not suitable for large-scale screening. Consequently, the ideal biomarkers for the diagnosis of Alzheimer's disease should have the characteristics of easy access, minimal invasiveness, low cost and can be used for large-scale screening. Recently, more and more studies have reported the feasibility of circulating miRNA as the diagnostic efficacy of AD, but there are differences between the findings.20,21,23,26 Therefore, we conducted this meta-analysis to systematically evaluate the diagnostic value of circulating miRNAs for AD diagnosis.
We searched multiple databases thoroughly, and finally conducted a meta-analysis of 62 studies concerning the value of circulating miRNAs in the diagnosis of AD. We find that circulating miRNAs could distinguish AD patients from healthy controls with overall pooled sensitivity was 0.82 (95% CI: 0.78–0.85), specificity was 0.80 (95% CI: 0.76–0.83), PLR was 4. 1 (95% CI: 3.4–4.9), NLR was 0.23 (95% CI: 0.19–0.28), DOR was 18 (95% CI: 13–25) and AUC was 0.88 (95% CI: 0.84–0.90). This indicates that circulating miRNA has good diagnostic accuracy for AD.
Subsequently, we conducted meta-regression and subgroup analysis based on the country, miRNA profiling, regulation mode and specimen types to explore potential sources of heterogeneity. The results of meta-regression analysis suggested that microRNA profiling might explain heterogeneity in sensitivity, and regulation mode might be potential sources of heterogeneity in specificity. Subgroup analyses suggested that miRNA cluster showed a better diagnostic accuracy than single ones, which is consistent with the current research results. Kumar et al.11 found that the diagnostic value of miR-545-3p+miR-15b-5p in AD patients showed sensitivity was 90%, specificity was 94%, and the AUC value was 0.97; Leidinger et al.30 found that 12 miRNA clusters in AD patients have a sensitivity of 92%, a specificity of 95%, and an AUC value of 0.93. A single miRNA has poor specificity and is not only expressed in AD, but also differentially expressed in other diseases. However, miRNA clusters participate in the occurrence and development of diseases through a variety of pathways, and have complex molecular regulation mechanisms, which ultimately form a stable and reliable network diagnostic structure.35 There are many pathways involved in AD, such as axon guidance signal, ephrin receptor signaling, actin cytoskeleton signaling, clathrin-mediated endocytosis signaling, rhoA signal and other pathways. Although these pathways are diverse, they show links to AD pathology.11 Moreover, we also found that plasma types showed a better diagnostic accuracy than serum and PMBC types, this may be due to the fact that more proteins are retained in the plasma for co-separation of miRNA.36 This reminds us that the choice of biological sample type plays an important role in the accuracy of disease diagnosis. In addition, our research suggested that upregulated miRNAs showed slightly better diagnostic performance than downregulated, this may be due to the different statistical methods and different types of miRNAs used in microarray technology. Apart from that, miRNA yield a better diagnosis accuracy in the Caucasian populations than Asian race. Therefore, multi-center research and multi-sample are needed to verify our findings.
This is a comprehensive meta-analysis that includes all the latest research to date, which assessed the diagnostic value of circulating miRNAs for AD. Two researchers independently carried out literature screening and data extraction according to strict inclusion and exclusion criteria. Although we tried our best to avoid publication bias, we acknowledge that this meta-analysis still has limitations. First, although we have adopted a comprehensive search strategy, some valuable studies may be lost, especially some studies with negative results may not be published. Secondly, we did not extract cut-off values, which may lead to inconsistent conclusions. Third, some studies only contain a small number of samples. Fourth, the disease stage of most included AD patients is not clear, and the corresponding data is lacking, so we did not conduct subgroup analysis according to the disease stage. Fifth, the healthy control group with normal cognition was not followed up to ensure that they did not develop clinical cognitive impairment. Finally, most studies come from the USA, China and Europe, the diagnostic value of circulating miRNAs in other countries and regions for AD is still unknown.
ConclusionIn summary, our meta-analysis suggested that circulating microRNAs can be used as a promising non-invasive biomarker in AD diagnosis. The use of miRNA clusters and plasma biological specimens can improve the diagnostic accuracy. In the future, large-scale and multi-center clinical studies are still needed to verify our conclusions, so as to provide new methods for the diagnosis of AD patients.
Authors’ contributionsSSG: prepared the study design; WTZ and GXZ: conducted the literature search, data acquisition and analysis; WTZ, GXZ and SSG provided guidance and technical assistance in data acquisition and analysis; WTZ: drafted the manuscript; SSG: revised the manuscript. All authors read and approved the final version to be published.
Ethics statementOur study did not require an ethical board approval because it is a meta-analysis and it did not contain human or animal trials.
FundingThe author(s) received no financial support for the research, authorship, and/or publication of this article.
Conflict of interestsThe author(s) declared no potential conflicts of interest with respect to the research, authorship, and/or publication of this article.
