


To explore the relationship between scores on the Test Your Memory (TYM) battery and findings from a more exhaustive neurocognitive assessment.
MethodsThe TYM and fourteen psychometric tests were administered to 84 subjects aged 50 or older who attended an outpatient neurology clinic due to cognitive symptoms. Each patient's cognitive state was determined independently from his/her score on the TYM (CDR 0, n=25; CDR 0.5, n=45; CDR 1, n=14). We analysed concurrent validity of TYM scores and results from the psychometric tests, as well as the degree of concordance between the two types of measurement, by contrasting normalised data from each instrument.
ResultsAlthough the intraclass correlation coefficient was 0.67 (confidence interval 95%, 0.53-0.77), analysis of the Bland–Altman plot and the curve on the survival-agreement plot (Luiz et al. method) demonstrates that the individual distances between the two methods exhibit excessive dispersion from a clinical viewpoint. TYM-based predictions of the mean z-score on psychometric tests differed substantially from real results in 30% of the subjects. Concordance of 95% can only be achieved by accepting absolute inter-instrument differences of up to 0.87 as identical values. Furthermore, the TYM underestimates cognitive performance for low values and overestimates it for high values.
ConclusionsThe TYM is a cognitive screening test which should not be used to predict results on psychometric tests or to detect cognitive changes in clinical trials.
Explorar la relación entre las puntuaciones del Test Your Memory (TYM) y los hallazgos observados en una valoración neurocognitiva más extensa.
MétodosSe administraron el TYM y 14 pruebas psicométricas a 84 sujetos de 50 o más años que acudieron a una consulta neurológica ambulatoria con sintomatología de estirpe cognitiva. Se determinó su estado cognitivo con independencia del resultado del TYM (CDR 0: 25, CDR 0.5: 45, CDR 1: 14). Se analizaron la validez concurrente del TYM con los hallazgos de la psicometría, así como el grado de concordancia entre ambos tipos de medida, confrontando datos normalizados y tipificados de los instrumentos.
ResultadosAunque el coeficiente de correlación intraclase fue de 0,67 (intervalo de confianza del 95%, 0,53-0,77), el análisis mediante el gráfico de Bland-Altman y la curva de supervivencia-acuerdo de Luiz et al. demuestran que las distancias individuales entre ambos métodos tienen una dispersión excesiva desde el punto de vista clínico. Los valores predichos por el TYM de la puntuación z media de las pruebas psicométricas discrepan sustancialmente en el 30% de los sujetos y solo aceptando como valores idénticos diferencias absolutas de hasta 0,87 puntos z entre ambas medidas se alcanza un 95% de concordancia. Además, el TYM subestima los rendimientos cognitivos cuando sus valores son bajos y los sobreestima si son elevados.
ConclusionesEl TYM es una prueba cognitiva de cribado que no debe utilizarse para predecir el resultado de la psicometría o determinar la ocurrencia de cambio cognitivo en ensayos clínicos.
According to some studies, scores on certain cognitive screening tests, such as the Mini-Mental State Examination,1 are acceptable predictors of the results of psychometric tests and representative of a patient's general cognitive state.2,3 However, a good cognitive screening test may have a high detection capacity while inaccurately reflecting a patient's cognitive state. We have used the results of a recently validated Spanish-language version4 of the Test Your Memory (TYM) test to determine whether using screening tools in neurocognitive evaluations is appropriate. Our study presents the results of the normalisation of the TYM on the original patient sample. The norms obtained were then applied to a new patient sample. The TYM scores in this sample were compared to the results of a more comprehensive neurocognitive evaluation that was conducted simultaneously.
Subjects, material, and methodsNormalisation and classification procedureWe used the original patient sample for normalisation and classification of the TYM battery.4 This sample included 739 cognitively normal individuals aged 50 or older, with at least 4 years of schooling and a Clinical Dementia Rating (CDR)5,6 score of 0.
Our methodology was similar to that applied in other normalisation studies.7,8 Sex did not affect TYM scores in the validation study4; this variable was therefore not considered in normalisation. Individuals were grouped into 5-year bands and raw TYM scores were sorted by percentile for each age group. Values were subsequently converted to scaled scores (mean±SD: 10±3) so as to normalise the distribution. We conducted a linear regression analysis to correct for education level, which is the variable affecting raw TYM scores the most. The dependent variable was scaled TYM scores (adjusted by age group), whereas the predictor variable was education level, which comprised 4 different levels (0: 4-8 years of schooling; 1: 9-12 years; 2: 13-15 years; and 3: more than 15 years). We then adjusted scaled scores by education level using the following equation:

TYMsc represents scaled TYM scores corrected by years of schooling, TYMs represents scaled TYM scores corresponding to the individual's age group, β is the regression coefficient obtained from the linear regression analysis, and ‘ed-level’ is the individual's education level (as stated previously).
Scaled scores, which were adjusted for age and education level, were converted to z scores (TYMz=[TYMsc−10]/3) to make it easier to compare TYM scores with z scores from other psychometric tests.
Comparison groupThis group included patients aged 50 or older with at least 4 years of schooling who attended the neurology clinic of one of the authors (JFA), and who in one day underwent a cognitive examination and were administered the TYM battery and other standardised neurocognitive tests. We ruled out patients with focal lesions (for example, cerebral infarcts or tumours) and only included those with CDR scores<2 (CDR 0: 25 patients; CDR 0.5: 45; CDR 1: 14). CDR scores were calculated with a Spanish-language structured questionnaire available from http://alzheimer.wustl.edu/cdr/PDFs/Translations/Spanish%20Spain.pdf.
Patients in the comparison group were not included in the patient sample used for normalisation. For each patient, we calculated the TYMz corresponding to their raw TYM scores, adjusting for age group and education level.
Neurocognitive evaluationAll patients in the comparison group took the TYM, forward and backward digit span,9 semantic verbal fluency (animals/min) and phonemic verbal fluency (words beginning with ‘p’/min),10 Free and Cued Selective Reminding Test (free and total recall, delayed free and total recall),11 Boston naming test,12 parts A and B of the Trail Making Test,9 and Rey–Osterrieth Complex Figure Test (time to copy, copy accuracy, and immediate recall [3minutes]).11 Test results were expressed as z scores. We calculated the mean z score of all the applied neurocognitive tests (mean-z), except for TYM, as an indicator of general cognitive performance. Some studies have shown that a set of neurocognitive tests similar to that in our study satisfactorily evaluates general cognitive performance.13,14
Statistical analysisConcurrent validity was tested by calculating the intraclass correlation coefficient between TYMz and mean-z. We then calculated the mean-z predicted by TYMz (Pmean-z) by using a linear regression equation where the criterion variable was mean-z and the predictor variable was TYMz. Agreement and the limits of agreement were evaluated using a Bland–Altman plot.15 Using the Bland–Altman plot simplified the assessment of bias. Once Pmean-z was calculated, we determined whether the limits of agreement with mean-z were acceptable from a clinical viewpoint. This latter aspect was also evaluated using the ‘survival-agreement plot’ designed by Luiz et al.16 We estimated the reliable change index (RCI) of the 2 measurement tools with the formula described by Jacobson and Truax17 using the standard error of the measurement (SEM) and calculating 95% CI (±SEM×√2×1.96):
where r is the test–retest reliability coefficient of each test.
In the case of mean-z, the test–retest reliability coefficient used for calculating the RCI was 0.84 (this was obtained using an independent sample of 49 control patients). The internal consistency of the set of 14 tests (which integrate a ‘virtual scale’) was calculated using the same independent sample of 49 patients and was shown to be sufficient, with a Cronbach's alpha value of 0.85 (95% lower CI limit of 0.80). On the other hand, the RCI of TYMz was calculated with the normative subsample used for test–retest (42 individuals).4 Minimum detectable change was calculated using the RCI of both mean-z and TYMz (RCIm).
This analysis assumed an alpha risk of 0.05 in a bilateral contrast. When necessary, estimates are provided with their 95% CI. Statistical analysis was conducted using Stata/IC™ 12.1 and MedCal™ 14.10.2.
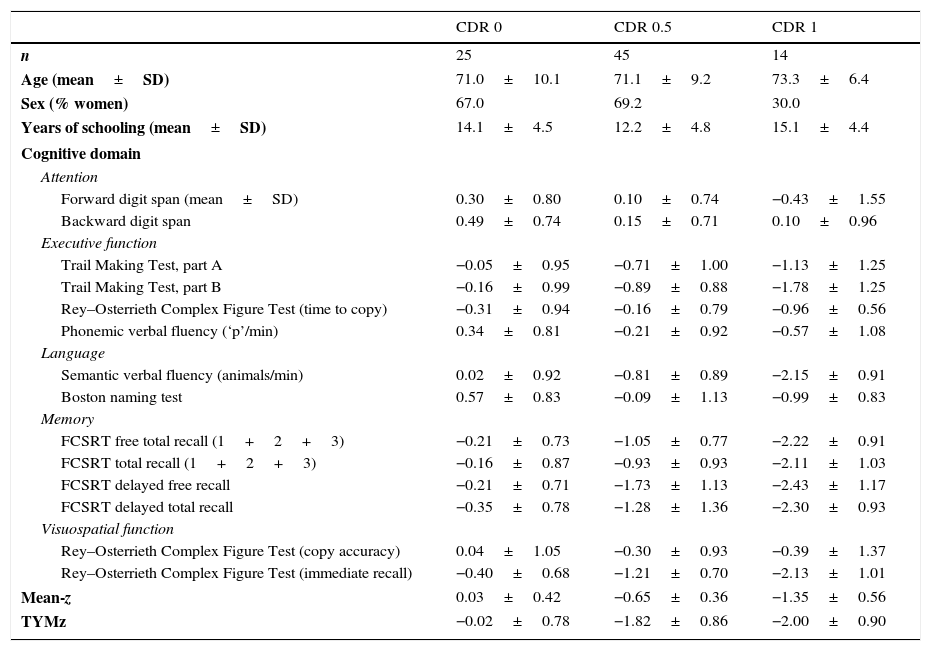
ResultsNormalisation and classificationTable 1 summarises the sample's sociodemographic characteristics and scores on each cognitive test, broken down by CDR score; cognitive tests are arranged by cognitive domain. Table 2 shows raw TYM scores converted to scaled scores, broken down by age group. Age adjustment was subsequently performed using the equation TYMsc=TYMs−0.811×ed-level, obtained from the linear regression analysis. RCI of TYMz was 0.57 and RCI of mean-z was 0.61; therefore, RCIm was ±0.59 z points (95% CI limits). Supplementary material to this article includes an Excel application that calculates scaled and z scores using age, years of education, and raw TYM scores (Appendix).
Sociodemographic characteristics and scores on each cognitive test, broken down by CDR score.
| CDR 0 | CDR 0.5 | CDR 1 | |
|---|---|---|---|
| n | 25 | 45 | 14 |
| Age (mean±SD) | 71.0±10.1 | 71.1±9.2 | 73.3±6.4 |
| Sex (% women) | 67.0 | 69.2 | 30.0 |
| Years of schooling (mean±SD) | 14.1±4.5 | 12.2±4.8 | 15.1±4.4 |
| Cognitive domain | |||
| Attention | |||
| Forward digit span (mean±SD) | 0.30±0.80 | 0.10±0.74 | −0.43±1.55 |
| Backward digit span | 0.49±0.74 | 0.15±0.71 | 0.10±0.96 |
| Executive function | |||
| Trail Making Test, part A | −0.05±0.95 | −0.71±1.00 | −1.13±1.25 |
| Trail Making Test, part B | −0.16±0.99 | −0.89±0.88 | −1.78±1.25 |
| Rey–Osterrieth Complex Figure Test (time to copy) | −0.31±0.94 | −0.16±0.79 | −0.96±0.56 |
| Phonemic verbal fluency (‘p’/min) | 0.34±0.81 | −0.21±0.92 | −0.57±1.08 |
| Language | |||
| Semantic verbal fluency (animals/min) | 0.02±0.92 | −0.81±0.89 | −2.15±0.91 |
| Boston naming test | 0.57±0.83 | −0.09±1.13 | −0.99±0.83 |
| Memory | |||
| FCSRT free total recall (1+2+3) | −0.21±0.73 | −1.05±0.77 | −2.22±0.91 |
| FCSRT total recall (1+2+3) | −0.16±0.87 | −0.93±0.93 | −2.11±1.03 |
| FCSRT delayed free recall | −0.21±0.71 | −1.73±1.13 | −2.43±1.17 |
| FCSRT delayed total recall | −0.35±0.78 | −1.28±1.36 | −2.30±0.93 |
| Visuospatial function | |||
| Rey–Osterrieth Complex Figure Test (copy accuracy) | 0.04±1.05 | −0.30±0.93 | −0.39±1.37 |
| Rey–Osterrieth Complex Figure Test (immediate recall) | −0.40±0.68 | −1.21±0.70 | −2.13±1.01 |
| Mean-z | 0.03±0.42 | −0.65±0.36 | −1.35±0.56 |
| TYMz | −0.02±0.78 | −1.82±0.86 | −2.00±0.90 |
CDR: Clinical Dementia Rating; mean-z: mean z score of all the applied neurocognitive tests except for TYM; FCSRT: Free and Cued Selective Reminding Test.
Test scores are expressed as mean z score±SD.
Conversion from raw TYM scores to scaled scores, broken down by age group.
| Scaled scores | Percentiles | Age groupsa | |||||||
|---|---|---|---|---|---|---|---|---|---|
| 50–54 | 55–59 | 60–64 | 65–69 | 70–74 | 75–79 | 80–84 | >85 | ||
| 2 | <1 | <39 | <36 | <36 | <35 | <32 | <32 | <31 | <30 |
| 3 | 1 | – | – | – | 35 | 32–35 | 32 | 31 | – |
| 4 | 2 | – | 36 | 36 | 36 | 36 | 33–34 | 32–35 | – |
| 5 | 3–5 | 39–40 | 37–38 | 37–38 | 37–38 | 37–38 | 35–37 | 36 | 30 |
| 6 | 6–10 | 41–42 | 39–40 | 39–40 | 39 | 39 | 38 | 37–38 | 31–33 |
| 7 | 11–18 | 43 | 41 | 41–42 | 40–41 | 40–41 | 39–40 | 39 | 34–35 |
| 8 | 19–28 | 44 | 42–43 | 43 | 42 | 42 | 41 | 40–41 | 36–38 |
| 9 | 29–40 | 45 | 44 | 44 | 43–44 | 43 | 42 | 42 | 39–40 |
| 10 | 41–59 | 46–47 | 45–46 | 45–46 | 45–46 | 44 | 43–44 | 43–44 | 41–42 |
| 11 | 60–71 | 48 | 47 | 47 | 47 | 45–46 | 45 | 45–46 | 43 |
| 12 | 72–81 | – | – | 48 | 48 | 47 | 46 | 47 | 44 |
| 13 | 82–89 | 49 | 48 | 49 | 49 | 48 | 47–48 | 48 | 45 |
| 14 | 90–94 | – | 49 | – | – | 49 | 49 | 49 | 46–47 |
| 15 | 95–97 | – | – | – | – | – | – | – | – |
| 16 | 98 | – | – | – | – | – | – | – | 48 |
| 17 | 99 | – | – | – | – | – | – | – | 49 |
| 18 | >99 | 50 | 50 | 50 | 50 | 50 | 50 | 50 | 50 |
| Sample | 739 | 40 | 50 | 116 | 129 | 122 | 121 | 104 | 57 |
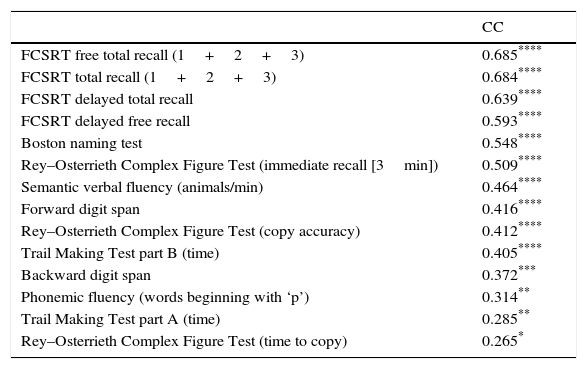
Table 3 shows Pearson correlation coefficients between TYMz and z scores for each test. The tests most strongly correlated with TYM are the ones evaluating verbal memory and language, whereas executive function tests displayed a weaker, though still statistically significant, correlation with TYM. The intraclass correlation coefficient between TYMz and mean-z was 0.67 (95% CI, 0.53–0.77) (R2=0.45). Linear regression mean-z–TYMz produced the following equation: mean-z=−0.1754+0.3773×TYMz. The Bland–Altman plot, which was constructed using the data corresponding to mean-z and TYMz (Fig. 1), shows that the difference between the 2 measures was greater than the 95% CI for a mean difference of 0, and the limits of agreement are clearly more than ±1SD. Fig. 1 also shows that TYMz overestimates general cognitive performance in neurocognitive tests for high values and underestimates it for low values, indicating that calibration is imprecise for extreme values. In the Bland–Altman plot created with mean-z and Pmean-z (Fig. 2), the differences were centered within the CI limits for a mean difference of 0, and the limits of agreement narrowed (± 0.87 z points). Considering a difference between z values higher than 0.59 z points (RCIm) as clinically significant, the percentage of disagreement reaches 30% of the cases, as can be seen in the survival-agreement plot (Fig. 3). To reach 95% agreement, there must be a difference of at least 0.87 z points between both measurements, that is, 0.28 z points more than the RCIm.
Correlation between psychometric tests and TYM.
| CC | |
|---|---|
| FCSRT free total recall (1+2+3) | 0.685**** |
| FCSRT total recall (1+2+3) | 0.684**** |
| FCSRT delayed total recall | 0.639**** |
| FCSRT delayed free recall | 0.593**** |
| Boston naming test | 0.548**** |
| Rey–Osterrieth Complex Figure Test (immediate recall [3min]) | 0.509**** |
| Semantic verbal fluency (animals/min) | 0.464**** |
| Forward digit span | 0.416**** |
| Rey–Osterrieth Complex Figure Test (copy accuracy) | 0.412**** |
| Trail Making Test part B (time) | 0.405**** |
| Backward digit span | 0.372*** |
| Phonemic fluency (words beginning with ‘p’) | 0.314** |
| Trail Making Test part A (time) | 0.285** |
| Rey–Osterrieth Complex Figure Test (time to copy) | 0.265* |
n: 84 patients.
CC: Pearson correlation coefficient between psychometric tests and TYM (z scores); FCSRT: Free and Cued Selective Reminding Test.
, and the regression line of the differences. The slope clearly indicates that TYM underestimates cognitive performance in neurocognitive tests for low values (positive differences) and overestimates it for high values (negative differences).")
Bland–Altman plot using mean-z and TYMz. The x-axis represents the average of mean-z and TYMz while the y-axis represents the differences between the 2 paired values of those parameters. We drew the line of equality, the lines for the limits of agreement (mean difference±1.96SD of the differences, with their respective 95% CI), and the regression line of the differences. The slope clearly indicates that TYM underestimates cognitive performance in neurocognitive tests for low values (positive differences) and overestimates it for high values (negative differences).


TYM values correlated well with language and verbal memory tests, and to a much lesser extent with executive function tests; as a result, we conclude that TYM assesses language and memory function more accurately than other cognitive domains. This tool is better suited for screening for Alzheimer disease (AD) or other types of dementia initially affecting language than it is for screening for the behavioural variant of frontotemporal dementia or certain forms of AD with an unusual presentation (posterior cortical atrophy). The normalisation of TYM carried out in this study defines the most suitable cut-off points for each age group and education level more accurately than the general rule provided in the initial validation study of our Spanish-language version of the test.4 However, we feel that the normative data from this study should be applied with caution since the TYM results do not seem to agree with those from a more exhaustive neurocognitive assessment.
The idea that brief cognitive tests can predict the results of and thus replace a more exhaustive neurocognitive assessment is not new.2,3,18–22 This suggests that both types of assessment somehow reflect the same dimension: general cognitive performance as a reflection of a patient's global cognitive state. The literature has adopted this concept and uses these expressions literally.14 We feel that the idea of ‘general cognition’ is rather elusive, but we accept it as an operative concept. In addition to their utility as detection or screening tools, brief cognitive tests are also used to assess impairment and detect and accurately reflect changes in patients’ cognitive function. However, these tests have obvious disadvantages, including ceiling and floor effects, biased distributions, partial and incomplete representation of neurocognitive dominions, and poor calibration.23 These metric properties are shared by most of the brief cognitive tests and substantially limit their potential to measure broad-spectrum cognitive function and longitudinal changes. In fact, most of the studies analysing the association between one or several brief tests and psychometric tests use analytic techniques which establish a correlation between variables but do not adequately evaluate agreement between the values obtained from 2 tests assessing the same magnitude.24
According to our study, although TYM can explain nearly half of the variance observed in mean-z, this is not enough to rationalise using it to replace an extensive neurocognitive assessment. The values obtained from TYM are not comparable to those of the neurocognitive assessment due to the large spread of z scores in these 2 tools. The problem is not only the poor calibration of TYM, especially for extreme values, but also the dispersion of its values for each mean-z. In nearly 30% of the subjects in our study, the differences between the 2 assessment tools were greater than the minimum detectable change; however, from a clinical viewpoint, the most important fact is that the direction of the deviation was unpredictable. We can conclude that, although TYM is an adequate cognitive screening tool for cognitive impairment and dementia, its use is limited. Until now, no studies have proven its sensitivity to change and its connection with such external validation criteria as neuropathology and neuroimaging findings and other biomarkers.
We may wonder why we should use a global cognitive performance index like the one applied in this study considering that some authors have observed that certain brief tests may predict functional status better than an extensive neurocognitive assessment.25 The ecological validity of neuropsychological tests has been assessed; these were found to account for no more than 30% of the variance in daily life function measures.25,26 We should acknowledge, nonetheless, that activities of daily living instruments have their own drawbacks27: the reliability of the data obtained from informants is highly variable and often unverifiable; measures may address a heterogeneous group of different activities (basic, instrumental, advanced, housework, social activities, hobbies, etc.) that are not uniformly included in scales; activities of daily living may vary significantly between subjects with different lifestyles but similar sociodemographic characteristics; and a large number of tools lack the minimum metric requirements, with the result that there is a wide range of activities of daily living instruments (nearly as many as brief cognitive tests), clearly indicating that none of the existing tools is truly satisfactory.28 Some of the problems inherent to ordinal scales and cognitive tests may be avoided by using modern design techniques (item response theory, Rasch analysis, etc.).27,29,30 Although we accept that cognitive impairment very likely does result in functional impairment, we lack specific tools to prove this. The concept of ‘mild cognitive impairment’ would therefore be an artificial category derived from our own imperfect perception of reality.
From a conservative viewpoint, most healthcare professionals may agree with us that formal neurocognitive tests, which are multifaceted and relatively extensive, assess a patient's cognitive status more accurately than any brief test and, as a result, provide a more reliable evaluation of brain function, which is our ultimate purpose. In addition, their prospective validity is clearly superior to that of brief tests, precisely when accuracy is most needed: in cases of diagnostic uncertainty and when cognitive impairment seems more obvious to patients or their relatives than to clinicians.23 Although a recent, thorough analysis of the ADAS-Cog has identified several significant weaknesses of this tool,31,32 it is still widely used for evaluating results from clinical trials on Alzheimer disease.33–35 In our opinion, the same is applicable to many other brief cognitive tests. Although the literature provides a detailed description of design requirements for brief tests,36 these are not always met. A thorough neurocognitive evaluation provides accurate qualitative data, which are incomparably more valuable and complete than brief test data.
In conclusion, our results suggest that TYM scores (and possibly scores from other brief cognitive screening tests) should not be used to assess a patient's cognitive state, evaluate progression of cognitive impairment, determine changes in clinical trials, or predict the results of a more extensive psychometric test.
FundingThis study received no public or private funding.
Conflicts of interestThe authors have no conflicts of interest to declare.
The following are the supplementary data to this article:
Please cite this article as: Ferrero-Arias J, Turrión-Rojo MA. Normalización del Test Your Memory y evaluación de su concordancia con los resultados del examen psicométrico. Neurología. 2016;31:239–246.
