


About 20% to 26% of patients with multiple sclerosis (MS) show alterations in visuospatial/visuoconstructive (VS–VC) skills even though temporo-parieto-occipital impairment is a frequent finding in magnetic resonance imaging. No studies have specifically analysed the relationship between these functions and lesion volume (LV) in these specific brain areas.
ObjectiveTo evaluate the relationship between VS–VC impairment and magnetic resonance imaging temporo-parieto-occipital LV with subcortical atrophy in patients with MS.
MethodologyOf 100 MS patients undergoing a routine neuropsychological evaluation, 21 were selected because they displayed VS–VC impairments in the following tests: incomplete picture, block design (WAIS-III), and Rey–Osterrieth Complex Figure Test. We also selected 13 MS patients without cognitive impairment (control group). Regional LV was measured in FLAIR and T1-weighted images using a semiautomated method; subcortical atrophy was measured by bicaudate ratio and third ventricle width. Partial correlations (controlling for age and years of schooling) and linear regression analysis were employed to analyse correlations between magnetic resonance imaging parameters and cognitive performance.
ResultsAll measures of LV and brain atrophy were significantly higher in patients with cognitive impairment. Regional LV, bicaudate ratio, and third ventricle width are significantly and inversely correlated with cognitive performance; the strongest correlation was between third ventricle width and VC performance (block design: P=.001; Rey–Osterrieth complex figure: P<.000). In the multivariate analysis, third ventricle width only had a significant effect on performance of VC tasks (block design: P=.000; Rey–Osterrieth complex figure: P=.000), and regional FLAIR VL was linked to the VS task (incomplete picture; P=.002).
ConclusionsMeasures of subcortical atrophy explain the variations in performance on visuocostructive tasks, and regional FLAIR VL measures are linked to VS tasks.
Solo el 20-26% de los pacientes con esclerosis múltiple presenta déficits en habilidades visuoespaciales-visuoconstructivas (VE-VC) pese a la frecuente afectación témporo-parieto-occipital en resonancia magnética. No hay estudios que analicen la relación entre estas funciones y el volumen lesional (VL) de estas áreas cerebrales.
ObjetivoEvaluar la relación del VL parieto-occipito-temporal y la atrofia subcortical con el rendimiento en funciones VE-VC en esclerosis múltiple.
MetodologíaDe 100 pacientes de esclerosis múltiple con evaluación neuropsicológica rutinaria se seleccionan 21 por afectación en habilidades VE-VC, medidas por Figuras incompletas, Cubos (WAIS-III) y Figura compleja de Rey-Osterrieth, y 13 sin déficit cognitivo (grupo control). El VL regional se cuantifica por un método semiautomático en secuencias FLAIR y T1, y la atrofia subcortical por el ratio bicaudado y la anchura del iii ventrículo (AIIIV). Se utilizan correlaciones parciales (controlando con edad y escolarización) y regresión lineal para analizar la relación entre los parámetros de resonancia magnética y el rendimiento cognitivo.
ResultadosTodas las medidas de VL y de atrofia cerebral son significativamente mayores en pacientes con deterioro cognitivo. El VL regional en FLAIR, ratio bicaudado y AIIIV muestran significativa correlación inversa con el rendimiento cognitivo, mayor entre la AIIIV y VC (Cubos: p=0,001; Figura compleja de Rey-Osterrieth: p<0,000). En el análisis multivariante, la AIIIV influye significativamente en tareas de VC (Cubos: p=0,000; Figura compleja de Rey-Osterrieth: p=0,000) y el VL regional en FLAIR en tareas VE (Figuras incompletas; p=0,002).
ConclusionesLas medidas de atrofia subcortical se relacionan con tareas de visuoconstrucción y el VL regional con tareas VE.
Cognitive losses develop in 40%-65% of patients with multiple sclerosis (MS) over the course of the disease. The most frequently affected areas are information processing speed (IPS), attention, memory, and executive functions.1–7 Unlike physical symptoms, cognitive impairment (CI) does not usually remit. CI is more frequent in late stages of the disease but may cause disability during the early stages of relapsing-remitting MS.6,8,9
Most studies found a weak, inconsistent correlation between CI in MS and lesion volume (LV) in white matter (WM) measured using T2 and T1-weighted sequences.10 Measurements of global and regional cerebral atrophy are consistently related with CI, specifically in case of grey matter atrophy.11–13 Specific cognitive domain studies using LV and regional atrophy of the corresponding brain regions are heterogeneous and focus particularly on IPS, memory, and executive function.12,14–19
Although WM lesions of parietal-temporal-occipital areas are frequent in MS, deficits of visuospatial (VS) and visuoconstructive (VC) functions, which were observed in approximately 25% of the patients, have rarely been studied.3,7,20 VS dysfunction translates into a deficit in the representation and integration of images, and spatial localisation and object tracking. VC dysfunction leads to difficulties with spatial organisation of visual information, and to problems with assembly and drawing. Both functions require visual processing pathways to be intact: occipitoparietal or dorsal stream pathways (also known as magnocellular), responsible for movement analysis and visuomotor coordination; inferior occipitotemporal or ventral stream pathway (parvocellular) related to object perception (shape and colour); and the medial superior temporal area, important for VS functions.21,22
We have assessed the relationship between impairment of VS and VC skills and LV on the parietal-temporal-occipital association area and cortical brain atrophy in MS patients. LV was measured manually and the total area was later calculated automatically; brain atrophy was estimated with linear measurements.
MethodsWe selected 21 MS patients (2010 McDonald criteria) with VS and VC impairment, and 13 without CI (control group) out of a total of 100 MS patients. All of these patients underwent routine and comprehensive neuropsychological assessment including IPS, memory, learning, attention, executive functions, language processing, and VS and VC skills. We excluded patients with psychiatric disorders, those under treatment with psychotropic drugs, and patients with any visual impairment and/or alteration of eye movements mentioned in their medical records, due to the potential for interference with performance on cognitive tests.
We recorded age, sex, type of MS, degree of disability measured by the Expanded Disability Status Scale (EDSS), and MS progression time when the neuropsychological evaluation took place. Level of education reported as years of schooling was also included.
Levels of depression (Beck Depression Inventory) and anxiety (State-Trait Anxiety Inventory) were analysed to control for their effect on cognitive performance.
Measurement instrumentsVS and VC skills were evaluated using the block design test (BDT) and the picture completion test (PCT) of the Wechsler Adult Intelligence Scale (WAIS-III), and the Rey–Osterrieth Complex Figure Test (ROCF): copy accuracy and immediate reproduction.
BDTThe patient recreates geometric designs using blocks. This assesses the capacity to analyse and synthesise abstract geometrical drawings, problem solution strategies, psychomotor integration, speed, and distraction. Scaled scores of ≤7 (≤−1 SD) are considered abnormal.
PCTPatients are provided with pictures of everyday objects with a part missing that they attempt to identify. This is a time-dependent test that assesses the capacity to visually organise objects. Scaled scores of ≤7 (≤−1 SD) are considered abnormal.
Rey–Osterrieth complex figureThis test analyses perceptual organisation and visual memory by asking the patient to reproduce a figure after an interference period. It assesses the capacity to organise and plan strategies to resolve problems, as well as VC skills. Percentiles ≤30 indicate pathology due to the ceiling effect of this test (most of the subjects obtain high scores at the upper part of the distribution).
Obtaining abnormal results in at least one test signified a VS and/or VC skills deficit.
Measuring LV using magnetic resonanceA brain MRI was conducted (Siemens, 1.5Tesla). The MRI consisted of 5mm slices of axial T1-weighted sequences and coronal Fluid-Attenuated Inversion Recovery (FLAIR) sequences, which were used to identify and measure WM lesions. WM LV was quantified in the parietal-temporal-occipital association area located between the postcentral and occipital sulci. A researcher blinded to the results of the neuropsychological tests drew the lesion borders. The area of each lesion was automatically calculated by the software that processes the MRI scans (Fig. 1). WM LV of the region is calculated by adding the area of all lesions in all slices and multiplying the result by the slice thickness. Linear measurements of brain atrophy are also conducted using the third ventricle width (TVW) and bicaudate ratio (BCR)23–25 derived from FLAIR sequences. Time elapsed between the neuropsychological examination and the MRI was no longer than 3 months in any case.
Statistical analysis
We used SPSS software version 18.0. We performed descriptive and frequency analyses for both groups. We used the chi-square test (categorical variables) for calculating the inter-group comparison (study group and control group), and the t-test (continuous variables) for independent samples.
We analysed the relationship between VS–VC tasks and clinical and radiological variables in each MS patient, with or without CI. To do this, we used bivariate and partial correlations, and controlled for age and years of schooling (Spearman rank). We also used a linear regression model (stepwise method) employing each of the 3 cognitive tests as dependent variables, while demographic and clinical variables and MRI measurements (LV on T1-weighted images of the right, left, and both hemispheres, and FLAIR LV images of the right, left, and both hemispheres, TVW, and BCR) which showed a statistically significant relationship in the bivariate analysis were used as independent variables. Age, sex, and years of schooling were always included in the model.
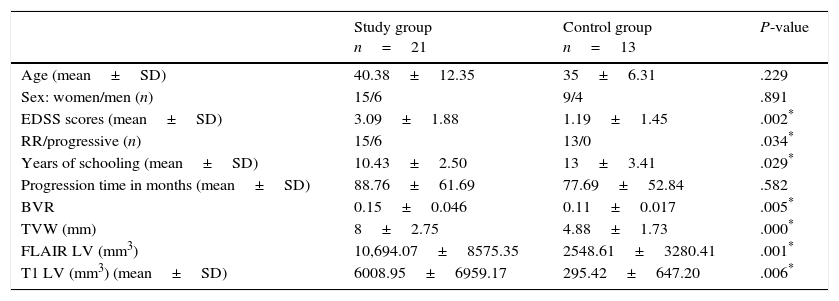
ResultsTable 1 includes the clinical and radiological characteristics of the 2 groups of MS patients. We observed statistically significant differences between the control group (MS patients without CI) and the group of MS patients with impaired VS and VC skills regarding years of schooling, EDSS score, type of MS, and all LV and subcortical atrophy MRI measurements (Table 1).
Clinical and radiological characteristics.
| Study group n=21 | Control group n=13 | P-value | |
|---|---|---|---|
| Age (mean±SD) | 40.38±12.35 | 35±6.31 | .229 |
| Sex: women/men (n) | 15/6 | 9/4 | .891 |
| EDSS scores (mean±SD) | 3.09±1.88 | 1.19±1.45 | .002* |
| RR/progressive (n) | 15/6 | 13/0 | .034* |
| Years of schooling (mean±SD) | 10.43±2.50 | 13±3.41 | .029* |
| Progression time in months (mean±SD) | 88.76±61.69 | 77.69±52.84 | .582 |
| BVR | 0.15±0.046 | 0.11±0.017 | .005* |
| TVW (mm) | 8±2.75 | 4.88±1.73 | .000* |
| FLAIR LV (mm3) | 10,694.07±8575.35 | 2548.61±3280.41 | .001* |
| T1 LV (mm3) (mean±SD) | 6008.95±6959.17 | 295.42±647.20 | .006* |
TVW: third ventricle width; SD: standard deviation; EDSS: Kurtzke Expanded Disability Status Scale; FLAIR: Fluid-Attenuated Inversion Recovery; BVR: bivariate ratio; RR: relapsing-remitting; FLAIR LV: lesion volume on a FLAIR MRI sequence; T1 LV: lesion volume on a T1-weighted MRI sequence.
We obtained no significant correlations between cognitive tests and sex, type of MS, or time of progression of MS. Degree of depression (Beck Depression Inventory: PCT, P=.081; BDT, P=.106; ROCF P=.933), and anxiety (State-Trait Anxiety Inventory: PCT, P=.142; BDT, P=.134; ROCF, P=.126) were not correlated with performance on the tests.
Education level significantly influenced the score on the 3 tests (PCT, P=.010; BDT, P=.005; ROCF, P=.014) though age only influenced results on the ROCF test (P=.005). Therefore, their effect is controlled in the bivariate correlations (EDSS score and MRI measurements).
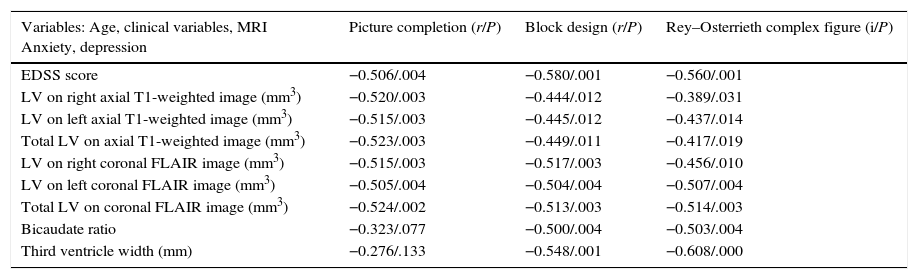
Table 2 shows the variables which are significantly related to performance regarding VS–VC tasks. Of special note is the strong inverse correlation with all LV and atrophy MRI measurements (P<.01) which remains after controlling for age and years of schooling, except in the case of the PCT and central atrophy measurements. FLAIR derived LV of the left and both hemispheres shows a stronger and more uniform correlation with the 3 tests than other volume measurements. However, the most marked association is seen between TVW and VC skills (BDT and ROCF-copy accuracy, r=0.548/P=.001 and r=.608/P<.000, respectively) (Table 2).
Partial correlations between EDSS scores, LV on T1-weighted sequences, FLAIR; atrophy measurements and cognitive tests, adjusted for age and level of education.
| Variables: Age, clinical variables, MRI Anxiety, depression | Picture completion (r/P) | Block design (r/P) | Rey–Osterrieth complex figure (i/P) |
|---|---|---|---|
| EDSS score | −0.506/.004 | −0.580/.001 | −0.560/.001 |
| LV on right axial T1-weighted image (mm3) | −0.520/.003 | −0.444/.012 | −0.389/.031 |
| LV on left axial T1-weighted image (mm3) | −0.515/.003 | −0.445/.012 | −0.437/.014 |
| Total LV on axial T1-weighted image (mm3) | −0.523/.003 | −0.449/.011 | −0.417/.019 |
| LV on right coronal FLAIR image (mm3) | −0.515/.003 | −0.517/.003 | −0.456/.010 |
| LV on left coronal FLAIR image (mm3) | −0.505/.004 | −0.504/.004 | −0.507/.004 |
| Total LV on coronal FLAIR image (mm3) | −0.524/.002 | −0.513/.003 | −0.514/.003 |
| Bicaudate ratio | −0.323/.077 | −0.500/.004 | −0.503/.004 |
| Third ventricle width (mm) | −0.276/.133 | −0.548/.001 | −0.608/.000 |
EDSS: degree of disability according to the Expanded Disability Status Scale; FLAIR: Fluid-Attenuated Inversion Recovery; MRI: magnetic resonance imaging; T1 LV: lesion volume on a T1-weighted MRI sequence.
Significance level≤.05.
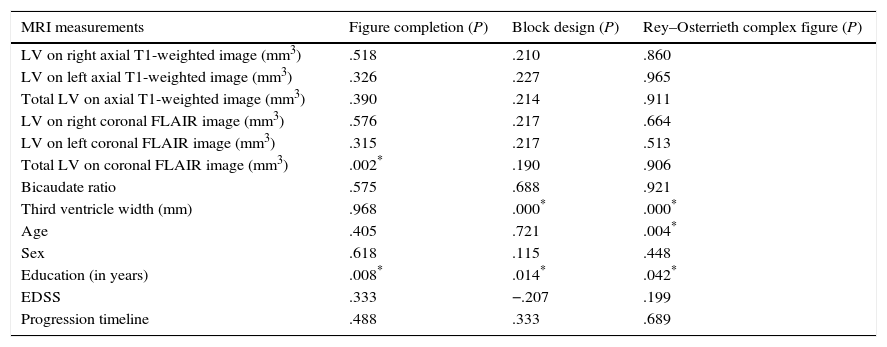
No clinical variable is able to explain performance on cognitive tests, but years of schooling and age can explain VC performance (ROCF). Additionally, TVW has an independent and statistically significant influence on VC performance (BDT and ROCF). We further observed an independent statistically significant effect of the regional FLAIR LV on VS tasks (PCT), with a lower impact (considerable LV increases were required to notably modify test scores). The remaining radiological variables do not show any statistically significant relationship (Table 3).
Linear regression to evaluate the effect of MRI parameters on VS–VC tasks.
| MRI measurements | Figure completion (P) | Block design (P) | Rey–Osterrieth complex figure (P) |
|---|---|---|---|
| LV on right axial T1-weighted image (mm3) | .518 | .210 | .860 |
| LV on left axial T1-weighted image (mm3) | .326 | .227 | .965 |
| Total LV on axial T1-weighted image (mm3) | .390 | .214 | .911 |
| LV on right coronal FLAIR image (mm3) | .576 | .217 | .664 |
| LV on left coronal FLAIR image (mm3) | .315 | .217 | .513 |
| Total LV on coronal FLAIR image (mm3) | .002* | .190 | .906 |
| Bicaudate ratio | .575 | .688 | .921 |
| Third ventricle width (mm) | .968 | .000* | .000* |
| Age | .405 | .721 | .004* |
| Sex | .618 | .115 | .448 |
| Education (in years) | .008* | .014* | .042* |
| EDSS | .333 | −.207 | .199 |
| Progression timeline | .488 | .333 | .689 |
EDSS: degree of disability according to the Expanded Disability Status Scale; FLAIR: Fluid-Attenuated Inversion Recovery; MRI: magnetic resonance imaging; VC: visuoconstructive; VS: visuospatial; T1 LV: lesion volume on a T1-weighted MRI sequence.
Impaired VS and VC skills were detected in 20%-26%3,7,20 of the MS patients. This low percentage is surprising due to the observation, on most of the patients’ MRI scans, of extensive WM involvement in the parieto-occipital and temporal-occipital areas, the precise regions involved in these functions.21,22 Several explanations can be put forward: the tests used to routinely study CI in MS might have low sensitivity to impairment of these functions, or alternatively, these functions might require activation of low brain volume, or are replaced by the extensive connections in these areas. In this article, we studied these functions with tests which are not routinely used for CI evaluation in MS. However, these tests are specific and largely standardised and validated for the analysis of these functions in a number of countries. BDT and PCT (WAIS III subtests), and ROCF are well known tools that analyse complex visual perception and organisation tasks, in addition to visuomotor and VC tasks. Although this is a retrospective study with its associated weak points (which we will analyse later), its interest resides in the specific analysis of these functions and their relationship with structural changes in the brain areas involved in these tasks. This approach has been only sporadically addressed in the literature (as searched on MedLine).23,26,27
In our study, we have observed VS and VC task impairment in 21% of the patients. We are likely underestimating the true prevalence of impairment, since we have excluded patients with any mention of even minimal symptoms or signs of visual impairment or ocular motility in their medical records in order to avoid bias when interpreting the results. Vleugels et al. found VS impairment in 26% of the 49 patients studied with an extensive battery of tests specific to these skills.20 This is the highest frequency so far reported.
Our VS impaired MS patients have significantly higher EDSS scores, more WM LV in the parietal-temporal-occipital association area, and greater subcortical atrophy than MS patients with no CI at all.
Many other authors have described the association between CI and EDSS scores,7,8,11,24 although it is a well-known fact that patients with little motor dysfunction can show substantial CI12,20 and that some domains such as IPS may be altered before motor function.6
We observed a significant inverse association between performance on the 3 tests (PCT, BDT, and ROCF) and all MRI measurements. Regional FLAIR LV images showed a stronger correlation with all tests than T1-weighted sequence LV measurements, while at the same time maintaining independent significance on multivariate analysis with regards to VS tasks, although to a lesser extent. T1-weighted LV images are better at revealing axonal damage, which is not surprising since FLAIR sequences enable better identification of lesions and are more sensitive to periventricular and grey matter-WM interface lesions.28,29 Correlations between T1 and T2-weighted LV images and CI have been only moderately and inconsistently mentioned in the medical literature.27,30,31 In contrast to our study, Lazeron et al.24 did not find a correlation between VS processing and regional LV in a sample of 32 patients studied with an extensive battery which included only one VS processing test. These results might be explained, at least in part, by differences among patients (their patients were older and had higher EDSS scores) and the test used (they used a VS task with a significant VS memory load and did not assess VS skills). This moderate and inconsistent correlation between LV and CI is partially explained by problems inherent to the measurement itself: areas of inflammation, oedema, and gliosis are included in the assessment of volume, which masks some WM atrophy; cortical plaques are difficult to detect by conventional MRI and so are usually not included in the analysis,32 and structural changes in normal-appearing WM, with subsequent alteration in connectivity to cortical areas, as has been demonstrated by anisotropy studies.31,33
Although both methods of brain atrophy evaluation (BCR and TVW) show a strong correlation with VS and VC impairment in 2 out of the 3 tests (BDT, P=.004 and .001; ROCF, P=.004 and .000), only TVW explains the variations in VC task results, with a higher impact which is independent of education level. By using the same indirect measurements, other authors have observed a close association between subcortical atrophy and cognitive dysfunction.23,28,34,35 However, only Benedict et al. assess VS memory using the Brief Visuospatial Memory Test-Revised; VC skills were not assessed.23 Increased BCR is related to extensive frontal WM atrophy while elevated TVW is associated with the volume of the thalamus, a structure with extensive cortical connections. To perform complex activities which involve organisation and praxis functions linked to frontal brain areas, such as VC tasks, this connectivity is hypothetically necessary. The thalamus appears to be one of the brain regions with a higher prevalence of atrophy during the initial stages of MS. It is also strongly correlated with physical and cognitive disability36,37 and is a good marker of poor outcome.38 Finally, although both measurements (BCR and TVW) show an appreciable intra- and interobserver variability which depends on slice thickness, they have demonstrated their usefulness in monitoring brain atrophy progression in comparison with SIENAX, an automatic method for estimating brain volume which is widely used for cases of MS.25
Our study does have some limitations. For one thing, it is a retrospective study with a small patient sample. To minimise unavoidable variability in the acquisition of MR images, a single researcher blinded to clinical and neuropsychological parameters performed all the LV and atrophy measurements. Also, the study area was previously established using fixed coordinates. The same neuropsychologist evaluated all the patients in order to avoid biases in test administration. Another study weakness is the effect of varying education levels in groups of MS patients with or without CI, which is minimised in the data analysis adjusted for this parameter.
In conclusion, our study analyses specific cognitive domains, VC and VS tasks, and their relationship with WM LV in parietal-temporal-occipital association areas, and subcortical brain atrophy. FLAIR LV and subcortical atrophy show a strong correlation with cognitive performance in these domains. Subcortical atrophy, estimated from TVW which measures thalamic atrophy, is highly correlated with VC task impairment, while regional LV is highly correlated with VS task impairment. These results point to the need to extend the study and use automated LV measurements in a larger sample.
Conflicts of interestThe authors declare no conflicts of interest.
Marta Cerezo Gracia has been awarded a grant by Merck Serono and BioGen for the application of neuropsychological tests.
Please cite this article as: Marasescu R, Cerezo Garcia M, Aladro Benito Y. Afectación visuoespacial/visuoconstrucción en pacientes con esclerosis múltiple. Relación con el volumen lesional regional y la atrofia subcortical. Neurología. 2016;31:169–175.
