


Instrumental gait analysis is an emerging technology used increasingly to evaluate motor disorders in children. Normal reference data is necessary in order to evaluate patients, but there are few reference resources for the Spanish paediatric population.
ObjectiveWe aim to describe the values of 16 clinically relevant gait variables in healthy Spanish schoolchildren, and identify any linear associations or left–right asymmetries.
Subjects and methodsThe values of 16 gait variables were determined in schoolchildren (n=27, aged 5–13 years) using instrumental gait analysis. We analysed asymmetries for each variable (Student's t-test for dependent samples) and calculated their confidence intervals (95% of the standardised difference in right and left means [SMD]). Values and associations between variables were represented using a heat map.
ResultsOur project presents normal values tables for 16 variables in the gait cycle. Significant asymmetries were detected in the mean values for minimum hip flexion (SMD: 0.25; 95% CI: 0.11–0.39) and peak hip abduction in swing (SMD: −1.05; 95%: CI −1.71 to −0.27). Functional associations among gait variables are present.
ConclusionsWe present a reference dataset for Spanish school-aged children in which left–right asymmetries and functional associations may be observed for different variables.
El análisis instrumental de marcha (AIM) es una tecnología de uso creciente en la evaluación de trastornos motores infantiles. La evaluación de pacientes requiere una base de referencia de normalidad, pero existen pocas referencias infantiles españolas.
ObjetivoDescripción de 16 variables de marcha de relevancia clínica en una muestra de referencia de escolares sanos. Estudio de sus relaciones lineales y asimetrías izquierda-derecha.
Sujetos y métodosSe midieron con AIM 16 variables de marcha en escolares sanos (n=27, 5–13 años). Se estudiaron las asimetrías en cada variable (t de Student, muestras dependientes) y sus intervalos de confianza (95% de la media de diferencia estandarizada derecha menos izquierda, dz). Se representaron los valores y las asociaciones entre variables mediante “heatmap”.
ResultadosSe aportan tablas de normalidad para 16 variables del ciclo de marcha. Son significativamente asimétricos los valores medios de flexión mínima de cadera (dz: 0,25; IC del 95%: 0,11–0,39) y de máxima abducción de cadera en el balanceo (dz: −1,05; IC del 95%: −1,71, −0,27). Existen asociaciones funcionales entre las variables de marcha.
ConclusionesPresentamos una muestra de normalidad de escolares españoles donde se observan asimetrías entre los lados izquierdo y derecho y organización funcional entre sus variables.
Instrumental movement analysis refers to all technologies allowing measurement of a subject's motor activity. Instrumental gait analysis (IGA) includes multiple technologies assessing kinematic, kinetic, and electromyographic events during a gait cycle, that is, between 2 heelstrikes of the same foot. In this type of analysis, we can measure spatial–temporal parameters (step/stride velocity and characteristics, such as length, width, or frequency); kinematic parameters (joint angular displacement at a specific moment or during a time interval); kinetic parameters (strength, work, power, angular momentum, etc. of a specific body part or the entire body); and dynamic electromyography parameters.1
Technological development has made these technologies more viable and widespread. As a result, IGA is increasingly relevant to our understanding of the physiology of normal and pathological human gait. Use of these technologies has given rise to sizeable bodies of research-based theory which can be applied to clinical care for paediatric neurological diseases and used to assess treatment results.2,3
The quantitative study of gait abnormalities requires reference data from healthy subjects to complete the following tasks: (a) understand the physiological significance of the variables; (b) gather clinically relevant variables, and (c) properly describe changes in variables in pathological gait so as to better understand its pathophysiology and therapeutic approach. However, there are no Spanish publications describing gait in paediatric patients and including objectively selected kinematic data.
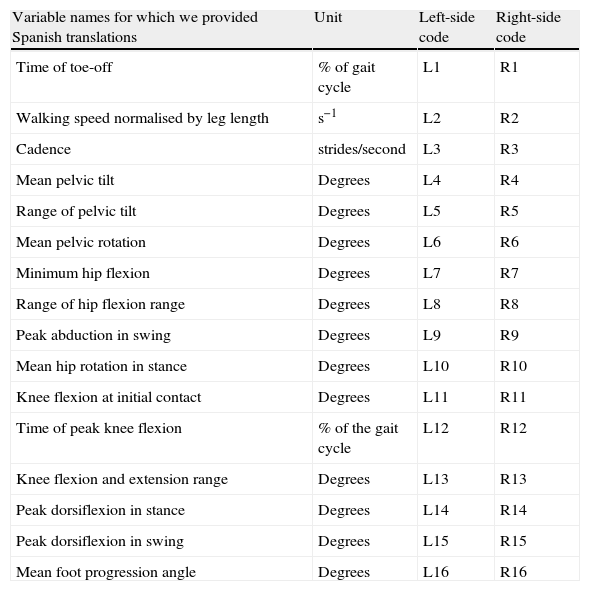
Gait is a complex neurobiological phenomenon which is difficult to describe4 and interpret since IGA provides an overwhelming amount of data.5 Several strategies have been designed in order to solve this problem.5 One of the most compelling strategies was the creation of indexes that reduce a set of variables to a single number so as to express the patient's degree of gait deviation compared to a reference, such as the Gillette Gait Index (GGI or Normalcy index). This index includes 16 spatial–temporal and kinematic variables6 selected from a wide range of variables considered to be clinically relevant (Table 1). In spite of its limitations,7,8 the GGI is one of the most widely used indexes9–15 to evaluate treatment results.
The 16 clinically relevant variables selected by Schutte et al.
| Variable names for which we provided Spanish translations | Unit | Left-side code | Right-side code |
| Time of toe-off | % of gait cycle | L1 | R1 |
| Walking speed normalised by leg length | s−1 | L2 | R2 |
| Cadence | strides/second | L3 | R3 |
| Mean pelvic tilt | Degrees | L4 | R4 |
| Range of pelvic tilt | Degrees | L5 | R5 |
| Mean pelvic rotation | Degrees | L6 | R6 |
| Minimum hip flexion | Degrees | L7 | R7 |
| Range of hip flexion range | Degrees | L8 | R8 |
| Peak abduction in swing | Degrees | L9 | R9 |
| Mean hip rotation in stance | Degrees | L10 | R10 |
| Knee flexion at initial contact | Degrees | L11 | R11 |
| Time of peak knee flexion | % of the gait cycle | L12 | R12 |
| Knee flexion and extension range | Degrees | L13 | R13 |
| Peak dorsiflexion in stance | Degrees | L14 | R14 |
| Peak dorsiflexion in swing | Degrees | L15 | R15 |
| Mean foot progression angle | Degrees | L16 | R16 |
IGA: instrumental gait analysis; SMD: standardised mean difference; GGI: Gillette Gait Index; L: left; R: right.
One of the current limitations of GGI is that it is calculated using composite data from the left and right sides of the body, based on an unfounded assumption of complete symmetry. Evidence shows that symmetry is in fact incomplete,16 and the degree of asymmetry should therefore be measured in each reference sample.
The aim of the current study is to describe the 16 gait variables proposed by Schutte et al.6 in a group of healthy Spanish schoolchildren in order to provide an acceptable reference for designing a version of the GGI that will account for the important factor of asymmetries and which may be used in the study and assessment of paediatric neurological disease. As secondary objectives, we aim to describe linear associations among these variables and propose a multivariate representation method for describing samples.
Subjects and methodsThe study was approved by the research ethics committee at Universidad Autónoma de Madrid. The consent for subjects to participate in the study was given by children's legal guardians. Informed assent was verbally given by children who were able to do so. Children were assigned coded identification numbers to guarantee their privacy.
Recruitment of volunteersThe flow chart (Fig. 1) shows the recruitment protocol used to enrol 30 healthy volunteers in the study. Inclusion criteria were as follows: age ranging from 5 to 16 years; Tanner stage I or II; right motor dominance; residence in Madrid or the greater Madrid area; educational level corresponding to age; cognitive and behavioural skills on par with age; no uncorrected visual or hearing disorders; no known orthopaedic diseases in the 6 prior months; no neurological, cardiovascular, or systemic pathologies; negative screening for undiscovered orthopaedic pathologies using the Scottish Rite Hospital protocol17; and no changes in lower limb mobility, strength, tone, or reflexes. IGA results from 27 children were valid to make up the sample.
Gait analysis
IGA sessions were performed in the laboratory belonging to the movement analysis group at the ONCE-UAM University School of Physical Therapy. Kinematic and spatial–temporal data were obtained by using a Codamotion system (Charnwood Dynamics Ltd., UK). Markers were placed at the anatomical locations indicated by the manufacturer of the software module that measures joint movement regions. After an adaptation period with the markers, children walked barefoot at their speed of choice from 15 to 20 times along a previously calibrated gait corridor 6m long. We selected 4 to 5 left gait cycles and the same number of right gait cycles from each child for subsequent study. The selection criteria for cycles were as follows: selection among intermediate cycles in the gait corridor, selection among cycles closer to the end of the session, and monitoring of the total presence of signals from markers during the cycle. We gathered the 16 final parameters (Table 1) from each left and right cycle. We calculated the right and left means for each of the variables (32 parameters) for each of the 5 cycles and for each subject.
Descriptive statistical method for the variables of the sample- -
Univariate description of the sample: we used the mean and typical deviation for the variables with a normal distribution, and the median and range for the variables without a normal distribution (P<.01 in the Kolmogorov–Smirnov test).
- -
Left–right differences: we compared absolute values for the left side with absolute values for the right side for each of the 16 variables by using the t-test for dependent samples. With the aim of avoiding multiple comparisons, the P value was corrected in 16 comparisons using the method proposed by Sidak et al. (P corrected=.0032).18 We calculated a 95% confidence interval for the standardised mean difference (SMD)19 between right- and left-sided data for each variable by using the bias-corrected and accelerated bootstrap method and 999 resampling samples.20
- -
Multivariate description of the sample is shown as a heatmap. Data from children were normalised and expressed in terms of Z-score for each variable. Patients and variables were classified using hierarchical grouping with the Euclidean distance as a dissimilarity measure and the mean as the criterion.
Univariate calculations were performed using SPSS 16.0 for Windows. The other statistical studies were performed using R and its packages Rcmdr, boot, simpleboot, and ggplot (heatmap.2 function). This statistical software has recently been accepted by the FDA for clinical trials (The R Foundation for Statistical Computing, 2008).
ResultsUnivariate description of the sampleLastly, gait variables were analysed in 14 boys and 13 girls. The medians and ranges were as follows: mean age 8 years (range 6–13 years), height 136cm (118–160cm), weight 32kg (20–53kg), and body mass index 17.36kg/m2 (14.12–20.7kg/m2). Fig. 2 shows the median and typical deviation of the 16 gait variables in our sample.
 and 95% confidence interval (obtained using the bootstrap method) of the standardised difference between paired right-sided and left-sided values.")
Forest plot of right–left differences. The table on the left shows the mean and standard deviation for left-sided and right-sided values. Absolute CI of 95% refers to the 95% confidence interval of the absolute difference between right and left values. P value refers to the statistical significance of the t-test for paired values. The variables ‘minimum hip flexion’ and ‘maximum hip abduction’ show statistically significant differences. The forest plot displays the mean (square) and 95% confidence interval (obtained using the bootstrap method) of the standardised difference between paired right-sided and left-sided values.
Fig. 2 displays results from the univariate comparison between left- and right-sided mean variables. The right-sided mean value for ‘minimum hip flexion’ (V7) was significantly higher than the left-sided mean (SMD: 0.25°; 95% CI: 0.11°–0.39°; P=.00155). The difference between right and left-sided means was either minor or moderate. The left-sided mean value for ‘peak abduction in swing’ (V9) was significantly higher than the right one (SMD: 1.05°; 95% CI: 0.27°–1.71°; P=.00297). The confidence interval of this difference is wide. The difference between right- and left-sided means may range from very considerable to moderate or minor. The variables ‘peak dorsiflexion in swing’ (V15) and ‘mean foot progression angle’ (V16) show a tendency toward asymmetry, but the tendency is not statistically significant. However, other variables show narrow confidence intervals for the difference between left- and right-sided means (approaching 0), which is indicative of a marked tendency toward symmetry.
Representation of multivariate dataFig. 3 displays our proposal for representing multivariate data from samples to show IGA results using a hierarchical classification. Colours on the heatmap indicate the Z-score value for each variable in each child (consult the key to right side of the heatmap).
 are given below the map. The dendrogram on the left side represents the subjects, whose random numeric codes are given on the right. Both variables and subjects are organised according to the result of the hierarchical classification process. Each coloured block represents the value of a specific variable in a single subject according to a colour key located at the top left corner.")
Heatmap showing the multiple variables assessed in a sample of 27 normal subjects. Above the heatmap, we find a dendrogram corresponding to the variables. Variable codes (preceded by ‘Z’ to indicate z-score) are given below the map. The dendrogram on the left side represents the subjects, whose random numeric codes are given on the right. Both variables and subjects are organised according to the result of the hierarchical classification process. Each coloured block represents the value of a specific variable in a single subject according to a colour key located at the top left corner.
The dendrogram at the top of the heatmap groups variables with similar standardised values. Standardised values become more similar the lower the connecting node is located. This graph allows us to explore the presence of groups of variables that tend to change conjointly and which may represent functional gait process. We will describe them briefly in the following section.
The group including ‘minimum hip flexion’ (V7 left and right) and ‘mean pelvic tilt’ (V4 left and right), which represent the sagittal movement of the lumbar–pelvic–femoral system.
The group including ‘walking speed normalised by leg length’ (V2) and ‘cadence’ (V3) is associated with strength (these variables are strongly related to ‘range of knee flexion’ (V13)); the functional value of the group of spatial–temporal variables may be interpreted as “purposeful control over walking” and its relation with V13 (left and right) indicates that the nervous system could take advantage of changes to this parameter to increase or decrease gait velocity and cadence.
In addition, there is an association between the functional process of ankle angle control during heelstrike and the group of variables ‘peak dorsiflexion in stance’ (V14), ‘peak dorsiflexion in swing’ (V15) and ‘knee flexion at initial contact’ (V11) for the same side. This association confirms the clinical observations on heelstrike quality, which depends on the flexion of the knee during the foot's initial contact with the ground. The more the knee is flexed, the more the gait is plantigrade.
There is a close association between the group of variables indicating time distribution within the cycle (‘time of toe-off’ (V1) and ‘time of peak knee flexion’ (V12)) and the group of angular variables for the hip joint (‘range of hip flexion’ (V8) and ‘mean hip rotation in stance’ (V10)). In the first group of variables, the V1 value during the gait cycle is the largest contributor to the V12 value. However, these values must always be different in order for gait to be considered normal. Changes to the normal value of this difference result in the stance time being too long or insufficient extension at the end of the cycle. V8 and V10 must be associated for proper regulation of the direction and medial/lateral stability of the extremity during locomotion. The association between the 2 groups indicates the presence of a common regulating mechanism.
Most variables are associated with their corresponding lateral variable (for example, L4 with R4). However, some variables that do not meet this pattern are also related. Examples include the correlation between ‘peak abduction in swing’ (V9) on one side and ‘mean pelvic rotation’ (V6) on the opposite side. This association may also be clinically observed during locomotion.
The lateral dendrogram in Fig. 3 groups children with similar gait profiles. Nodes located the farthest to the right indicate the most similar profiles. Although data are somewhat hierarchical, organising them to present a group interpretation is more difficult than with gait variables. In any case, there is evidence of heterogeneity among gait profiles in children which depends on the normality of parameter values for the functional groups mentioned previously. For example, in the group containing children 10, 6, 4, 11, 17, and 18, values for parameters measuring the lumbar–pelvic sagittal plane range between −1 and −3 standard deviations of the mean. The group containing children 25, 9, and 16, is distinctive because the values of V11, V14, and V15 (control over ankle angle) range between 0 and +3 standard deviations of the mean.
DiscussionValidity of the study and techniqueWe present a sample of 27 children who were selected using strict and previously determined inclusion and exclusion criteria (see ‘Subjects and methods’), including a specific age range that represents a concrete period in gait development in children.21,22 Due to meeting exclusion criteria, 6.7% (2 out of 30 children) were eliminated from the initial sample.
To ensure measurement validity, gait cycles were selected according to previously determined criteria. We used the mean of 5 cycles in order to control the intrinsic variability of gait. We also established control criteria so as to avoid errors in marker position. Application of these criteria resulted in the exclusion of 3.3% of the children (1 out of 30) in the original sample.
While our study is limited by its small sample size, the sample size is in fact similar to that in other published studies.6,9,12 Despite having a small sample, we have provided effect size measures which will permit future meta-analytic approaches.19 We have also determined significant differences and narrow confidence intervals in the comparison of some of the parameters, even after applying relevant statistical corrections. Our group believes that the results shown here constitute an initial exploratory approximation. The study provides a firm initial basis for future studies with larger samples sizes which will offer more detailed information about age and sex effects on our reference samples.
Measurement validityThe 16 kinematic parameters taken from Schutte et al.16 present limitations, since neither their popularity nor their selection method guarantees that they are representative of the entire gait cycle or the real characteristics of each laboratory or each type of reference sample.7,8,23 We opted for these parameters for the following reasons: (a) these variables are clinically relevant and frequently used in IGA; (b) their reduced number permits multiple univariate comparisons with a level of significance that enables detection of moderate effects; (c) they are selected using rigorous statistical criteria; and (d) samples have been published that enable comparisons between laboratories.
Discussion of left–right asymmetry in gait variablesOur reference sample delivered variables with statistically significant left–right differences (V7 and V9), variables with a difference approaching the significance level (V15 and V16), and others with narrow confidence intervals near 0 (V3 and V4). It is important to recall that what we are measuring is asymmetry and not laterality (all children were right-handed according to the medical history and examination).
Most published works on schoolchildren refer only to differences between spatial–temporal parameters. Wheelwright et al.25 studied symmetry of stride length, swing phase time, double limb stance time, and maximum velocity for each foot, revealing important differences in the double limb stance phase. They found no correlations between asymmetries and age, sex, height, or leg length. Lythgo et al.26 studied the symmetry of step and stride lengths, stride time, single stance time, and double stance time and found slight differences which were not age-related.
Asymmetries can be explained with the help of 2 hypotheses.16 According to the first, asymmetry is local and indicates muscle adaptations secondary to laterality or subtle osteoarticular differences. The second hypothesis states that asymmetries affect the entire body and reveal the presence of 2 different, but coordinated, motor programs. Our results do not definitively support either of these 2 hypotheses. However, it is revealing that the most asymmetric parameters in our sample (V7 and V9) show sporadic and extreme values during the gait cycle, which could support the local asymmetry hypothesis. This also occurs with V15. The fact that V1 and V5 parameters, which express means or ranges of motion during the gait cycle, tend toward symmetry, also supports this hypothesis. However, these variables are less sensitive for detecting asymmetries.16 On the other hand, the tendency toward asymmetry shown by V16 (a measure of movement during the gait cycle) is more compatible with the second hypothesis.
Although results are hard to interpret from a neurobiological standpoint, right and left gait values must be screened for asymmetries before we can assume they may be averaged. Our study, like many before it, supports this position which must be considered when doctors draw up treatment programs.
Heatmap describing reference samplesOur study uses a heatmap to display the multivariate description of our sample graphically. Heatmaps are well-established tools in many other disciplines,24 and they allow us to assess correlations between variables and groups of subjects in a simple graph.
The dendrogram at the top of the heatmap (Fig. 3) provides the information needed in order to understand the physiological meaning of listed parameters. Groups of variables may represent functional dimensions within normal gait and they should be interpreted as a whole in IGA, whether in normal subjects or patients.
The dendrogram of cases (left) suggests that specific gait profiles may be present in children, although it may not be possible to define them clearly using this technique.
The main limitation of performing hierarchical analysis of groups of subjects is that it uses a purely descriptive and exploratory approach. Therefore, the results we provided should be complemented with the results from other techniques. This will provide a reliable demonstration of what we infer from the hierarchical analysis.
Applicability of the resultsIGA is becoming increasingly useful in the study of neurological pathologies. Descriptive studies of the reference samples are important to our understanding of the physiology behind the phenomenon being studied. The methodology presented in this article may be useful for studying a variety of gait abnormalities and add to our knowledge of the pathophysiology of a number of different conditions. Gaining a better knowledge of the physiology of both normal and disordered gaits will allow us to increase the utility of IGA by offering personalised therapeutic approaches and early diagnosis as a result of diseases being better described.3
FundingAgencia de Evaluación de Tecnologías Sanitarias (PI05/90123) and Escuela de Fisioterapia de la ONCE-UAM.
Conflicts of interestThe authors have no conflicts of interest to declare.
We would like to thank the volunteers and their families.
Please cite this article as: Pulido-Valdeolivas I, et al. Parámetros de marcha en una muestra de referencia de escolares sanos españoles: descripción multivariante y asimetrías entre ciclos izquierdos y derechos. Neurología. 2013;28:145–52.
This study was presented at the National Conference held by the Spanish Society of Rehabilitation and Physical Medicine in Toledo, Spain, 2011.
articles

Neurología (English Edition) follows the Recommendations for the Conduct, Reporting, Editing and Publication of Scholarly Work in Medical Journals