


Patients with acute stroke are more likely to survive and achieve independence if they are treated in a stroke unit. Available information in our setting is scarce. We analyse the outcomes of our patients on the basis of cumulative experience in a stroke unit.
Patients and methodsA retrospective cohort study of patients admitted to a stroke unit. We differentiate between two groups according to the year of admission: group A (July 2007–December 2009) and group B (January 2010–December 2011), analysing early outcome based on the score on the National Institute of Health stroke scale and mortality at discharge, and medium-term outcome in terms of mortality and functional status according to the modified Rankin scale at three months.
ResultsA total 1070 patients were included. There were no differences between groups with respect to favourable outcome (68.3% vs 63.9%), hospital mortality (5.1% vs 6.6%), or 90-day mortality (12.8% vs 13.1%). The percentage of patients who were independent at 90 days was greater in group B (56.3% vs 65.5%, P=.03). In the multivariate analysis adjusted for stroke subtype and fibrinolytic therapy, the association between patient independence and admission period remained present.
ConclusionsThe probability of functional independence in our patients increased alongside accumulated experience in our stroke unit with no differences in mortality.
Los pacientes con un ictus tienen más probabilidades de supervivencia e independencia si son atendidos en una unidad de ictus. La información disponible en nuestro entorno acerca de la influencia del aprendizaje sobre estos resultados es escasa. Analizamos la situación funcional y mortalidad en nuestros pacientes en función de la experiencia acumulada en una unidad de ictus.
Pacientes y métodosEstudio de cohortes retrospectivo de pacientes ingresados en una unidad de ictus. Diferenciamos 2 grupos según el año de ingreso: grupo A (julio 2007-diciembre 2009) y grupo B (enero 2010-diciembre 2011), analizando la evolución precoz en función de la puntuación en la escala de ictus del National Institute of Health y la mortalidad al alta y la situación funcional a medio plazo en función de la mortalidad y estado funcional según la escala Rankin a los 3 meses.
ResultadosSe incluyó a 1.070 pacientes. No se obtuvo diferencias entre los grupos ni en la evolución favorable (68,3% vs. 63,9), ni en la mortalidad tanto hospitalaria (5,1% vs. 6,6%), como a los 90 días (12,8% vs. 13,1%), siendo mayor el porcentaje de independientes a los 90 días en el grupo B (56,3% vs. 65,5%: p=0,03). El análisis multivariante ajustado por subtipo de ictus y tratamiento fibrinolítico mantuvo la asociación entre la independencia y el período de ingreso.
ConclusionesLa probabilidad de independencia funcional de nuestros pacientes aumentó con la experiencia acumulada de nuestra Unidad de Ictus sin observarse diferencias en la mortalidad.
Stroke poses one of the most significant public health challenges.1 In Spain, according to data from the Iberictus study,2 between 80000 and 90000 stroke events occur every year, making this the third-leading cause of death among men and the leading cause among women.3 Furthermore, it elicits considerable disability in surviving patients and is listed as the leading cause of disability in adults.4 As such, stroke is one of the diseases with the greatest social and economic burdens.5
In recent years, 4 types of interventions have been proved effective in patients with acute stroke,6 provided that stroke is regarded as a medical emergency.7 This will lay to rest the therapeutic nihilism that was associated with the disease during many decades.8
Based on this evidence, members of the Spanish Society of Neurology's Study Group for Cerebrovascular Diseases (GEECV) published a statement stressing the need for an organised stroke care system that would respond to patient needs and optimise use of healthcare resources in our setting.9 This initiative has been expanded and it culminated with the participation of several different medical societies in the creation of the Spanish National Health System's stroke care strategy.10 In its strategic lines, this document describes acute-phase care for stroke patients and prioritises providing care in stroke units (SUs).
Spain currently boasts 39 SUs,11 but very few publications describe the characteristics, activity, and results of these centres.12 Our objective is to analyse early and 90-day prognoses of patients admitted to our SU based on our cumulative experience.
Patients and methodsThis cohort study presents a retrospective analysis of consecutive patients admitted to the SU at Hospital San Pedro de Alcántara in Cáceres (HSPA-CC) since that unit was formed. Patients were divided into 2 groups according to year of admission. Group A included patients admitted between July 2007 and 31 December 2009, and Group B included admissions between 1 January 2010 and 31 December 2011.
HSPA-CC provides care to a health district with 200000 inhabitants. That hospital's SU is the reference unit for the entire province (411633 inhabitants) and it may admit patients from anywhere in Extremadura. The unit is self-contained and located in the Neurology Department's admission ward. It includes 4 acute care beds with non-invasive multi-parameter monitoring systems and an unmonitored ‘pre-discharge’ bed for use in rehabilitation therapy. The unit is staffed by a multidisciplinary team coordinated by a neurologist with permanently assigned nursing personnel. A neurologist is physically present 24hours a day. The unit's activities follow its procedural manual. All admitted patients’ details were included prospectively in a database recording their demographic characteristics, medical history, risk factors, descriptive variables for the acute process, neurological evaluation scales,13 paraclinical tests, complications,14 final diagnosis according to GEECV recommendations,15 and functional outcome at discharge. Ischaemic strokes were classified according to the Oxfordshire Community Stroke Project (OCSP)16 and Trial of Org 10172 in Acute Stroke (TOAST).17 Surviving patients were assessed in a specialist vascular neurology clinic in periods depending on the aetiological subtype of the stroke.
The analysis of patient progression differentiated between in-hospital mortality and early outcome. Improvement of more than 20% on the National Institutes of Health Stroke Scale (NIHSS)18 between admission and discharge was considered an early favourable outcome. It also differentiated between outcome at 90 days as determined by the functional outcome (Rankin scale) and 90-day mortality. Functional independence was defined as a Rankin scale score ≤2.
Statistical analysis was performed using SPSS software version 18.
Quantitative variables are expressed as mean±standard deviation or median and interquartile range depending on whether they showed a normal distribution. Categorical variables are given as absolute and relative frequencies.
Associations between qualitative variables were studied with the chi-square test; associations between quantitative variables were studied with the t-test or Mann–Whitney test depending on whether distribution was normal.
To determine prognostic factors associated with in-hospital mortality, early neurological outcome, 90-day mortality, and functional outcome at 3 months, we completed multivariate analysis models using binary logistic regression independently for ischaemic and haemorrhagic strokes. Dependent variables were those listed above; independent variables were those presenting an association in the bivariate analysis with a significance level of P<.20. Variables that remained in the model were those that maintained the association with the same level of significance (P<.20) and displayed a high clinical value, or those eliciting at least a 10% change in the odds ratio (OR) of one of the previously included variables. We used the ‘enter’ method to adjust the model. ROC curve was used to measure model discrimination and calibration was plotted with the Hosmer–Lemeshow test.
To observe time trends in early neurological outcome, in-hospital mortality, 90-day mortality, and functional outcome at 3 months, patients were classified according to the index hospitalisation date in yearly periods (from 2007 to 2011). To that end, we used the Mantel–Haenzel chi-square tests for linear tendency.
ResultsDuring the study period, 1276 patients were admitted; of this total, 26 (2.03%) were diagnosed with entities other than stroke at time of discharge. Of the remaining patients, 180 patients (14.4%) were diagnosed with transient ischaemic attack. The definitive analysis included 1070 patients. Functional state at 3 months was unknown in 49 cases (4.5%); since these patients were not included in the analysis of functional outcome at 90 days, that variable was analysed in a group of 1021 patients.
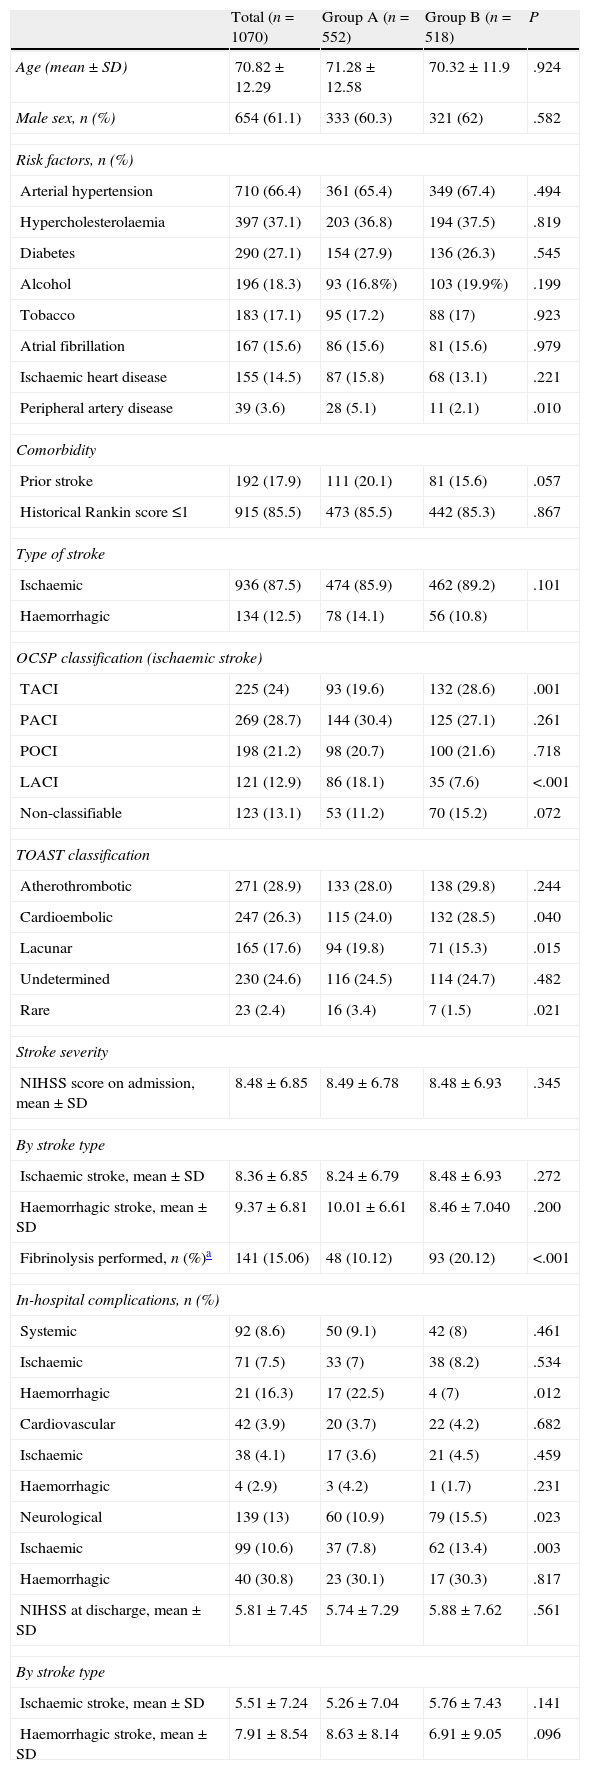
Table 1 displays baseline patient characteristics, breakdown by type of stroke, severity at admission, and appearance of complications. We observed significant intragroup differences for the presence of peripheral artery disease (5.1% vs 2.1%), total anterior cerebral infarction (TACI) (19.6% vs 28.6%) and lacunar cerebral infarction (LACI) (18.1% vs 7.6%); the aetiological subtype of ischaemic stroke (cardioembolic: 24% vs 28.5%; lacunar: 19.8% vs 15.3%; and rare causes: 3.4% vs 1.5%); and percentage in which systemic fibrinolysis was performed (10.1% vs 20.1%). Differences in percentage were significant for patients with TACI (27.9% vs 43.9%; P<.0001) and posterior cerebral infarction (POCI, 2.1% vs 11%). There were no differences in stroke severity at admission (8.49±6.78 vs 8.48±6.93) or between NIHSS scores at discharge from the SU (5.74±7.29 vs 5.88±7.62). The most frequent complications were neurological (13%), and there were significant intragroup differences (10.9% vs 15.5%; P=.023). Cardiac and systemic complications showed a similar presence (3.7% vs 4.2% and 9.1% vs 8%); however, for patients with haemorrhagic stroke, systemic complications were more frequent in group A (22.5% vs 7%; P=.012).
Patient characteristics at baseline. Stroke distribution and type. Severity at admission. In-hospital complications.
| Total (n=1070) | Group A (n=552) | Group B (n=518) | P | |
| Age (mean±SD) | 70.82±12.29 | 71.28±12.58 | 70.32±11.9 | .924 |
| Male sex, n (%) | 654 (61.1) | 333 (60.3) | 321 (62) | .582 |
| Risk factors, n (%) | ||||
| Arterial hypertension | 710 (66.4) | 361 (65.4) | 349 (67.4) | .494 |
| Hypercholesterolaemia | 397 (37.1) | 203 (36.8) | 194 (37.5) | .819 |
| Diabetes | 290 (27.1) | 154 (27.9) | 136 (26.3) | .545 |
| Alcohol | 196 (18.3) | 93 (16.8%) | 103 (19.9%) | .199 |
| Tobacco | 183 (17.1) | 95 (17.2) | 88 (17) | .923 |
| Atrial fibrillation | 167 (15.6) | 86 (15.6) | 81 (15.6) | .979 |
| Ischaemic heart disease | 155 (14.5) | 87 (15.8) | 68 (13.1) | .221 |
| Peripheral artery disease | 39 (3.6) | 28 (5.1) | 11 (2.1) | .010 |
| Comorbidity | ||||
| Prior stroke | 192 (17.9) | 111 (20.1) | 81 (15.6) | .057 |
| Historical Rankin score ≤1 | 915 (85.5) | 473 (85.5) | 442 (85.3) | .867 |
| Type of stroke | ||||
| Ischaemic | 936 (87.5) | 474 (85.9) | 462 (89.2) | .101 |
| Haemorrhagic | 134 (12.5) | 78 (14.1) | 56 (10.8) | |
| OCSP classification (ischaemic stroke) | ||||
| TACI | 225 (24) | 93 (19.6) | 132 (28.6) | .001 |
| PACI | 269 (28.7) | 144 (30.4) | 125 (27.1) | .261 |
| POCI | 198 (21.2) | 98 (20.7) | 100 (21.6) | .718 |
| LACI | 121 (12.9) | 86 (18.1) | 35 (7.6) | <.001 |
| Non-classifiable | 123 (13.1) | 53 (11.2) | 70 (15.2) | .072 |
| TOAST classification | ||||
| Atherothrombotic | 271 (28.9) | 133 (28.0) | 138 (29.8) | .244 |
| Cardioembolic | 247 (26.3) | 115 (24.0) | 132 (28.5) | .040 |
| Lacunar | 165 (17.6) | 94 (19.8) | 71 (15.3) | .015 |
| Undetermined | 230 (24.6) | 116 (24.5) | 114 (24.7) | .482 |
| Rare | 23 (2.4) | 16 (3.4) | 7 (1.5) | .021 |
| Stroke severity | ||||
| NIHSS score on admission, mean±SD | 8.48±6.85 | 8.49±6.78 | 8.48±6.93 | .345 |
| By stroke type | ||||
| Ischaemic stroke, mean±SD | 8.36±6.85 | 8.24±6.79 | 8.48±6.93 | .272 |
| Haemorrhagic stroke, mean±SD | 9.37±6.81 | 10.01±6.61 | 8.46±7.040 | .200 |
| Fibrinolysis performed, n (%)a | 141 (15.06) | 48 (10.12) | 93 (20.12) | <.001 |
| In-hospital complications, n (%) | ||||
| Systemic | 92 (8.6) | 50 (9.1) | 42 (8) | .461 |
| Ischaemic | 71 (7.5) | 33 (7) | 38 (8.2) | .534 |
| Haemorrhagic | 21 (16.3) | 17 (22.5) | 4 (7) | .012 |
| Cardiovascular | 42 (3.9) | 20 (3.7) | 22 (4.2) | .682 |
| Ischaemic | 38 (4.1) | 17 (3.6) | 21 (4.5) | .459 |
| Haemorrhagic | 4 (2.9) | 3 (4.2) | 1 (1.7) | .231 |
| Neurological | 139 (13) | 60 (10.9) | 79 (15.5) | .023 |
| Ischaemic | 99 (10.6) | 37 (7.8) | 62 (13.4) | .003 |
| Haemorrhagic | 40 (30.8) | 23 (30.1) | 17 (30.3) | .817 |
| NIHSS at discharge, mean±SD | 5.81±7.45 | 5.74±7.29 | 5.88±7.62 | .561 |
| By stroke type | ||||
| Ischaemic stroke, mean±SD | 5.51±7.24 | 5.26±7.04 | 5.76±7.43 | .141 |
| Haemorrhagic stroke, mean±SD | 7.91±8.54 | 8.63±8.14 | 6.91±9.05 | .096 |
SD: standard deviation; IS: ischaemic stroke; LACI: lacunar cerebral infarction; NIHSS: National Institute of Health Stroke Scale; OCSP: Oxfordshire Community Stroke Project; PACI: partial anterior cerebral infarction; POCI: posterior cerebral infarction; TACI: total anterior cerebral infarction; TOAST: Trial of Org 10172 in Acute Stroke.
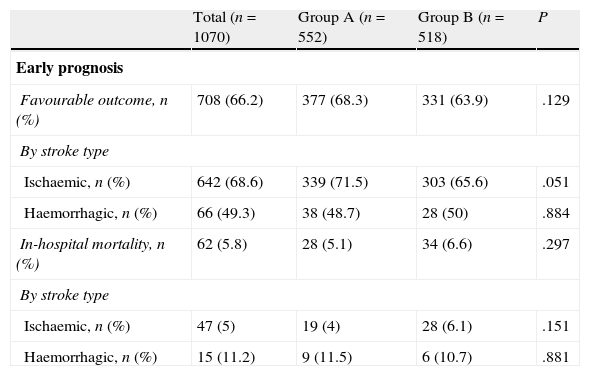
Regarding early outcome and outcomes at 90 days (Table 2), there were no significant differences for early favourable outcome (68.3% vs 63.9%) or for mortality, whether in-hospital (5.1% vs 6.6%) or at 90 days (12.8% vs 13.1%). Group B contained a higher percentage of patients who were functionally independent at 90 days (56.3% vs 65.5%; P=.03); this difference was significant for both ischaemic stroke (58.5% vs 65.2%) and haemorrhagic stroke (42.9% vs 68%).
Patient outcomes.
| Total (n=1070) | Group A (n=552) | Group B (n=518) | P | |
| Early prognosis | ||||
| Favourable outcome, n (%) | 708 (66.2) | 377 (68.3) | 331 (63.9) | .129 |
| By stroke type | ||||
| Ischaemic, n (%) | 642 (68.6) | 339 (71.5) | 303 (65.6) | .051 |
| Haemorrhagic, n (%) | 66 (49.3) | 38 (48.7) | 28 (50) | .884 |
| In-hospital mortality, n (%) | 62 (5.8) | 28 (5.1) | 34 (6.6) | .297 |
| By stroke type | ||||
| Ischaemic, n (%) | 47 (5) | 19 (4) | 28 (6.1) | .151 |
| Haemorrhagic, n (%) | 15 (11.2) | 9 (11.5) | 6 (10.7) | .881 |
| Total (n=1021) | Group A (n=540) | Group B (n=481) | P | |
| Prognosis at 90 daysa | ||||
| Sample total | ||||
| Rankin, median (range) | 2 (1–4) | 2 (1–5) | 2 (1–4) | .018 |
| Independent, n (%) | 619 (60.6) | 304 (56.3) | 315 (65.5) | .003 |
| Mortality, n (%) | 132 (12.9) | 69 (12.8) | 63 (13.1) | .879 |
| By stroke type | ||||
| Ischaemic, n (%) | 894 | 463 | 431 | .304 |
| Rankin, median (range) | 2 (1–4) | 2 (1–5) | 2 (1–4) | .04 |
| Independent, n (%) | 552 (61.7) | 271 (58.5) | 281 (65.2) | .419 |
| Mortality, n (%) | 108 (12.1) | 52 (11.2) | 56 (13) | |
| Haemorrhagic, n (%) | 127 | 77 | 50 | .001 |
| Rankin, median (range) | 2 (1–5) | 4 (2–5) | 2 (0–3) | .006 |
| Independent, n (%) | 67 (52.8) | 33 (42.9) | 34 (68) | .256 |
| Mortality, n (%) | 24 (18.9) | 17 (22.1) | 7 (14) | |
NIHSS: National Institute of Health Stroke Scale.
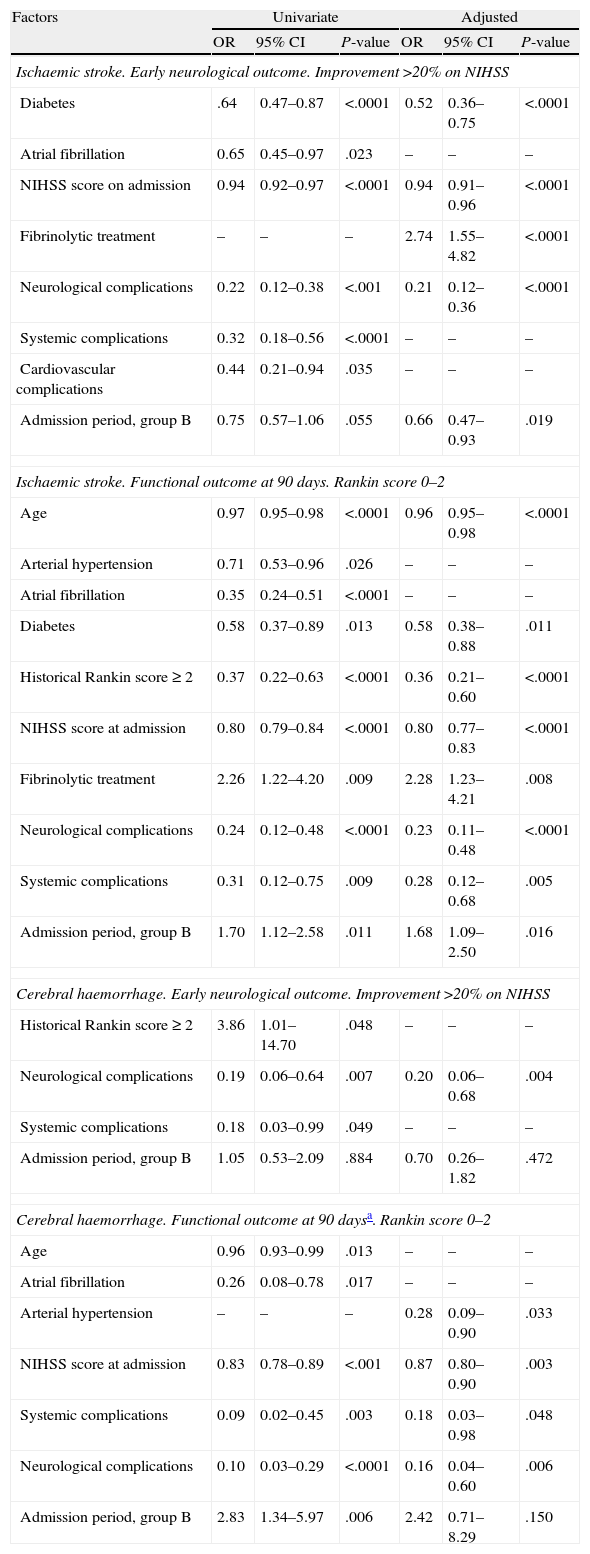
For factors associated with early favourable outcome and functional independence at 90 days (Table 3), we observe that for ischaemic stroke, the hospitalisation period was not linked to early favourable outcome according to the univariate analysis. However, a significant association could be observed after the adjusted analysis (group B: OR=0.66 (0.47–0.93). The admission period for group B was positively associated with functional independence in both the univariate analysis (OR=1.70 [1.12–2.58]) and in the adjusted analysis (OR=1.68 [1.09–2.50]). For cases of haemorrhagic stroke, the admission period was not associated with early favourable outcome. Admission period was associated with functional independence at 90 days according to the univariate analysis (group B: OR=2.83 [1.34–5.97]; P=.006), but this was not the case in the adjusted analysis (group B: OR=2.42 [95% CI, 0.71–8.29]; P=.150).
Factors associated with early favourable neurological outcome and independence at 90 days.
| Factors | Univariate | Adjusted | ||||
| OR | 95% CI | P-value | OR | 95% CI | P-value | |
| Ischaemic stroke. Early neurological outcome. Improvement >20% on NIHSS | ||||||
| Diabetes | .64 | 0.47–0.87 | <.0001 | 0.52 | 0.36–0.75 | <.0001 |
| Atrial fibrillation | 0.65 | 0.45–0.97 | .023 | – | – | – |
| NIHSS score on admission | 0.94 | 0.92–0.97 | <.0001 | 0.94 | 0.91–0.96 | <.0001 |
| Fibrinolytic treatment | – | – | – | 2.74 | 1.55–4.82 | <.0001 |
| Neurological complications | 0.22 | 0.12–0.38 | <.001 | 0.21 | 0.12–0.36 | <.0001 |
| Systemic complications | 0.32 | 0.18–0.56 | <.0001 | – | – | – |
| Cardiovascular complications | 0.44 | 0.21–0.94 | .035 | – | – | – |
| Admission period, group B | 0.75 | 0.57–1.06 | .055 | 0.66 | 0.47–0.93 | .019 |
| Ischaemic stroke. Functional outcome at 90 days. Rankin score 0–2 | ||||||
| Age | 0.97 | 0.95–0.98 | <.0001 | 0.96 | 0.95–0.98 | <.0001 |
| Arterial hypertension | 0.71 | 0.53–0.96 | .026 | – | – | – |
| Atrial fibrillation | 0.35 | 0.24–0.51 | <.0001 | – | – | – |
| Diabetes | 0.58 | 0.37–0.89 | .013 | 0.58 | 0.38–0.88 | .011 |
| Historical Rankin score ≥ 2 | 0.37 | 0.22–0.63 | <.0001 | 0.36 | 0.21–0.60 | <.0001 |
| NIHSS score at admission | 0.80 | 0.79–0.84 | <.0001 | 0.80 | 0.77–0.83 | <.0001 |
| Fibrinolytic treatment | 2.26 | 1.22–4.20 | .009 | 2.28 | 1.23–4.21 | .008 |
| Neurological complications | 0.24 | 0.12–0.48 | <.0001 | 0.23 | 0.11–0.48 | <.0001 |
| Systemic complications | 0.31 | 0.12–0.75 | .009 | 0.28 | 0.12–0.68 | .005 |
| Admission period, group B | 1.70 | 1.12–2.58 | .011 | 1.68 | 1.09–2.50 | .016 |
| Cerebral haemorrhage. Early neurological outcome. Improvement >20% on NIHSS | ||||||
| Historical Rankin score≥2 | 3.86 | 1.01–14.70 | .048 | – | – | – |
| Neurological complications | 0.19 | 0.06–0.64 | .007 | 0.20 | 0.06–0.68 | .004 |
| Systemic complications | 0.18 | 0.03–0.99 | .049 | – | – | – |
| Admission period, group B | 1.05 | 0.53–2.09 | .884 | 0.70 | 0.26–1.82 | .472 |
| Cerebral haemorrhage. Functional outcome at 90 daysa. Rankin score 0–2 | ||||||
| Age | 0.96 | 0.93–0.99 | .013 | – | – | – |
| Atrial fibrillation | 0.26 | 0.08–0.78 | .017 | – | – | – |
| Arterial hypertension | – | – | – | 0.28 | 0.09–0.90 | .033 |
| NIHSS score at admission | 0.83 | 0.78–0.89 | <.001 | 0.87 | 0.80–0.90 | .003 |
| Systemic complications | 0.09 | 0.02–0.45 | .003 | 0.18 | 0.03–0.98 | .048 |
| Neurological complications | 0.10 | 0.03–0.29 | <.0001 | 0.16 | 0.04–0.60 | .006 |
| Admission period, group B | 2.83 | 1.34–5.97 | .006 | 2.42 | 0.71–8.29 | .150 |
95% CI: 95% confidence interval; NIHSS: National Institutes of Health Stroke Scale; OR: odds ratio.
Admission period was not significantly related to either in-hospital or 90-day mortality rates, in either the univariate or multivariate analyses. In the univariate analysis for ischaemic stroke, the admission period for group B reached an OR of 1.54 (0.85–2.80, P=.153) for in-hospital mortality; for 90-day mortality, OR was 1.18 (0.78–1.76 P=.420). Fig. 1 shows how admission period for the ischaemic stroke group was not associated with either in-hospital mortality (group B: OR=2.51 [0.977–4.736]; P=.051) or 90-day mortality (group B: OR=1.394 [0.822–2.599]; P=.105). For haemorrhagic stroke, the admission period was not significantly associated with mortality, whether in-hospital or at 90 days (OR=0.92 [0.308–2.751]; P=.881 and OR 0.575 [0.219–1.506]; P=.260, respectively). In the adjusted analysis, the main predictor of in-hospital mortality was NIHSS score at admission (OR=1.399 [1.140–1.717], P<.0001). The main predictors of 90-day mortality were NIHSS score at admission (OR=1.158 [1.033–1.288]; P<.0001); age (OR=1.123 [1.022–1.234], P=.014); presence of atrial fibrillation (OR=9.19 [1.432–58.979], P=.001); and appearance of systemic complications (OR=23.058 [95% CI 4.145–128.12]; P<.0001).
 Factors predicting in-hospital mortality. Adjusted multivariate analysis. Hosmer–Lemeshov test 2.241 (P=.973). ROC 0.883 (0.830–0.936) P<.0001. (B) Factors predicting 90-day mortality. Adjusted multivariate analysis. Hosmer–Lemeshov test 3.976 (P=.944). ROC 0.858 (0.815–0.901) P<.0001.")
(A) Factors predicting in-hospital mortality. Adjusted multivariate analysis. Hosmer–Lemeshov test 2.241 (P=.973). ROC 0.883 (0.830–0.936) P<.0001. (B) Factors predicting 90-day mortality. Adjusted multivariate analysis. Hosmer–Lemeshov test 3.976 (P=.944). ROC 0.858 (0.815–0.901) P<.0001.
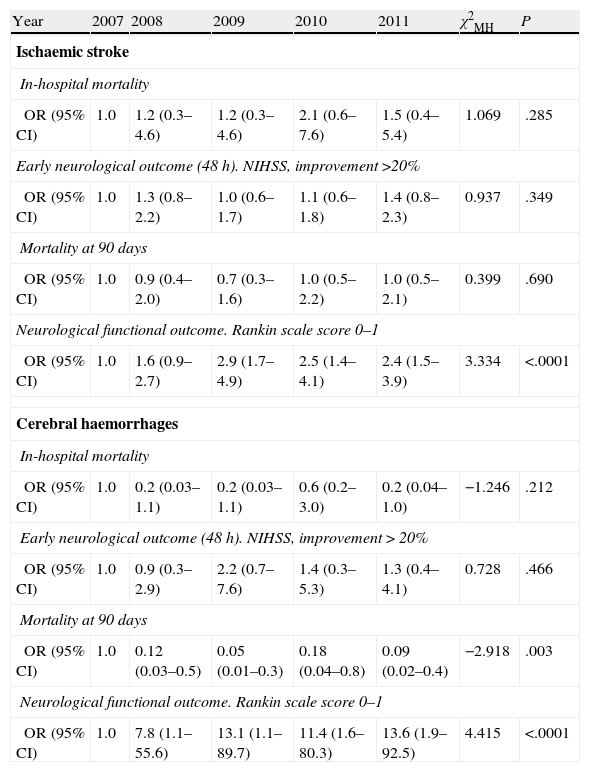
Tendency analysis (Table 4) for in-hospital mortality, mortality at 90 days, early prognosis, and outcome at 90 days showed that the functional outcome of independence at 90 days was significantly related to the admission period for both the ischaemic and haemorrhagic stroke groups.
Mantel–Haenszel chi-square test by aetiological subtype and year of admission for each of the prognostic variables in the study.
| Year | 2007 | 2008 | 2009 | 2010 | 2011 | χ2MH | P |
| Ischaemic stroke | |||||||
| In-hospital mortality | |||||||
| OR (95% CI) | 1.0 | 1.2 (0.3–4.6) | 1.2 (0.3–4.6) | 2.1 (0.6–7.6) | 1.5 (0.4–5.4) | 1.069 | .285 |
| Early neurological outcome (48 h). NIHSS, improvement >20% | |||||||
| OR (95% CI) | 1.0 | 1.3 (0.8–2.2) | 1.0 (0.6–1.7) | 1.1 (0.6–1.8) | 1.4 (0.8–2.3) | 0.937 | .349 |
| Mortality at 90 days | |||||||
| OR (95% CI) | 1.0 | 0.9 (0.4–2.0) | 0.7 (0.3–1.6) | 1.0 (0.5–2.2) | 1.0 (0.5–2.1) | 0.399 | .690 |
| Neurological functional outcome. Rankin scale score 0–1 | |||||||
| OR (95% CI) | 1.0 | 1.6 (0.9–2.7) | 2.9 (1.7–4.9) | 2.5 (1.4–4.1) | 2.4 (1.5–3.9) | 3.334 | <.0001 |
| Cerebral haemorrhages | |||||||
| In-hospital mortality | |||||||
| OR (95% CI) | 1.0 | 0.2 (0.03–1.1) | 0.2 (0.03–1.1) | 0.6 (0.2–3.0) | 0.2 (0.04–1.0) | −1.246 | .212 |
| Early neurological outcome (48 h). NIHSS, improvement>20% | |||||||
| OR (95% CI) | 1.0 | 0.9 (0.3–2.9) | 2.2 (0.7–7.6) | 1.4 (0.3–5.3) | 1.3 (0.4–4.1) | 0.728 | .466 |
| Mortality at 90 days | |||||||
| OR (95% CI) | 1.0 | 0.12 (0.03–0.5) | 0.05 (0.01–0.3) | 0.18 (0.04–0.8) | 0.09 (0.02–0.4) | −2.918 | .003 |
| Neurological functional outcome. Rankin scale score 0–1 | |||||||
| OR (95% CI) | 1.0 | 7.8 (1.1–55.6) | 13.1 (1.1–89.7) | 11.4 (1.6–80.3) | 13.6 (1.9–92.5) | 4.415 | <.0001 |
95% CI: 95% confidence interval; NIHSS: National Institutes of Health Stroke Scale; OR: odds ratio; χ2MH: Mantel–Haenszel chi-square test.
This study shows that our results for both early outcome and functional outcome at 90 days for patients admitted to SUs are similar to published results from other SUs in our setting.12 They also confirmed that functional outcome in stroke patients at 3 months was better in patients admitted to the stroke unit more recently, when cumulative experience in the SU was more extensive.19 There were no differences with regard to early favourable outcome or mortality.
Factors associated with poorer early outcome and higher mortality rates, whether in-hospital or at 90 days, were presence of diabetes mellitus, atrial fibrillation, severity of the stroke at admission, and appearance of complications. These variables are all amply supported by the literature.20 Time criteria, used here to define groups A and B, were not likely to have affected patient outcomes since care and treatment had already been fully protocolised in our SU. After the adjusted analysis, the 2 groups show different results for poor early favourable outcome among patients with ischaemic stroke. This is probably due to the fact that neurological complications were more frequent in group B, the group containing a higher percentage of more severe strokes (TACI). However, these differences in the distribution of ischaemic stroke subtypes did not affect in-hospital mortality or mortality at 90 days; this was probably due to the higher number of fibrinolytic treatments delivered to group B patients with TACI.
We did observe differences in functional outcome at 90 days between patients with ischaemic or haemorrhagic stroke. In the case of ischaemic stroke, the differences we observed could not be attributed to the patients’ demographic characteristics or to stroke severity at admission, since values were similar in both groups and to values from patients cared for by other SUs.12,22 Despite the association in our study between stroke severity at admission and poorer functional outcome, and recent descriptions of poorer functional outcome among SU patients with lacunar infarct,23 the effect of a different distribution of stroke subtypes in our series could not be linked to functional situation at 90 days after performing the adjusted analysis. The conclusions are the same regarding fibrinolytic treatment; as was to be expected, given increases in the length of the therapeutic window24 and in the numbers of referrals from other hospitals,21 fibrinolytic treatment was more frequent among patients in group B. However, after an adjusted analysis, patients in group B still displayed better functional outcomes at 90 days. For patients with haemorrhagic stroke in group B, the loss of an association between the admission period and functional independence at 90 days in the adjusted analysis may be due to the different frequency of systemic complications in the 2 groups. Appearance of complications of this type is one of the main predictors of poor functional outcome at 90 days.
Based on results from this study, it is difficult to determine why patients in group B presented better functional outcomes at 90 days. Several different factors appear to link care in an SU with lower mortality and a higher likelihood of independence, especially early-stage specialist care, monitoring of factors related to poorer outcomes, and early prevention and detection of neurological and systemic complications.25–27 In our case, considering that there were no changes in the stroke care team during the study period, it is likely that increased experience would have yielded better care with regard to the factors listed above. Furthermore, improved connections with non-hospital services, resulting in earlier care for stroke patients, and closer ties to rehabilitation services, plus earlier initiation of rehabilitation therapy, have been linked to better functional outcomes.28,29 The yearly volume of patients admitted to our SU grew gradually from 261 in 2008 to 350 in 2011. This factor appears to have a significant effect on patients’ functional outcomes, and this is principally due to the quality of the care they receive. However, as our experience shows, this does not appear to affect mortality rates.19
One of our study's limitations is the arbitrariness of the dates chosen to define groups A and B. However, given that our SU has been in service for 54 months, we decided that patient groups should span at least 2 years so that both groups would be larger and more homogeneous. This would serve to avoid biases potentially arising from data for patients who were hospitalised during shorter times. This approach delivered a large sample for both groups in our analysis. Groups also displayed homogeneous patient characteristics, stroke types, and stroke severity, but this was not the case for subtypes of ischaemic stroke or for the percentage of patients treated with systemic fibrinolysis.
We can therefore conclude, based on our study that functional independence at 90 days was more likely for patients admitted to our SU in 2010–2011 than for those admitted in 2007–2009, but that there were no differences in early outcome or 90-day mortality. Without overlooking the limitations we have described, this difference may be related to the experience acquired by the staff providing care in the stroke unit.
Conflicts of interestThe authors have no conflicts of interest to declare.
We would like to thank the nursing staff in the neurology department, our hospital's physiotherapists, and emergency room staff and paramedics throughout Extremadura.
Please cite this article as: Portilla-Cuenca JC, Ramírez-Moreno JM, López-Espuela F, Romero-Sevilla RM, Jiménez-Caballero PE, Fermín-Marrero JA, et al. Situación funcional tras un ictus y experiencia acumulada de una unidad de ictus. Neurología. 2014;29:271–279.
