Buscar en
Neurología (English Edition)
Toda la web
Inicio Neurología (English Edition) Clinically isolated syndrome: Diagnosis and risk of developing clinically defini...
Journal Information
Vol. 38. Issue 9.
Pages 663-670 (November - December 2023)
Visits
1083
Vol. 38. Issue 9.
Pages 663-670 (November - December 2023)
Review article
Full text access
Clinically isolated syndrome: Diagnosis and risk of developing clinically definite multiple sclerosis
Síndrome clínico aislado: diagnóstico y riesgo dedesarrollar esclerosis múltiple clínicamente definida
Visits
1083
J. López-Gómeza,
Corresponding author
lopezhospi@gmail.com

Corresponding author.
, B. Sacristán Encisob, M.A. Caro Miróc, M.R. Querol Pascuald
a Unidad de Proteínas, Servicio de Análisis Clínicos, Hospital Universitario de Badajoz, Badajoz, Spain
b Sección de Proteínas y Autoinmunidad, Servicio de Análisis Clínicos, Hospital de Mérida, Badajoz, Spain
c Servicio de Análisis Clínicos, Hospital Universitario de Badajoz, Badajoz, Spain
d Servicio de Neurología, Hospital Universitario de Badajoz, Badajoz, Spain
This item has received
Article information
Abstract
Full Text
Bibliography
Download PDF
Statistics
Tables (5)
Table 1. Risk of conversion of CIS to CDMS as a function of the number of T2-weighted lesions on the MRI.
Table 2. Rate of conversion to CDMS as a function of the percentage of patients with positive and negative OCB.
Table 3. Comparison of lesions on MRI according to the Barkhof/Tintoré criteria and the 2010 McDonald criteria, and presence of OCB in predicting the conversion of CIS to CDMS.
Table 4. Risk of conversion from CIS to CDMS according to presence of OCB and number of T2-weighted lesions (MRI).
Table 5. Rate of conversion of CIS to CDMS according to the number of T2-weighted lesions (MRI), presence of OCB and IgM OCB. Of 205 patients with CIS, 150 progressed to CDMS (55 [36%] within a year).
Show moreShow less
Abstract
Introduction

In most cases, multiple sclerosis (MS) initially presents as clinically isolated syndrome (CIS). Differentiating CIS from other acute or subacute neurological diseases and estimating the risk of progression to clinically definite MS is essential since presenting a second episode in a short time is associated with poorer long-term prognosis.

Development

We conducted a literature review to evaluate the usefulness of different variables in improving diagnostic accuracy and predicting progression from CIS to MS, including magnetic resonance imaging (MRI) and such biofluid markers as oligoclonal IgG and IgM bands, lipid-specific oligoclonal IgM bands in the CSF, CSF kappa free light-chain (KFLC) index, neurofilament light chain (NfL) in the CSF and serum, and chitinase 3–like protein 1 (CHI3L1) in the CSF and serum.

Conclusions

Codetection of oligoclonal IgG bands and MRI lesions reduces diagnostic delays and suggests a high risk of CIS progression to MS. A KFLC index > 10.6 and CSF NfL concentrations > 1150 ng/L indicate that CIS is more likely to progress to MS within one year (40%–50%); 90% of patients with CIS and serum CHI3L1 levels > 33 ng/mL and 100% of those with lipid-specific oligoclonal IgM bands present MS within one year of CIS onset.

Keywords:
Multiple sclerosis
Clinically isolated syndrome
Magnetic resonance imaging
Oligoclonal bands
Kappa free light-chains
Neurofilament light chain
Chitinase 3–like protein 1
Resumen
Introducción

La mayoría de los pacientes con esclerosis múltiple (EM) debutan con un síndrome clínico aislado (SCA). Es importante diferenciar este SCA de otras patologías neurológicas agudas o subagudas y estimar el riesgo de desarrollar una esclerosis múltiple clínicamente definida (EMCD), pues un segundo ataque clínico en un corto periodo de tiempo se asocia con peor pronóstico a largo plazo.

Desarrollo

Se realizó una revisión bibliográfica con el objetivo de contrastar diferentes variables, tales como la resonancia magnética (RM) y diferentes marcadores biofluídicos como las bandas oligoclonales IgG (BOC), bandas oligoclonales IgM (BOCM), bandas oligoclonales IgM lípido específicas (BOCM-LE), índice de cadenas ligeras libres Kappa (κ index) mediante la determinación de las cadenas ligera libres kappa en líquido cefalorraquídeo (LCR), neurofilamentos de cadenas ligeras en LCR (NfLL) y suero (NfLS) y la proteína chitinasa 3-like 1 (CHI3L1) en LCR (CHI3L1L) y suero (CHI3L1S), con el objetivo de mejorar la precisión diagnóstica y predecir los riesgos de un segundo ataque clínico tras un SCA.

Conclusión

Unas BOC positivas junto con la identificación de lesiones por RM, reducirán el tiempo de diagnóstico y nos indicaran que la mayoría de los pacientes con SCA evolucionaran a EM. Un κ index >10.6 y una concentración de NfLL > 1150 ng/L, nos indican que los SCA tienen más probabilidades de convertirse en EM durante el primer año (40%/50%). El 90% de los pacientes con SCA y niveles de CHI3L1S >33 ng/mL, y el 100% con presencia BOCM-LE se convierten en EM durante el primer año.

Palabras clave:
Esclerosis multiple
Síndrome clínico aislado
Resonancia magnética
Bandas oligoclonales
Cadenas ligeras libres Kappa
Neurofilamentos de cadenas ligeras
Chitinasa 3-like 1
Full Text
Introduction

Clinically isolated syndrome (CIS) is the clinical status characterised by central nervous system (CNS) inflammation and demyelination suggestive of multiple sclerosis (MS), in the absence of other alternative diagnoses.1,2 MS initially manifests as CIS in approximately 85% of patients, and is converted to clinically definite multiple sclerosis (CDMS) when patients develop a second relapse. Prospective studies show that between 60% and 70% of patients with CIS develop CDMS within 20 years.3 Currently, no pathognomonic evidence or clinical characteristic exists that diagnoses MS in isolation. Diagnosis is established after exclusion of alternative diagnoses based on medical history, physical examination, MRI findings, and laboratory findings (biofluid markers), together with the clinician’s judgement.4

Identifying risk of conversion from CIS to CDMS is especially relevant, as conversion within a short period of time is associated with poorer prognosis and severe disability. Therefore, patients at greater risk may benefit from highly effective treatments (with greater associated risk), whereas those at lower risk would be prescribed other safer but less effective treatments.5–7 Therefore, it is important to identify cerebrospinal fluid (CSF) and blood biomarkers that may help us predict this conversion.

This review article analyses MRI findings and biofluid markers that may meet this objective (IgG oligoclonal bands [OCB], IgM oligoclonal bands [IgM OCB], lipid-specific oligoclonal IgM OCB, kappa free light chain index [kappa index], neurofilament light chain [NfL] in the CSF and serum, and chitinase 3-like protein 1 [CHI3L1] in the CSF [CSF-CHI3L1] and serum [sCHI3L1]), with the aim of assessing their diagnostic accuracy and identifying which of them may more efficiently predict the risk of a second clinical episode after CIS.

Diagnosis of CIS

According to the McDonald diagnostic criteria, a patient with CIS may be diagnosed with MS if the first MRI study meets criteria for dissemination in space (DIS) and dissemination in time (DIT), or if OCB are detected, which may replace a clinical event or DIT in the MRI study.8

MRI scans are widely used to support this clinical diagnosis,9 as is intrathecal IgG synthesis in patients presenting CIS. MRI is the most widely used tool to assess these patients10,11; it is useful in analysing DIS and DIT, thus contributing to early diagnosis of MS.12 According to several studies, between 50% and 80% of patients with CIS present lesions of demyelinating appearance in the initial brain MRI scan13–15; however, T2-weighted sequences may show at least one white-matter lesion in 91% of these patients.16

When the MRI scan is assessed based on 3 of the 4 Barkhof/Tintoré criteria (MRI-BT), it shows high specificity (70%-88%) and moderate sensitivity (49%–82%),17–20 whereas assessment based on the McDonald criteria for demonstration of DIS9 shows a better sensitivity (72%) without losing specificity, as shown by Swanton et al.21–23

Intrathecal IgG synthesis determined by OCB detection represents an important tool for the diagnosis of MS.24 In CIS, OCB are detected in 61.02%–70% of patients, and MRI findings, when assessed according to the MRI-BT criteria, are positive in 53.5%–64%.25,26 OCB are more accurate overall than MRI-BT (sensitivity 78% vs 70%, specificity 65% vs 48%, positive predictive value [PPV] 62% vs 50%, negative predictive value [NPV] 80% vs 68%, and accuracy 70% vs 58%).26 However, when MRI findings were assessed according to the 2010 McDonald criteria,27 in a study conducted by Teixeira et al.28 in 82 patients with symptoms of CIS, they were classified as positive in 63 (76%), whereas OCB were present in 48 (58%) (it is important to highlight that OCB were not determined in the total sample, only in 69 patients); diagnosis of CIS was confirmed in 10 patients with OCB and MRI findings showing no demyelinating lesions, and another 16 with negative results for OCB and with MRI showing demyelinating lesions.

When patients were diagnosed based on abnormal MRI findings, rather than clinical suspicion of MS, the rate of non-confirmation was much higher (89% vs 54%).29 MRI studies are generally inconclusive, especially in the first stages of the disease30 and in patients with suspected MS and presenting vascular risk factors, migraine, or atypical symptoms; in these cases, OCB are usually negative, but positive findings may play a significant role when ruling out other causes of demyelinating lesions in MRI.31

Furthermore, it should be noted that OCB are not exclusive to MS, as they are also found in other inflammatory and infectious diseases affecting the CNS,32 such as vascular, metabolic, or degenerative diseases.33,34 Also, the methods used to detect OCB require expert laboratories for correct interpretation, which may cause variability in results. However, the McDonald criteria have enhanced the role of OCB results in the CSF, and have increased the value of MRI findings by including cortical and symptomatic lesions. Both biomarkers have potential to decrease the time to diagnosis.8 Thus, presence of OCB together with MRI lesions may improve overall diagnostic accuracy by increasing the specificity and the NPV of MRI findings.12,35

IgM OCB are not a good parameter for diagnosing CIS, as they are only observed in 28%-55% of patients with CDMS,36,37 a much lower rate than OCB and MRI lesions.25,26,28

A κ index > 10.62 is a good parameter to confirm CIS. In the study by Menéndez et al.,38 the κ index did not show statistically significant differences between patients from the 3 control groups: individuals with normal pressure hydrocephalus, patients with other non-inflammatory neurological diseases, and patients with inflammatory neurological diseases other than MS; the value identified in the patients from these 3 groups was 1.96 (1.13–3.56). However, they did observe statistically significant differences between values from individuals in the control groups and those with CIS. The value of the κ index was 35.61 (4.48–132.73) in the latter group. Although κ index > 10.62 presents slightly lower sensitivity and specificity than OCB (93.1 vs 96.5% and 95.7% vs 98.6%), a κ index is the most interesting alternative to OCB determination in the detection of MS.38 A free kappa index ≥ 5.9 is useful as a more sensitive marker of intrathecal IgG synthesis, though it is less specific (sensitivity of 96%; specificity of 86%) than OCB detection. Determination of this parameter may provide valuable diagnostic and prognostic information, especially in patients with CIS or suspected MS with negative results for OCB,39,40 and may reinforce the diagnostic value of negative OCB findings with presence of MRI lesions, or vice-versa.

CSF-NfL and CHI3L1 are not specific to MS. Determining CSF-NfL or sNfL detects axonal lesions, which can result from many neurological diseases, such as white matter lesions and other types of subcortical damage,41–43 vascular disease (small-vessel disease),44,45 frontotemporal dementia,46 MS,47 idiopathic normal pressure hydrocephalus,48 amyotrophic lateral sclerosis,49 and several CNS infections50,51; therefore, these studies may be used mainly as a marker of axonal lesions, and not as a diagnostic marker of any specific neurological disease.52 The CHI3L1 protein is also not specific to MS, and usually increases in disorders potentially involving active inflammation, such as neuromyelitis optica, HIV infection, cerebrovascular disease, and Alzheimer disease. Serum levels of the protein may increase due to several inflammatory diseases, especially those progressing with chronic inflammation.53–56
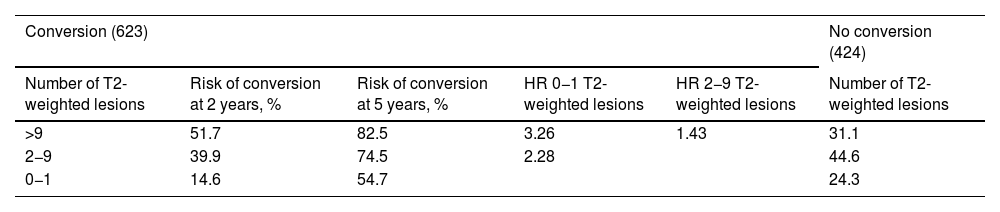
Prediction of conversion of CIS to CDMS

Several retrospective and prospective hospital studies report a rate of conversion from CIS to CDMS ranging from 16% in the first year to 60% at 2 years of follow-up.57–61 Different variables have shown to be useful in predicting this conversion, although MRI findings are the most reliable marker, presence of OCB and such other markers as NfL and CHI3L1 in both CSF and serum may play an important role.33,62 MRI is the most widely used tool to assess patients with clinical symptoms of CIS suggestive of MS, and its use to predict conversion to CDMS is widely accepted.63 Based on MRI results from 1047 cases of CIS from several studies, Kuhle et al.64 established a scale for predicting the risk of conversion to CDMS (Table 1), taking into account the McDonald criteria for DIS.65

Table 1.

Risk of conversion of CIS to CDMS as a function of the number of T2-weighted lesions on the MRI.

Conversion (623)No conversion (424) 
Number of T2-weighted lesions  Risk of conversion at 2 years, %  Risk of conversion at 5 years, %  HR 0−1 T2-weighted lesions  HR 2−9 T2-weighted lesions  Number of T2-weighted lesions 
>9  51.7  82.5  3.26  1.43  31.1 
2−9  39.9  74.5  2.28    44.6 
0−1  14.6  54.7      24.3 

CDMS: clinically defined multiple sclerosis; CIS: clinically isolated syndrome; HR: hazard ratio.

Source: Kuhle et al.64

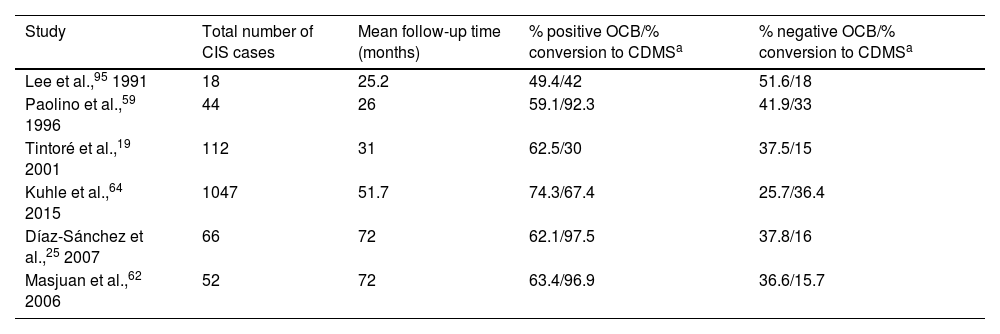
Presence of OCB is suggestive of high risk of conversion to CDMS.25,32 Various studies have shown how longer follow-up times are associated with higher rates of conversion in patients with OCB (Table 2).

Table 2.

Rate of conversion to CDMS as a function of the percentage of patients with positive and negative OCB.

Study  Total number of CIS cases  Mean follow-up time (months)  % positive OCB/% conversion to CDMSa  % negative OCB/% conversion to CDMSa 
Lee et al.,95 1991  18  25.2  49.4/42  51.6/18 
Paolino et al.,59 1996  44  26  59.1/92.3  41.9/33 
Tintoré et al.,19 2001  112  31  62.5/30  37.5/15 
Kuhle et al.,64 2015  1047  51.7  74.3/67.4  25.7/36.4 
Díaz-Sánchez et al.,25 2007  66  72  62.1/97.5  37.8/16 
Masjuan et al.,62 2006  52  72  63.4/96.9  36.6/15.7 

CDMS: clinically definite multiple sclerosis; CIS: clinically isolated syndrome; OCB: oligoclonal bands.

a

Percentage of conversion to CDMS as a function of the percentage of patients with positive and negative OCB.

Presence of OCB is associated with a two-fold increase in the risk of conversion to MS, compared to patients with negative OCB,66 with a hazard ratio (HR) of 2.49.64

The presence and number of CNS lesions in MRI and positive CSF OCB findings have been independently associated with a higher risk of conversion to MS.33,62,63,67 Patients with CIS who present OCB and more than 2 lesions on T2-weighted MRI sequences are at 21.69 times greater risk of conversion to CDMS.68

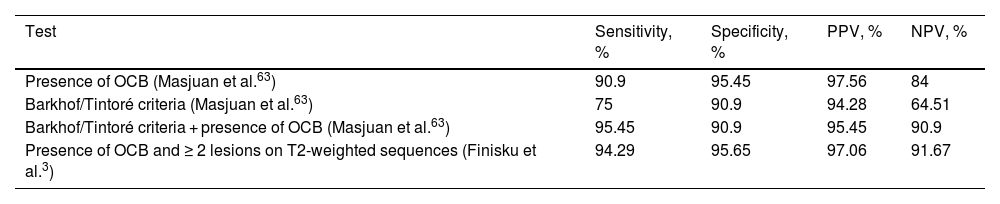
When both examinations are analysed together, results substantially improve (Table 3).

Table 3.

Comparison of lesions on MRI according to the Barkhof/Tintoré criteria and the 2010 McDonald criteria, and presence of OCB in predicting the conversion of CIS to CDMS.

Test  Sensitivity, %  Specificity, %  PPV, %  NPV, % 
Presence of OCB (Masjuan et al.6390.9  95.45  97.56  84 
Barkhof/Tintoré criteria (Masjuan et al.6375  90.9  94.28  64.51 
Barkhof/Tintoré criteria + presence of OCB (Masjuan et al.6395.45  90.9  95.45  90.9 
Presence of OCB and ≥ 2 lesions on T2-weighted sequences (Finisku et al.394.29  95.65  97.06  91.67 

CDMS: clinically defined multiple sclerosis; CIS: clinically isolated syndrome; MRI: magnetic resonance imaging; NPV: negative predictive value; OCB: oligoclonal bands; PPV: positive predictive value.

Thus, presence of OCB and MRI lesions suggest that the great majority of patients with CIS would progress to CDMS. However, these parameters are less useful in predicting progression at very early stages of the disease.16,69 Subjects at higher risk, those presenting OCB and more than 9 lesions on T2-weighted MRI sequences, are more likely to progress early (Table 4).

Table 4.

Risk of conversion from CIS to CDMS according to presence of OCB and number of T2-weighted lesions (MRI).

Test  % conversion at 2 years  % conversion at 5 years 
OCB + 0−1 T2-weighted MRI lesions  19.2  69.9 
OCB + 2−9 T2-weighted MRI lesions  43.9  77 
OCB + > 9 T2-weighted MRI lesions  57  86 

CDMS: clinically definite multiple sclerosis; CIS: clinically isolated syndrome; MRI: magnetic resonance imaging; OCB: positive findings for oligoclonal bands.

Source: Kuhle et al.64

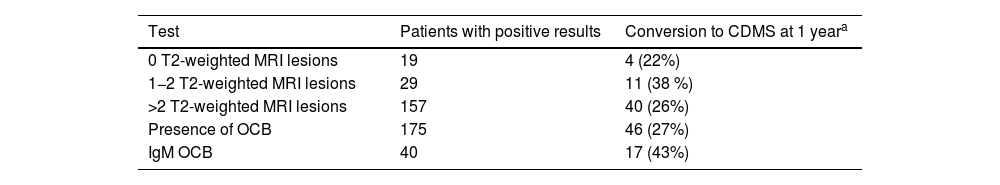
Between 28% and 55% of patients with CDMS present positive IgM OCB findings.36,37 In a study by Ferraro et al.,16 including 55 patients with CIS who progressed to CDMS, 40 presented IgM OCB. Median time until relapse was 35 months for patients with negative IgM OCB. In patients with presence of OCB, the median time was 20 months, decreasing to 12 months if the CIS manifested before the age of 30. These results are similar to those reported by Villar et al.69 and Boscá et al.66 The risk of relapse increased with presence of IgM OCB in the CSF only, with 17 of these patients (43%) progressing to CDMS during the first year of follow-up (Table 5).16

Table 5.

Rate of conversion of CIS to CDMS according to the number of T2-weighted lesions (MRI), presence of OCB and IgM OCB. Of 205 patients with CIS, 150 progressed to CDMS (55 [36%] within a year).

Test  Patients with positive results  Conversion to CDMS at 1 yeara 
0 T2-weighted MRI lesions  19  4 (22%) 
1−2 T2-weighted MRI lesions  29  11 (38 %) 
>2 T2-weighted MRI lesions  157  40 (26%) 
Presence of OCB  175  46 (27%) 
IgM OCB  40  17 (43%) 

CDMS: clinically definite multiple sclerosis; CIS: clinically isolated syndrome; IgM OCB: IgM oligoclonal bands; MRI: magnetic resonance imaging; OCB: IgG oligoclonal bands.

a

Percentage of patients with positive results.

Source: Ferraro et al.16

Presence of IgM OCB targeting myelin lipids leads to greater progression of disability.69–76 All patients with IgM OCB targeting myelin lipids (68% of IgM OCB) experienced a second relapse at 11 months of disease onset. Presence of IgM OCB was associated with higher risk of a second relapse (HR: 3.54; confidence interval: 1.65–7.55); however, the risk was considerably higher in patients with IgM OCB targeting myelin lipids (HR: 11.41).77

High levels of free light chains in the CSF also predict conversion of CIS to CDMS78–81; furthermore, previous studies correlate kappa free light chain levels in the CSF with MRI lesion load, and progression to MS in patients with isolated neuritis optica.81 Patients with CIS with a κ index > 10.62 present 7.34 times higher risk of conversion to MS. This index was also correlated with the presence of OCB and criteria for lesions in the MRI. With a κ index > 10.62, 71.4% of patients with CIS (35/49) progressed to MS, with a mean conversion time of 19 months. Approximately 40% progressed during the first year. Of the 28 patients with CIS and a κ index > 10.62, 89.3% of them did not progress to MS.38

CSF-NfL level is well correlated with lesions in the MRI.82–88 With a cut-off point > 500 ng/L, the great majority progressed to MS within 4–6 years.82 However, CSF-NfL level is a weak risk factor for predicting conversion to MS, and its value should be considered in the context of presence of OCB and radiological MRI findings (number of lesions in T2-weighted sequences).84,89,90 Despite this, high levels of CSF-NfL (>1208 ng/L) indicate higher risk of progression to MS, and have been associated with high numbers of lesions in T2-weighted sequences at baseline and during the first year of follow-up.84 Håkansson et al.82 observed that with values >1348 ng/L, 7 out of 9 (78%) cases of CIS progress within 2 years, whereas only one in 10 patients with lower values present conversion. Similar findings are reported by Mañé-Martínez et al.91 in 109 patients with CIS, with 53 showing values above 1150 ng/L. Of these, 50% presented conversion within one year (90% at 4 years). Lower values are associated with a one-year conversion rate of 18% (70% at 4 years).91 In a study of the serum of 222 patients, Dalla et al.92 observed high sNfL levels, above 40.4 pg/mL (75th percentile), in 78. These high values were correlated with presence in the baseline MRI of a high number of T2 and gadolinium-enhancing lesions, in addition to high risk of developing CDMS in 2 years.92 However, in a study comparing sNfL levels in patients with CIS who rapidly progressed to CDMS (79–139 days) and in those who did not progress (follow-up of 5.3−.9 years), Disanto et al.83 found that sNfL levels were not associated with faster progression to CDMS. The difference in sNfL levels between patients presenting rapid conversion and those without conversion was not statistically significant.84

CSF-CHI3L1 concentrations were significantly higher in patients with CIS who progressed to CDMS than in those who did not.54,91,93,94 However, the role of this protein as a biomarker associated with progression to MS is probably modest, although its function as prognostic biomarker is particularly relevant as predictor of disability. Nevertheless, patients presenting high sCHI3L1 levels (> 33 ng/mL) more rapidly progress to CDMS, with a likelihood of no conversion at 10 months of follow-up of 10%.94

Discussion

Currently, there is no single test that confirms a first clinical episode of MS. MRI studies are widely used to support this clinical diagnosis.9 When MRI is assessed according to the McDonald criteria for DIS,95 it shows good sensitivity (72%)21 and specificity (70%–88%),23 but is sometimes inconclusive.30 Detection of OCB presents higher sensitivity (78%) but poorer specificity (65%).26 However, the joint performance of MRI studies and OCB determination for the diagnosis of CIS presents greater overall diagnostic accuracy than either study in isolation, increasing the specificity and the NPV.12,35 A κ index > 10.62 is not present in other neurological diseases, whether inflammatory or non-inflammatory,78 and may help to confirm a clinical diagnosis in patients with negative results for OCB or inconclusive MRI findings.

MS begins as CIS in approximately 85% of patients,96,97 and 60%–70% of them will develop CDMS within a period of 20 years.3 It is very important to predict conversion to MS in early stages of CIS, as MS in these patients usually progresses more aggressively, and effective treatments may be prescribed to reduce disability progression. Both MRI and OCB determination are weak predictors of conversion from CIS to CDMS in the short term.70,79 Although this is also the case with the κ index and CSF-NfL concentration, patients with a κ index above 10.62 and CSF-NfL level >1150 ng/L present a higher risk of conversion (40% and 50%, respectively).38,92 In the study published by Hinsinger et al.,94 patients with sCHI3L1 levels >33 mg/mL more rapidly progressed to CDMS (90% in less than one year). The probability of avoiding a second episode at one year is very low (<10%).95

The presence of IgM OCB and lipid-specific IgM OCB limited to the CSF enables us to identify a group of patients with an immunopathogenic mechanism mediated by IgM antibodies and high likelihood of conversion to CDMS in a short period of time. Approximately 43% of patients with CIS and presenting a pattern of IgM OCB and age below 30 years progress to CDMS before one year; however, this risk increases to 100% when these patients present lipid-specific IgM OCB. All patients with lipid-specific IgM OCB (68% of all patients with IgM OCB) presented a second relapse before one year after disease onset.78

Conclusion

The identification of lesions in MRI studies according to McDonald criteria for DIS,65 together with presence of OCB, are indicators that the majority of patients with CIS progress to CDMS.

A κ index > 10.6, used as a marker of the immune system, and CSF-NfL > 1150 ng/L (marker of axonal damage) alert us that patients with CIS are more likely to progress to CDMS within one year (40%–50%).

Markers associated with the immune system (IgM OCB, and lipid-specific IGM OCB) identify a group of patients with CIS with a high probability of conversion to CDMS, especially those presenting lipid-specific IgM OCB (100%).

Serum CHI3L1 (>33 mg/mL) may enable us to detect a majority of patients at a higher risk of conversion to CDMS during the first year and with a more aggressive disease course.

Funding

This study received no funding of any kind.

Conflicts of interest

The authors have no conflicts of interest to declare.

References
[1]
P.A. Brex, J.I. O’Riordan, K.A. Miszkiel, I.F. Moseley, A.J. Thompson, G.T. Plant, et al.
Multisequence MRI in clinically isolated syndromes and the early development of MS.
Neurology, 53 (1999), pp. 1184-1190
[2]
D. Miller, F. Barkhof, X. Montalban, A. Thompson, M. Filippi.
Clinically isolated syndromes suggestive of multiple sclerosis, part I. natural history, pathogenesis, diagnosis, and prognosis.
Lancet Neurol, 4 (2005), pp. 281-288
[3]
L.K. Fisniku, P.A. Brex, D.R. Altmann, K.A. Miszkiel, C.E. Benton, R. Lanyet alon, et al.
Disability and T2 MRI lesions: a 20-year follow-up of patients with relapse onset of multiple sclerosis.
Brain, 131 (2008), pp. 808-817
[4]
A.J. Thompson, B.L. Banwell, F. Barkhof, W.M. Carroll, T. Coetzee, G. Comi, et al.
Diagnosis of multiple sclerosis: 2017 revisions of the McDonald criteria.
Lancet Neurol, 17 (2018), pp. 162-173
[5]
L.D. Jacobs, R.W. Beck, J.H. Simon, R.P. Kinkel, C.M. Brownscheidle, T.J. Murray, et al.
Intramuscular interferon beta-1a therapy initiated during a first demyelinating event in multiple sclerosis.
N Engl J Med, 343 (2000), pp. 898-904
[6]
L. Kappos, C.H. Polman, M.S. Freedman, G. Edan, H.P. Hartung, D.H. Miller, et al.
Treatment with interferon beta-1b delays conversion to clinically definite MS in clinically isolated syndromes.
[7]
B. Bielekova, M. McDermott.
Will CSF biomarkers guide future therapeutic decisions in multiple sclerosis.
Neurology, 84 (2015), pp. 1620-1621
[8]
W.M. Carroll.
2017 McDonald MS diagnostic criteria: Evidence-based revisions.
Multiple Sclerosis Journal, 24 (2018), pp. 92-95
[9]
C.H. Polman, S.C. Reingold, B. Banwell, M. Clanet, J.A. Cohen, M. Filippi, et al.
Diagnostic criteria for multiple sclerosis: 2010 revisions to the McDonald criteria.
Ann Neurol, 69 (2011), pp. 292-302
[10]
D. Miller, F. Barkhof, X. Montalban, A. Thompson, M. Filippi.
Clinically isolated syndromes suggestive of multiple sclerosis, part I. natural history, pathogenesis, diagnosis, and prognosis.
Lancet Neurol, 4 (2005), pp. 281-288
[11]
D. Miller, F. Barkhof, X. Montalban, A. Thompson, M. Filippi.
Clinically isolated syndromes suggestive of multiple sclerosis, part 2: non-conventional MRI, recovery processes, and management.
Lancet Neurol, 4 (2005), pp. 341-348
[12]
W.I. McDonald, A. Compston, G. Edan, D. Goodkin, H.P. Hartung, F.D. Lublin, et al.
Recommended diagnostic criteria for multiple sclerosis: guidelines from the International Panel on the diagnosis of multiple sclerosis.
Ann Neurol, 50 (2001), pp. 121-127
[13]
I.E. Ormerod, W.I. McDonald, G.H. du Boulay, B.E. Kendall, I.F. Moselay, A.M. Halliday, et al.
Disseminated lesions at presentation in patients with optic neuritis.
J Neurol Neurosurg Psychaitry, 49 (1986), pp. 124-127
[14]
I.E. Ormerod, A. Bronstein, P. Rudge, G. Johnson, D. Macmanus, A.M. Halliday, et al.
Magnetic resonance imaging in clinically isolated lesions of the brain stem.
J Neurol Neurosurg Psychiatry, 49 (1986), pp. 737-743
[15]
L. Jacobs, P.R. Kinkel, W.R. Kinkel.
Silent brain lesions in patients with isolated idiopathic optic neuritis. A clinical and nuclear magnetic resonance imaging study.
[16]
D. Ferraro, A.M. Simone, R. Bedin, V. Galli, F. Vitetta, L. Federzoni, et al.
Cerebrospinal fluid oligoclonal IgM bands predict early conversion to clinically definite multiple sclerosis in patients with Clinically Isolated Syndrome.
Journal of Neuroimmunology, 257 (2013), pp. 76-81
[17]
F. Barkhof, M. Filippi, D.H. Miller, P. Scheltens, A. Campi, C.H. Polman, et al.
Comparision of MRI criteria at first presentation to predict conversion to clinically definite multiple sclerosis.
Brain, 120 (1997), pp. 2059-2069
[18]
M. Tintoré, A. Rovira, M.J. Martínez, J. Rio, P. Díaz-Villoslada, L. Brieva, et al.
Isolated demyelinating syndromes: comparision of different MR imaging criteria to predict conversion to clinically definite multiple sclerosis.
Am J Neuroradiol, 21 (2000), pp. 702-706
[19]
M. Tintoré, A. Rovira, L. Brieva, E. Grivé, R. Jardí, C. Borrás, et al.
Isolated demyelinating syndromes: comparision of CFS oligoclonal bands and different MR imaging criteria to predict conversion to CDMS.
Multiple Sclerosis, 7 (2001), pp. 359-363
[20]
T. Korteweg, M. Tintoré, B. Uitdehaag, A. Rovira, J. Feredeiksen, D. Miller, et al.
MRI criteria for dissemination in space in patients with clinically isolated syndromes: a multicentre follow-up study.
Lancet Neurol, 5 (2006), pp. 221-227
[21]
J.K. Swanton, A. Rovira, M. Tintore´, D.R. Altmann, F. Barkhof, M. Filippi, et al.
MRI criteria for multiple sclerosis in patients presenting with clinically isolated syndromes: a multicentre retrospective study.
Lancet Neurol, 6 (2007), pp. 677-686
[22]
A. Rovira, J. Swanton, M. Tintore´, E. Huerga, F. Barkhof, M. Filippi, et al.
A single, early magnetic resonance imaging study in the diagnosis of multiple sclerosis.
[23]
M. Filippi, M.A. Rocca, O. Ciccarelli, N. De Stefano, N. Evangelou, L. Kappos, et al.
MRI criteria for the diagnosis of multiple sclerosis: MAGNIMS consensus guidelines.
Lancet Neurol, 15 (2016), pp. 292-303
[24]
M. Andersson, J. Alvarez-Cermeño, I. Cogato, P. Fredman, J. Frede-riksen, S. Fredrikson, et al.
Cerebrospinal fluid in the diagnosis of multiple sclerosis: a consensus report.
J Neurol Neurosurg Psychiatry, 57 (1994), pp. 897-902
[25]
M. Díaz-Sánchez, L.M. Villar, N. García-Barragán, M. Espiño, M.C. Sádaba, J.C. Álvarez-Cermeño, et al.
Aplicación de un nuevo método de detección de bandas oligoclonales en el estudio síndrome neurológico aislado.
Revista Española de Esclerosis Múltiple, 5 (2007),
[26]
V. Zipoli, B. Hakiki, E. Portaccio, F. Lolli, G. Siracusa, M. Giannini, et al.
The contribution of cerebrospinal fluid oligoclonal bands to the early diagnosis of multiple sclerosis.
Multiple Sclerosis, 15 (2009), pp. 472-478
[27]
J.K. Swanton, A. Rovira, M. Tintore´, et al.
MRI criteria for multiple sclerosis in patients presenting with clinically isolated syndromes: a multicentre retrospective study.
Lancet Neurol, 6 (2007), pp. 677-686
[28]
M. Teixeira, M. Seabra, Carvalho, L. Sequeira, P. Abreu, T. Mendonça, et al.
Clinically isolated syndrome, oligoclonal bands and multiple sclerosis.
Clin Exp Neuroimmunol, 11 (2020), pp. 33-39
[29]
M.J. Carmosino, K.M. Brousseau, D.B. Arciniegas, J.R. Corboy.
Initial evaluations for multiple sclerosis in a university multiple sclerosis center outcomes and role of magnetic resonance imaging in referral.
Arch Neurol, 62 (2005), pp. 585-590
[30]
M. Sandberg-Wollheim, T. Olsson.
Cerebrospinal fluid oligoclonal bands are important in the diagnosis of multiple sclerosis, unreasonably downplayed by the McDonald criteria 2010: Yes.
Mult Scler, 19 (2013), pp. 714-716
[31]
J.C. Álvarez-Cermeño, L.M. Villar.
Oligoclonal bands-a useful tool to avoid MS misdiagnosis.
Nat Rev Neurol, 9 (2013), pp. 303-304
[32]
R. Dobson, S. Ramagopalan, A. Davis, G. Giovannoni.
Cerebrospinal fluid oligoclonal bands in multiple sclerosis and clinically isolated syndromes: a meta-analysis of prevalence, prognosis and effect of latitude.
J Neurol Neurosurg Psychiatry, 84 (2013), pp. 909-914
[33]
M. Tintoré, A. Rovira, J. Río, C. Tur, R. Pelayo, C. Nos, et al.
Do oligoclonal bands add information to MRI in first attacks of multiple sclerosis?.
Neurology, 70 (2008), pp. 1079-1083
[34]
A. Awad, B. Hemmer, H.-P. Hartung, B. Kieseier, J.L. Bennett, O. Stuve.
Journal of Neuroimmunology. Analyses of cerebrospinal fluid in the diagnosis and monitoring of multiple sclerosis.
J Neuroimmunol, 219 (2010), pp. 1-7
[35]
G. Giovannoni, C.T. Bever Jr.
Patients with clinically isolated syndromes suggestive of MS: does MRI allow earlier diagnosis?.
Neurology, 60 (2003), pp. 6-7
[36]
M.K. Sharief, E.J. Thompson.
Intrathecal immunoglobulin M synthesis in multiple sclerosis. Relationship with clinical and cerebrospinal fluid parameters.
Brain, 114 (1991), pp. 181-195
[37]
C.J.M. Sindic, P. Monteyne, E.C. Laterre.
Occurrence of oligoclonal IgM bands in the cerebrospinal fluid of neurological patients: an immunoaffinity-mediated capillary blot study.
J Neurol Sci, 124 (1994), pp. 215-219
[38]
P. Menéndez-Valladares, M.I. García-Sánchez, P. Cuadri Benítez, M. Lucas, M. Adorna Martínez, V. Carranco Galán, et al.
Free kappa light chains in cerebrospinal fluid as a biomarker to assess risk conversion to multiple sclerosis.
Mult Scler J Exp Transl Clin, 1 (2015), pp. 19
[39]
D. Ferraro, A. Trovatia, R. Bedinb, P. Natalic, D. Franciottad, M. Santangeloe, et al.
Cerebrospinal fluid kappa and lambda free light chains in oligoclonal band-negative patients with suspected multiple sclerosis.
Eur J Neurol, 27 (2020), pp. 461-467
[40]
S. Goffette, M. Schluep, H. Henry, T. Duprez, C.J.M. Sindic.
Detection of oligoclonal free kappa chains in the absence of oligoclonal IgG in the CSF of patients with suspected multiple sclerosis.
J Neurol Neurosurg Psychiatry, 75 (2004), pp. 308-310
[41]
H. Zetterberg, M.A. Hietala, M. Jonsson, N. Andreasen, E. Styrud, I. Karlsson, et al.
Neurochemical aftermath of amateur boxing.
Arch Neurol, 63 (2006), pp. 1277-1280
[42]
J.N. Lycke, J.E. Karlsson, O. Andersen, L.E. Rosengren.
Neurofilament protein in cerebrospinal fluid: a potential marker of activity in multiple sclerosis.
J Neurol Neurosurg Psychiatry, 64 (1998), pp. 402-404
[43]
E.R. Zanier, D. Refai, G.J. Zipfel, T. Zoerle, L. Longhi, T.J. Esparza, et al.
Neurofilament light chain levels in ventricular cerebrospinal fluid after acute aneurysmal subarachnoid haemorrhage.
J Neurol Neurosurg Psychiatry, 82 (2011), pp. 157-159
[44]
M. Sjogren, M. Blomberg, M. Jonsson, L.O. Wahlund, A. Edman, K. Lind, et al.
Neurofilament protein in cerebrospinal fluid: a marker of white matter changes.
J Neurosci Res, 66 (2001), pp. 510-516
[45]
M. Jonsson, H. Zetterberg, E. van Straaten, K. Lind, S. Syversen, A. Edman, et al.
Cerebrospinal fluid biomarkers of white matter lesions: cross-sectional results from the LADIS Study.
Eur J Neurol, 17 (2010), pp. 377-382
[46]
M. Landqvist Waldo, A. Frizell Santillo, U. Passant, H. Henrik Zetterberg, L. Rosengren, C. Nilsson, et al.
Cerebrospinal fluid neurofilament light chain protein levels in subtypes of frontotemporal dementia.
BMC Neurol, 13 (2013), pp. 54
[47]
R. Madeddu, C. Farace, P. Tolu, G. Solinas, Y. Asara, M.A. Sotgiu, et al.
Cytoskeletal proteins in the cerebrospinal fluid as biomarker of multiple sclerosis.
Neurol Sci, 34 (2013), pp. 181-186
[48]
A. Jeppsson, H. Zetterberg, K. Blennow, C. Wikkelso.
Idiopathic normal-pressure hydrocephalus: pathophysiology and diagnosis by CSF biomarkers.
Neurology, 80 (2013), pp. 1385-1392
[49]
R. Tortelli, M. Ruggieri, R. Cortese, E. D’Errico, R. Capozzo, A. Leo, et al.
Elevated cerebrospinal fluid neurofilament light levels in patients with amyotrophic lateral sclerosis: a possible marker of disease severity and progression.
Eur J Neurol, 19 (2012), pp. 1561-1567
[50]
L. Hagberg, D. Fuchs, L. Rosengren, M. Gisslen.
Intrathecal immune activation is associated with cerebrospinal fluid markers of neuronal destruction in AIDS patients.
J Neuroimmunol, 102 (2000), pp. 51-55
[51]
N. Mattsson, D. Bremell, R. Anckarsater, K. Blennow, H. Anckarsäter, H. Zetterberg, et al.
Neuroinflammation in Lyme neuroborreliosis affects amyloid metabolism.
BMC Neurol, 10 (2010), pp. 51
[52]
H. Zetterberg, A. Svenningsson.
Serum Neurofilament light and prediction of multiple sclerosis in clinically isolated syndrome.
Neurology, 92 (2019), pp. 313-314
[53]
C.G. Lee, C.A. Da Silva, C.S. Dela Cruz, F. Ahangari, B. Ma, M.-J. Kang, et al.
Role of chitin and chitinase/chitinase-like proteins in inflammation, tissue remodeling, and injury.
Annu Rev Physiol, 73 (2011), pp. 479-501
[54]
M. Comabella, M. Fernández, R. Martin, S. Rivera-Vallvé, E. Borrás, C. Chiva, et al.
Cerebrospinal fluid chitinase 3-like 1 levels are associated with conversion to multiple sclerosis.
Brain, 133 (2010), pp. 1082-1093
[55]
J. Correale, M. Fiol.
Chitinase effects on immune cell response in neuromyelitis optica and multiple sclerosis.
Mult Scler, 17 (2011), pp. 521-531
[56]
D. Bonneh-Barkay, S.J. Bissel, J. Kofler, A. Starkey, G. Wang, C.A. Wiley.
Astrocyte and macrophage regulation of YKL-40 expression and cellular response in neuroinflammation.
Brain Pathol, 22 (2012), pp. 530-546
[57]
V.M. Tintore, A. Rovira, G. Arrambide, R. Mitjana, J. Río, C. Auger, et al.
Brainstem lesions in clinically isolated syndromes.
Neurology, 75 (2010), pp. 1933-1938
[58]
E. Paolino, E. Fainardi, P. Ruppi, M.R. Tola, V. Govoni, I. Casetta, et al.
A prospective study on the predictive value of CSF oligoclonal bands and MRI in acute isolated neurological syndromes for subsequent progression to multiple sclerosis.
J Neurol Neurosurg Psychiatry, 60 (1996), pp. 572-575
[59]
M.P. Sormani, M. Tintorè, M. Rovaris, A. Rovira, X. Vidal, P. Bruzzi, et al.
Will Rogers phenomenon in multiple sclerosis.
Ann Neurol, 64 (2008), pp. 428-433
[60]
J.I. Rojas, L. Patrucco, E. Cristiano.
Oligoclonal bands and MRI in Clinically Isolated Syndromes: predicting conversion time to multiple sclerosis.
J Neurol, 257 (2010), pp. 1188-1191
[61]
D.T. Chard, C.M. Dalton, J. Swanton, L.K. Fisniku, K.A. Miszkiel, A.J. Thompson, et al.
MRI only conversion to multiple sclerosis following a clinically isolated syndrome.
J Neurol Neurosurg Psychiatry, 82 (2011), pp. 176-179
[62]
J. Masjuan, J.C. Alvarez-Cermeño, N. Garcia-Barragan, M. Diaz-Sanchez, M. Espino, M.C. Sadaba, et al.
Clinically isolated syndromes: a new oligoclonal band test accurately predicts conversion to MS.
[63]
M. Soderstrom, J. Ya-Ping, J. Hillert, H. Link.
Optic neuritis: prognosis for multiple sclerosis from MRI, CSF, and HLA findings.
Neurology, 50 (1998), pp. 708-714
[64]
J. Kuhle, G. Disanto, R. Dobson, R. Adiutori, L. Bianchi, J. Topping, et al.
Conversion from clinically isolated síndrome to m ultiple sclerosis: A large multicentre study.
Mult Scler J, 21 (2015), pp. 967-968
[65]
C.H. Polman, S.C. Reingold, B. Banwell, M. Clanet, J.A. Cohen, M. Massimo Filippi, et al.
Diagnostic Criteria for Multiple Sclerosis: 2010 Revisions to the McDonald Criteria.
Ann Neurol, 69 (2011), pp. 292-302
[66]
I. Boscá, M.J. Magraner, F. Coret, J. Alvarez-Cermeño, M. Simó-Castelló, L.M. Villar, B. Casanova.
The risk of relapse after a clinically isolated syndrome is related to the pattern of oligoclonal bands.
J Neuroimmunol, 226 (2010), pp. 143-146
[67]
D.H. Miller, D.T. Chard, O. Ciccarelli.
Clinically isolated syndromes.
Lancet Neurol, 11 (2012), pp. 157-169
[68]
L.M. Villar, N. Garcia-Barragan, M.C. Sadaba, E. Espiño, J. Gómez-Rial, J. Martínez-San Millán, et al.
Accuracy of CSF and MRI criteria for dissemination in space in the diagnosis of multiple sclerosis.
J Neurol Sci, 15 (2007), pp. 1079-1083
[69]
L.M. Villar, J. Masjuan, P. González-Porqué, J. Plaza, M.C. Sádaba, E. Roldán, et al.
Intrathecal IgM synthesis predicts the onset of new relapses and a worse disease course in MS.
Neurology, 59 (2002), pp. 555-559
[70]
L.M. Villar, J. Masjuan, P. González-Porqué, J. Plaza, M.C. Sádaba, E. Roldán, et al.
Intrathecal IgM synthesis in neurologic diseases: relationship with disability in MS.
Neurology, 58 (2002), pp. 824-826
[71]
J. Mandrioli, P. Sola, R. Bedin, M. Gambini, E. Merelli.
A multifactorial prognostic index in multiple sclerosis. Cerebrospinal fluid IgM oligoclonal bands and clinical features to predict the evolution of the disease.
J Neurol, 255 (2008), pp. 1023-1031
[72]
M. Thangarajh, J. Gomez-Rial, K. Hedström, J. Hillert, J.C. Alvarez-Cermeño, T. Masterman, et al.
Lipid-specific immunoglobulin M in CSF predicts adverse long-term outcome in multiple sclerosis.
Mult Scler, 14 (2008), pp. 1208-1213
[73]
P. Sola, J. Mandrioli, A.M. Simone, D. Ferraro, R. Bedin, R. Annecca, et al.
Primary progressive versus relapsing-onset multiple sclerosis: presence and prognostic value of cerebrospinal fluid oligoclonal IgM.
Mult Scler, 17 (2011), pp. 303-311
[74]
L. Villar, N. García-Barragán, M. Espiño, E. Roldán, M. Sádaba, J. Gómez-Rial, et al.
Influence of oligoclonal IgM specificity in multiple sclerosis disease course.
Mult Scler, 14 (2008), pp. 183-187
[75]
P.J.H. Jongen, G. Lycklama a Nijeholt, K.J.B. Lamers, W.H. Doesburg, F. Barkhof, W.A.J.G. Lemmens, et al.
Cerebrospinal fluid IgM index correlates with cranial MRI lesion load in patients with multiple sclerosis.
Eur Neurol, 58 (2007), pp. 90-95
[76]
M.J. Magraner, I. Bosca, M. Simó-Castelló, G. García-Martí, A. Alberich-Bayarri, F. Coret, et al.
Brain atrophy and lesion load are related to CSF lipid-specific IgM oligoclonal bands in clinically isolated syndromes.
Neuroradiology, 54 (2012), pp. 5-12
[77]
L.M. Villar, M.C. Sádaba, E. Roldán, J. Masjuan, P. González-Porqué, N. Villarrubia, et al.
Intrathecal synthesis of oligoclonal IgM against myelin lipids predicts an aggressive disease course in MS.
J Clin Invest, 115 (2005), pp. 187-194
[78]
G. Hassan-Smith, L. Durant, A. Tsentemeidou, L.K. Assic, J.M. Faint, S. Kalra, et al.
High sensitivity and specificity of elevated cerebrospinal fluid kappa free light chains in suspected multiple sclerosis.
J Neuroimmunol, 276 (2014), pp. 175-179
[79]
L.M. Villar, M. Espiño, L. Costa-Frossard, A. Muriel, J. Jiménez, J.C. Álvarez-Cermeño.
High levels of cerebrospinal fluid free kappa chains predict conversion to multiple sclerosis.
Clin Chim Acta, 413 (2012), pp. 1813-1816
[80]
E. Rathbone, L. Durant, J. Kinsella, A.R. Parker, G. Hassan-Smith, M.R. Douglas, et al.
Cerebrospinal fluid immunoglobulin light chain ratios predict disease progression in multiple sclerosis.
J Neurol Neurosurg Psychiatry, 89 (2018), pp. 1044-1049
[81]
R.A. Rudick, L. Jacobs, P.R. Kinkel, W.R. Kinkel.
Isolated idiopathic optic neuritis. Analysis of free κ-light chains in cerebrospinal fluid and correlation with nuclear magnetic resonance findings.
[82]
I. Håkansson, A. Tisellb, P. Casseld, K. Blennow, H. Zetterberg, P. Lundberg, et al.
Neurofilament light chain in cerebrospinal fluid and predictionn ofdisease activity in clinically isolated syndrome and relapsing–remitting multiple sclerosis.
Eur J Neurol, 24 (2017), pp. 703-712
[83]
G. Disanto, R. Adiutori, R. Dobson, V. Martinelli, G. Dalla Costa, T. Runia, et al.
Serum neurofilament light chain levels are increased in patients with a clinically isolated syndrome.
J Neurol Neurosurg Psychiatry, 87 (2016), pp. 126-129
[84]
G. Arrambide, C. Espejo, H. Eixarch, L.M. Villar, J.C. Alvarez-Cermeño, C. Carmen Picón, et al.
Neurofilament light chain level is a weak risk factor for the development of MS.
Neurology, 87 (2016), pp. 1076-1084
[85]
E.T. Lim, F. Sellebjerg, C.V. Jensen, D.R. Altmann, D. Grant, G. Keir, et al.
Acute axonal damage predicts clinical outcome in patients with multiple sclerosis.
Mult Scler, 11 (2005), pp. 532-536
[86]
C.E. Teunissen, E. Iacobaeus, M. Khademi, L. Brundin, N. Norgren, M.J.A. Koel-Simmelink, et al.
Combination of CSF N-acetylaspartate and neurofilaments in multiple sclerosis.
Neurology, 72 (2009), pp. 1322-1329
[87]
J. Kuhle, D. Leppert, A. Petzold, A. Regeniter, C. Schindler, M. Mehling, et al.
Neurofilament heavy chain in CSF correlates with relapses and disability in multiple sclerosis.
Neurology, 76 (2011), pp. 1206-1213
[88]
N. Norgren, P. Sundstrom, A. Svenningsson, L. Rosengren, T. Stigbrand, M. Gunnarsson.
Neurofilament and glial fibrillary acidic protein in multiple sclerosis.
[89]
M. Tintore, A. Rovira, J. Rio, S. Otero-Romero, G. Arrambide, C. Carmen Tur, et al.
Defining high, medium and low impact prognostic factors for developing multiple sclerosis.
Brain, 138 (2015), pp. 1863-1874
[90]
S. Modvig, M. Degn, H. Roed, T.L. Sørensen, H.B.W. Larsson, A.R. Langkilde, et al.
Cerebrospinal fluid levels of Chitinase 3-Like 1 and neurofilament light chain predict multiple sclerosis development and disability after optic neuritis.
Mult Scler, 21 (2015), pp. 1761-1770
[91]
M.A. Mañé Martínez, B. Olsson, L. Bau, E. Matas, A. Cobo Calvo, U. Andreasson, et al.
Glial and neuronal markers in cerebrospinal fluid predict progression in multiple sclerosis.
Mult Scler J, 21 (2015), pp. 550-561
[92]
G. DallaCosta, V. Martinelli, F. Sangalli, L. Moiola, B. Colombo, M. Radaelli, et al.
Prognostic value of serum neurofilaments in patients with clinically isolated síndromes.
Neurology, 92 (2019), pp. 733-741
[93]
E. Cantó, M. Tintoré, L.M. Villar, C. Costa, R. Nurtdinov, J.C. Álvarez-Cermeño, et al.
Chitinase 3-like 1: prognostic biomarker in clinically isolated syndromes.
Brain, 138 (2015), pp. 918-931
[94]
G. Hinsinger, N. Galéotti, N. Nabholz, S. Urbach, V. Rigau, C. Demattei, et al.
Chitinase 3-like proteins as diagnostic and prognostic biomarkers of multiple sclerosis.
Mult Scler J, 21 (2015), pp. 1251-1261
[95]
K.H. Lee, S.A. Hashimoto, J.P. Hooge, L.F. Kastrukoff, J.J. Oger, D.K. Li, D.W. Paty.
Magnetic resonance imaging of the head in the diagnosis of multiple sclerosis: a prospective 2-year follow-up with comparision of clinical evaluation, evoked potentials, oligoclonal banding, and CT.
Neurology, 41 (1991), pp. 657-660
[96]
A. Compston, A. Coles.
Multiple sclerosis.
Lancet, 359 (2002), pp. 1221-1231
[97]
D.H. Miller, D.T. Chard, O. Ciccarelli.
Clinically isolated syndromes.
Lancet Neurol, 11 (2012), pp. 157-169
Copyright © 2021. Sociedad Española de Neurología
Article options
Tools
es en pt

¿Es usted profesional sanitario apto para prescribir o dispensar medicamentos?

Are you a health professional able to prescribe or dispense drugs?

Você é um profissional de saúde habilitado a prescrever ou dispensar medicamentos