


In a recent study, Matías-Guiu et al.1 analysed the psychometric properties of Addenbrooke's Cognitive Examination III (ACE-III) for the diagnosis of dementia. These authors reported high reliability and inter-rater agreement (>0.90), good sensitivity and specificity, and a strong correlation with the Mini–Mental State Examination (MMSE). However, they focus on total ACE-III scores, disregarding subtest scores for attention, memory, fluency, language, and visuospatial abilities. These subtests provide valuable information on the patient's cognitive profile, which is essential for preparing a personalised treatment plan.
In clinical practice, ACE-III subscores vary from patient to patient; the reliability of such differences should therefore be assessed. Matías-Guiu et al. do not evaluate this factor; as a result, the extent to which an ACE-III profile is influenced by measurement error cannot be determined. A mathematical formula has been proposed to address this issue, and can be used to analyse the difference between 2 scores2:
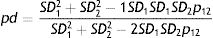
In this expression, SD1, SD2, ρ1, and ρ2 are the standard deviations (SD) and reliability coefficients (normally the α coefficient3) of subtests 1 and 2, respectively, and ρ12 is the correlation between the 2 subtests. The result (0≤ρd≤1) indicates the percentage of variability corresponding to true variance; when the latter is high, it can be concluded that the error of measurement has had no decisive impact on differences.
Matías-Guiu et al. only report SDs for each subtest in one of the tables of the study, and provide no data on their α coefficients or the correlation between subtests. Using fictitious data, below is an example of how complementary analyses may fill this gap. Firstly, to estimate the α coefficient of each subtest, the mean inter-item correlation for the total scale (rij) was calculated using the following formula α (k is the number of items)4:
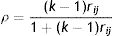
The α coefficient of each subtest was subsequently calculated, with the assumption that the value of rij is similar for all subscales. The result shows a low inter-item correlation (mean of 0.128).5 Based on these data, the α coefficients for attention, memory, fluency, language, and visuospatial abilities were 0.685, 0.762, 0.625, 0.762, and 0.658, respectively. If the data used for calculating the reliability of scores were real, subtest scores could not be used in clinical decision-making due to the magnitude of the reliability coefficients (α<0.90).6 A correlation of ρxy=0.50 was assumed, given that correlation coefficients were not reported. Finally, this example used the SDs of the control group of patients aged 65 or older. The potential differences between subtest scores were then calculated using all the data available.
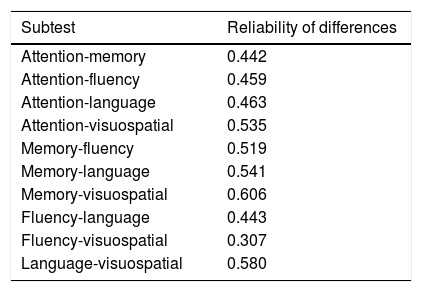
The results shown in Table 1 demonstrate a low reliability in the differences between subscales, discouraging clinical diagnosis based on the analysis of ACE-III profiles. As most of the data used were fictitious, this example only illustrates the method to be followed. Nonetheless, if Matías-Guiu et al. were to perform this analysis using their own data, it would undoubtedly be enlightening with regards to the use of the ACE-III for clinical assessment.
Reliability of the differences between ACE-III subtests.
| Subtest | Reliability of differences |
|---|---|
| Attention-memory | 0.442 |
| Attention-fluency | 0.459 |
| Attention-language | 0.463 |
| Attention-visuospatial | 0.535 |
| Memory-fluency | 0.519 |
| Memory-language | 0.541 |
| Memory-visuospatial | 0.606 |
| Fluency-language | 0.443 |
| Fluency-visuospatial | 0.307 |
| Language-visuospatial | 0.580 |
The author has received no funding of any kind.
Conflicts of interestThe author has no conflicts of interest to declare.
Please cite this article as: Dominguez-Lara S. Reporte de las diferencias confiables en el perfil del ACE-III. Neurología. 2018;33:138–139.
☆☆ This article has not been presented at any meeting or congress.

Neurología (English Edition) follows the Recommendations for the Conduct, Reporting, Editing and Publication of Scholarly Work in Medical Journals