


Progressive neuronal and axonal loss are considered the main causes of disability in patients with multiple sclerosis (MS). The disease frequently involves the visual system; the accessibility of the system for several functional and structural tests has made it a model for the in vivo study of MS pathogenesis. Orbital ultrasound is a non-invasive technique that enables various structures of the orbit, including the optic nerve, to be evaluated in real time.
MethodsWe conducted an observational, ambispective study of MS patients. Disease progression data were collected. Orbital ultrasound was performed on all patients, with power set according to the ALARA (“as low as reasonably achievable”) principle. Optical coherence tomography (OCT) data were also collected for those patients who underwent the procedure. Statistical analysis was conducted using SPSS version 22.0.
ResultsDisease progression was significantly correlated with ultrasound findings (P = .041 for the right eye and P = .037 for the left eye) and with Expanded Disability Status Scale (EDSS) score at the end of the follow-up period (P = .07 for the right eye and P = .043 for the left eye). No statistically significant differences were found with relation to relapses or other clinical variables.
DiscussionUltrasound measurement of optic nerve diameter constitutes a useful, predictive factor for the evaluation of patients with MS. Smaller diameters are associated with poor clinical progression and greater disability (measured by EDSS).
La pérdida neuronal/axonal progresiva se considera la causa más importante de discapacidad neurológica en la esclerosis múltiple (EM).
El sistema visual está frecuentemente afectado en esta enfermedad y su accesibilidad a test funcionales y estructurales ha permitido que se convierta en un modelo para estudiar in vivo la patogenia. La ecografía orbitaria permite evaluar, de forma no invasiva y en tiempo real, las diversas estructuras de la órbita, incluido el nervio óptico (NO).
Material y métodosSe ha realizado un estudio observacional ambispectivo en pacientes con EM recogiéndose datos evolutivos de la enfermedad. La ecografía orbitaria se realizó en todos los pacientes según el principio de mínima potencia necesaria. También se recogieron los datos de tomografía de coherencia óptica (OCT) en aquellos que tenían realiza ambas pruebas. El estudio estadístico se realizó con el programa SPSS 22.0.
ResultadosSe encontraron correlaciones estadísticamente significativas entre las medidas ecográficas y la progresión de la enfermedad (p 0.041 para ojo derecho (OD) y p 0.037 para ojo izquierdo (OI), y la EDSS final en el seguimiento (p 0,07 para OD y p 0,043 para OI). No fue así para los datos referentes a brotes y a otras variables clínicas..
DiscusiónLa medición del diámetro del NO por ecografía podría utilizarse como medida predictiva en la evolución de la enfermedad, ya que la disminución del mismo se asocia con progresión clínica y mayor discapacidad, medidas por EDSS.
Multiple sclerosis (MS) is the most common autoimmune, inflammatory, demyelinating disease of the central nervous system. It is characterised by inflammation, demyelination, axonal degeneration, and neuronal loss.1–3 Recent research has shown that neuronal and axonal damage are largely responsible for disability associated with MS.
The optic nerve is one of the structures most frequently affected in MS4; optic nerve involvement results in a high degree of disability due to its negative impact on quality of life.5 The development of non-invasive techniques such as optical coherence tomography (OCT) has enabled the detection of axonal loss in the anterior visual pathway; the optic nerve has emerged as an accessible model for studying the pathogenesis of MS and monitoring visual symptoms.6
The first study of OCT in patients with MS, published in 1999, showed reduced retinal nerve fibre layer (RNFL) thickness in patients with a history of optic neuritis compared to controls and to the unaffected, contralateral eye.7 Reduced RNFL thickness has also been associated with greater disability as measured with the Expanded Disability Status Scale (EDSS).8,9
Recent studies report that RNFL thickness is correlated with brain atrophy and visual dysfunction; this suggests that the eye may serve as a useful model to study the mechanisms of neurodegeneration in MS, and may even be helpful in studying neuroprotection.10–12 Clinical trials of MS have therefore included OCT to gather exploratory data about changes to the retinal structure and visual function alterations.13 RNFL thickness has been observed to progressively decrease over the course of the disease, even in eyes with no history of optic neuritis.14
Ultrasound is an increasingly widespread technique in neurological diseases; in the context of MS, ocular ultrasound is used to measure optic nerve thickness. Studies using ocular ultrasound report differences in optic nerve diameter between patients with MS and healthy controls, regardless of history of acute optic neuritis. This suggests that ultrasound may be useful in monitoring axonal loss associated with MS due to its ease of use, sensitivity, and reproducibility.15
Patients and methodsWe conducted an observational, analytical, ambispective study including a concurrent series of patients. We gathered data on patients attended at the multiple sclerosis unit at Hospital Universitario Virgen Macarena in Seville, Spain; in all cases, optic nerve thickness was determined using ocular ultrasound. The study was approved by our hospital’s ethics committee. All patients gave informed consent.
Inclusion criteria were as follows: age between 18 and 75 years, diagnosis of any form of MS (clinically isolated syndrome, relapsing-remitting, primary progressive, or secondary progressive), and giving informed consent to participate in the study. We excluded all patients younger than 18 or older than 75, those with severe ophthalmological diseases (glaucoma, maculopathy, etc), and those declining to sign the informed consent form.
We used an Esaote® ultrasound system with a 7.5 MHz linear transducer. Ultrasound power was adjusted according to the principle of ALARA (“as low as reasonably achievable”)16; optic nerve thickness was measured longitudinally at 3 mm from the optic disc,15 adjacent to the meningeal layers, due to the difficulty differentiating between axons and meningeal layers in most patients (Fig. 1).

We gathered demographic information and retrospective and prospective clinical data. For the prospective study, progression was defined as a sustained increase (> 3 months) of over 0.5 points on the EDSS. We also gathered OCT data from patients who underwent both ocular ultrasound and OCT.
Statistical analysis was conducted using SPSS version 22.0. P-values below .05 were considered statistically significant.
ResultsOur sample included 63 patients with MS; all patients underwent ocular ultrasound. Patients were followed up for a mean period of 9.16 months after the ultrasound (range, 3–18 months; SD: 4.37; 95% CI, 8.06–10.26). None of the patients were lost to follow-up.
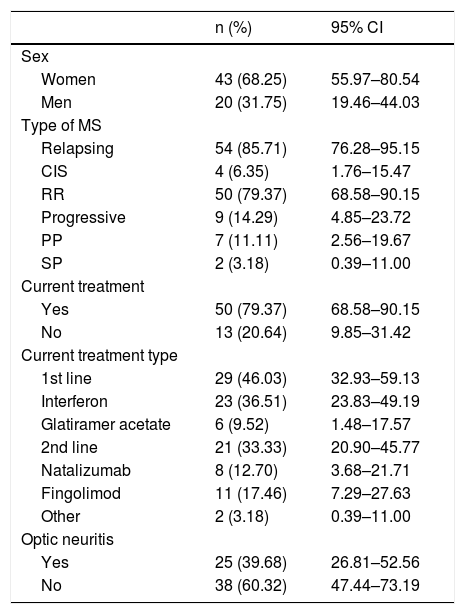
Table 1 summarises the baseline characteristics of our sample. Mean age at diagnosis was 35.5 years (range, 17–58; SD: 10.06; 95% CI, 32.83–37.90).
Baseline characteristics of our sample.
| n (%) | 95% CI | |
|---|---|---|
| Sex | ||
| Women | 43 (68.25) | 55.97–80.54 |
| Men | 20 (31.75) | 19.46–44.03 |
| Type of MS | ||
| Relapsing | 54 (85.71) | 76.28–95.15 |
| CIS | 4 (6.35) | 1.76–15.47 |
| RR | 50 (79.37) | 68.58–90.15 |
| Progressive | 9 (14.29) | 4.85–23.72 |
| PP | 7 (11.11) | 2.56–19.67 |
| SP | 2 (3.18) | 0.39–11.00 |
| Current treatment | ||
| Yes | 50 (79.37) | 68.58–90.15 |
| No | 13 (20.64) | 9.85–31.42 |
| Current treatment type | ||
| 1st line | 29 (46.03) | 32.93–59.13 |
| Interferon | 23 (36.51) | 23.83–49.19 |
| Glatiramer acetate | 6 (9.52) | 1.48–17.57 |
| 2nd line | 21 (33.33) | 20.90–45.77 |
| Natalizumab | 8 (12.70) | 3.68–21.71 |
| Fingolimod | 11 (17.46) | 7.29–27.63 |
| Other | 2 (3.18) | 0.39–11.00 |
| Optic neuritis | ||
| Yes | 25 (39.68) | 26.81–52.56 |
| No | 38 (60.32) | 47.44–73.19 |
95% CI: 95% confidence interval; CIS: clinically isolated syndrome; MS: multiple sclerosis; PP: primary progressive; RR: relapsing-remitting; SP: secondary progressive.
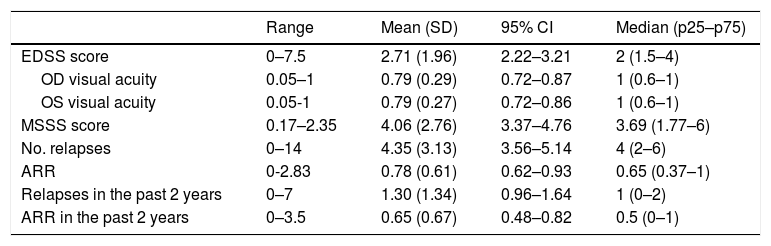
Table 2 presents retrospective clinical data.
Disease characteristics in our sample (n = 63).
| Range | Mean (SD) | 95% CI | Median (p25–p75) | |
|---|---|---|---|---|
| EDSS score | 0–7.5 | 2.71 (1.96) | 2.22–3.21 | 2 (1.5–4) |
| OD visual acuity | 0.05–1 | 0.79 (0.29) | 0.72–0.87 | 1 (0.6–1) |
| OS visual acuity | 0.05-1 | 0.79 (0.27) | 0.72–0.86 | 1 (0.6–1) |
| MSSS score | 0.17–2.35 | 4.06 (2.76) | 3.37–4.76 | 3.69 (1.77–6) |
| No. relapses | 0–14 | 4.35 (3.13) | 3.56–5.14 | 4 (2–6) |
| ARR | 0-2.83 | 0.78 (0.61) | 0.62–0.93 | 0.65 (0.37–1) |
| Relapses in the past 2 years | 0–7 | 1.30 (1.34) | 0.96–1.64 | 1 (0–2) |
| ARR in the past 2 years | 0–3.5 | 0.65 (0.67) | 0.48–0.82 | 0.5 (0–1) |
95% CI: confidence interval; ARR: annualised relapse rate; EDSS: Expanded Disability Status Scale; MSSS: Multiple Sclerosis Severity Scale; OD: right eye; OS: left eye; SD: standard deviation.
Mean optic nerve thickness was 4.54 mm in the right eye (range, 2.29–6.66; SD: 0.95; 95% CI, 4.30–4.78) and 4.63 mm in the left (range, 2.13–5.89; SD: 0.79; 95% CI, 4.43–4.83). The mean difference in optic nerve thickness between the right and the left eye (asymmetry) was 0.69 mm (range, 0–2.20; SD: 0.59; 95% CI, 0.54–0.84).
Ten patients (15.9%) presented relapses during follow-up. We recorded a mean of 0.24 relapses per patient during follow-up (range, 0–3; SD: 0.56; 95% CI, 0.10–0.38), with a mean annualised relapse rate of 0.26 (range, 0–2.40; SD: 0.61; 95% CI, 0.11–0.41). The first relapse appeared after a mean of 7.80 months of follow-up (range, 0.30–17.80; SD: 4.46; 95% CI, 6.68–8.92). Mean EDSS score at the end of the study period was 2.81 (range, 0–7.5; SD: 2.07; 95% CI, 2.29–3.33).
Seventeen patients (27%) showed a sustained increase of over 0.5 points in EDSS scores; disease progression was observed after a mean of 7.90 months (range, 1.87–17.84; SD: 4.17; 95% CI, 6.85–8.95).
The retrospective analysis revealed no significant differences between patients with and without history of optic neuritis in ultrasound results and clinical variables.
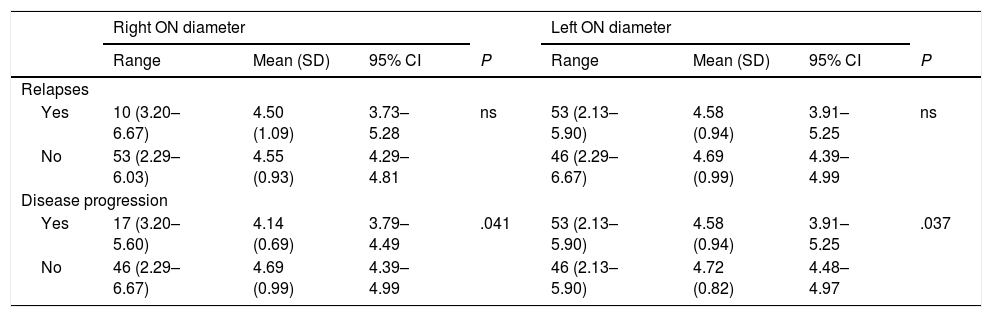
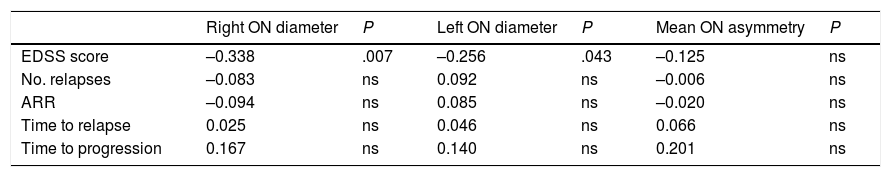
Table 3 shows the correlation between ultrasound results and occurrence of relapses and sustained disease progression. Table 4 analyses the correlation between ultrasound results and clinical progression during follow-up.
Correlation between ultrasound findings and presence of relapses and disease progression.
| Right ON diameter | Left ON diameter | |||||||
|---|---|---|---|---|---|---|---|---|
| Range | Mean (SD) | 95% CI | P | Range | Mean (SD) | 95% CI | P | |
| Relapses | ||||||||
| Yes | 10 (3.20–6.67) | 4.50 (1.09) | 3.73–5.28 | ns | 53 (2.13–5.90) | 4.58 (0.94) | 3.91–5.25 | ns |
| No | 53 (2.29–6.03) | 4.55 (0.93) | 4.29–4.81 | 46 (2.29–6.67) | 4.69 (0.99) | 4.39–4.99 | ||
| Disease progression | ||||||||
| Yes | 17 (3.20–5.60) | 4.14 (0.69) | 3.79–4.49 | .041 | 53 (2.13–5.90) | 4.58 (0.94) | 3.91–5.25 | .037 |
| No | 46 (2.29–6.67) | 4.69 (0.99) | 4.39–4.99 | 46 (2.13–5.90) | 4.72 (0.82) | 4.48–4.97 | ||
95% CI: 95% confidence interval; ns: not significant; ON: optic nerve; SD: standard deviation.
Statistically significant results are shown in bold (P < .05).
Correlation between ultrasound findings and clinical progression during follow-up (Pearson correlation coefficient).
| Right ON diameter | P | Left ON diameter | P | Mean ON asymmetry | P | |
|---|---|---|---|---|---|---|
| EDSS score | –0.338 | .007 | –0.256 | .043 | –0.125 | ns |
| No. relapses | –0.083 | ns | 0.092 | ns | –0.006 | ns |
| ARR | –0.094 | ns | 0.085 | ns | –0.020 | ns |
| Time to relapse | 0.025 | ns | 0.046 | ns | 0.066 | ns |
| Time to progression | 0.167 | ns | 0.140 | ns | 0.201 | ns |
ARR: annualised relapse rate; EDSS: Expanded Disability Status Scale; ns: not significant; ON: optic nerve.
Statistically significant results are shown in bold (P < .05).
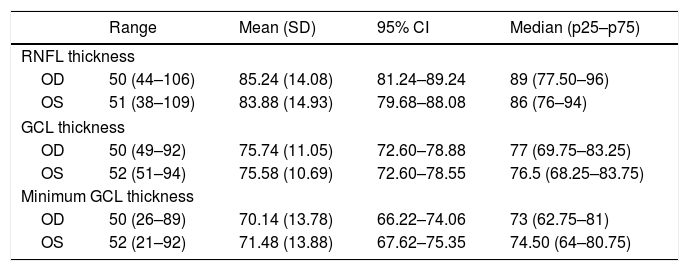
Fifty-two patients were assessed with OCT, although only 50 underwent OCT of both eyes. In the remaining 2 patients, OCT could not be performed bilaterally for technical reasons (severe nystagmus, which prevented eye fixation). OCT results are shown in Table 5. Table 6 shows data on the relationship between ultrasound findings and OCT results.
Optical coherence tomography results.
| Range | Mean (SD) | 95% CI | Median (p25–p75) | |
|---|---|---|---|---|
| RNFL thickness | ||||
| OD | 50 (44–106) | 85.24 (14.08) | 81.24–89.24 | 89 (77.50–96) |
| OS | 51 (38–109) | 83.88 (14.93) | 79.68–88.08 | 86 (76–94) |
| GCL thickness | ||||
| OD | 50 (49–92) | 75.74 (11.05) | 72.60–78.88 | 77 (69.75–83.25) |
| OS | 52 (51–94) | 75.58 (10.69) | 72.60–78.55 | 76.5 (68.25–83.75) |
| Minimum GCL thickness | ||||
| OD | 50 (26–89) | 70.14 (13.78) | 66.22–74.06 | 73 (62.75–81) |
| OS | 52 (21–92) | 71.48 (13.88) | 67.62–75.35 | 74.50 (64–80.75) |
95% CI: 95% confidence interval; GCL: ganglion cell layer; OD: right eye; OS: left eye; RNFL: retinal nerve fibre layer; SD: standard deviation.
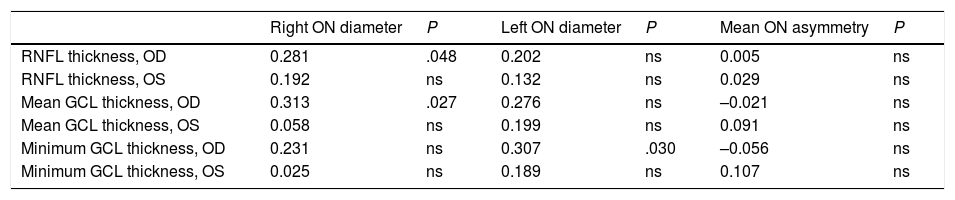
Correlation between ultrasound findings and optical coherence tomography data (Pearson correlation coefficient).
| Right ON diameter | P | Left ON diameter | P | Mean ON asymmetry | P | |
|---|---|---|---|---|---|---|
| RNFL thickness, OD | 0.281 | .048 | 0.202 | ns | 0.005 | ns |
| RNFL thickness, OS | 0.192 | ns | 0.132 | ns | 0.029 | ns |
| Mean GCL thickness, OD | 0.313 | .027 | 0.276 | ns | –0.021 | ns |
| Mean GCL thickness, OS | 0.058 | ns | 0.199 | ns | 0.091 | ns |
| Minimum GCL thickness, OD | 0.231 | ns | 0.307 | .030 | –0.056 | ns |
| Minimum GCL thickness, OS | 0.025 | ns | 0.189 | ns | 0.107 | ns |
GCL: ganglion cell layer; ns: not significant; OD: right eye; ON: optic nerve; OS: left eye; RNFL: retinal nerve fibre layer.
Statistically significant results are shown in bold (P < .05).
Central nervous system lesions associated with MS are characterised by disruption of the blood-brain barrier, inflammation, demyelination, oligodendrocyte loss, reactive gliosis, and neuronal/axonal degeneration.1,17,18 Progressive neuronal/axonal loss, the most important factor in the development of neurological disability associated with MS, is detectable at very early stages of the disease.19
Ocular ultrasound has previously been used to evaluate the optic nerve in patients with intracranial hypertension20 and acute optic neuritis.21 Compared to 3 T MRI, ocular ultrasound shows good measurement accuracy, reproducibility, and inter- and intra-observer agreement.22 Our patients’ ultrasound results are similar to those reported in other studies23; the same is true for clinical and disease progression data.
Our patients scored slightly higher on the EDSS at the end of the study period than at baseline; this is to be expected due to disease progression.24,25 We found a statistically significant negative correlation between optic nerve diameter and EDSS scores: smaller diameter was correlated with higher EDSS scores at the end of the study.
We also observed significant differences in optic nerve diameter between patients who showed disease progression and those who did not: diameter was smaller in both eyes in patients showing disease progression. However, no correlation was observed between optic nerve diameter and presence of relapses, number of relapses, annualised relapse rate, or time to first relapse. This is explained by the inflammatory component of relapses. Disease progression and disability (EDSS), in turn, are linked to neurodegeneration and axonal loss.26 These changes can be evaluated with ultrasound. Similarly, RNFL thickness and/or brain volume have been regarded as surrogate markers of axonal damage.27
No study has analysed the association between optic nerve thickness as measured with ultrasound and OCT findings in patients with MS, as ultrasound has only recently been introduced in this field and is still under study. However, the literature does include studies of ocular haemodynamic parameters, mainly in the context of optic neuritis.28–32 We found a significant positive correlation between optic nerve diameter as measured with ultrasound and OCT results for RNFL thickness and mean thickness of the ganglion cell layer in the right eye. This positive correlation suggests that ultrasound is a simple yet less precise technique, since it cannot differentiate between layers. Ultrasound results give an approximate idea of the integrity of the optic nerve in these patients. Differences between eyes in our sample may be due to the higher frequency of history of optic neuritis in the right eye (20.6%, vs 15.9% in the left eye). Further research is needed to confirm this hypothesis, however.
Ultrasound measurements of optic nerve diameter may help predict disease progression, since a decrease in optic nerve diameter is associated with clinical progression and greater disability during follow-up. In the absence of a gold standard for evaluating neurodegeneration and axonal damage, optic nerve ultrasound constitutes a useful tool for the assessment of patients with MS, although further research is necessary to confirm our results.
Conflicts of interestThe authors have no conflicts of interest to declare.
Please cite this article as: Pérez Sánchez S, et al. Utilidad de la ecografía de nervio óptico como predictor de progresión en esclerosis múltiple. Neurología. 2021;36:209–214.
This study was presented at the 68th Annual Meeting of the Spanish Society of Neurology (poster and oral communication), the 32nd Congress of the European Committee for Treatment and Research in Multiple Sclerosis (poster), and the 22nd Meeting of the European Society of Neurosonology and Cerebral Hemodynamics (poster).
articles

Neurología (English Edition) follows the Recommendations for the Conduct, Reporting, Editing and Publication of Scholarly Work in Medical Journals