


Understanding the operation of family businesses is important worldwide. It is worth examining and evaluating this kind of business in terms of the family, the business and the ownership dimensions. There are no research findings known to provide an international and aggregated cross-sector analysis of family businesses. The purpose of this theoretical approach is to present a new method. With this method it would be possible to carry out a cross-sector and international comparative statistical analysis of family enterprises. This is suitable for making an aggregated analysis of one or more companies. The simultaneous or separate examination of the development of dimensions can assist family businesses in measuring their own status. The TONA model is applicable to measuring the evolution of family businesses and can show the differences between sectors or countries in an illustrative way.
Fortune’s 2016 list of the world’s 50 largest corporations includes common household names such as Apple, HP, and Amazon. While practically every firm on the list is a household name, several of the firms included are majority controlled by the founder’s family including: Wal-Mart, Volkswagen, Berkshire Hathaway, Ford and Exor (Fortune 500, 2016; The 50 largest family businesses, 2016). One of the oldest American companies is prominently controlled by the Zildjian family, cymbal-makers originally from Turkey, which is already at the 16th generational transition. Approximately one third of the 500 companies on the American S&P stock market index are considered family businesses. The world’s oldest family business is the 1300-year-old Houshi hotel and spa in Japan, which has been in operation for 46 generations (VS.HU, 2015).
Fig. 1 reveals the distribution of the TOP 500 family-owned businesses by region.
.")
The regional distribution of the world’s TOP 500 family businesses.
Source: Authors’ own editing on the basis of the EY Family Business Yearbook (2017).
The registered headquarters of the world’s top family businesses are located in the G20 countries (with the exception of Switzerland). However, among the newly industrialized BRICS countries,1 there is hardly any information available on family businesses in Russia and the South African Republic. The PwC Network (PricewaterhouseCoopers) surveyed the situation of Russian private and family businesses in 2014–2015 (PwC, 2014). The annual turnover of more than half of the 57 businesses with a strong market position which were examined exceeded $101 billion USD. The survey typically included young companies with a history of only 20 years, with only a handful of them having business operations in excess of 50 years. It may also follow from the above that the first generation is still present in 95 percent of them, and there was no third or fourth generation company included in the sample. On the basis of their distribution among different industries, the majority of the surveyed businesses conduct business operations in manufacturing and commerce. However, the businesses surveyed also operate in diversified industrial products, agriculture, and the logistics sector. Interestingly, respondents in the survey indicated that only 26 percent of the companies have considered the option of transferring the business within the family (PwC, 2014). This lack of succession planning in family businesses is a worldwide problem (PwC, 2016). According to some research the reasons for the founder’s lack of having a succession plan are: 1) the founder being too busy with day to day operations to think about succession planning, or 2) the founder assuming there is plenty of time to develop a succession plan before their death.
According to the FABASA (The Family Business Association of South Africa) website, the list of Nsehe (2014) which includes the 10 leading companies in Africa, as well as the 2016–2017 survey conducted by PwC, it can be concluded that South African family businesses constitute the backbone of the African economy. The list of leading family businesses in Africa includes companies with annual revenues of at least $50 million USD, with the share capital controlled by family members in at least the second generation, and the family controlling at least 30 percent of the company’s voting rights (Nsehe, 2014). The businesses on the top 10 list are active in the luxury goods market, and in construction, agriculture and banking. From the research and the surveys, it clearly transpires that the prospects of African family enterprises for the future are positive.
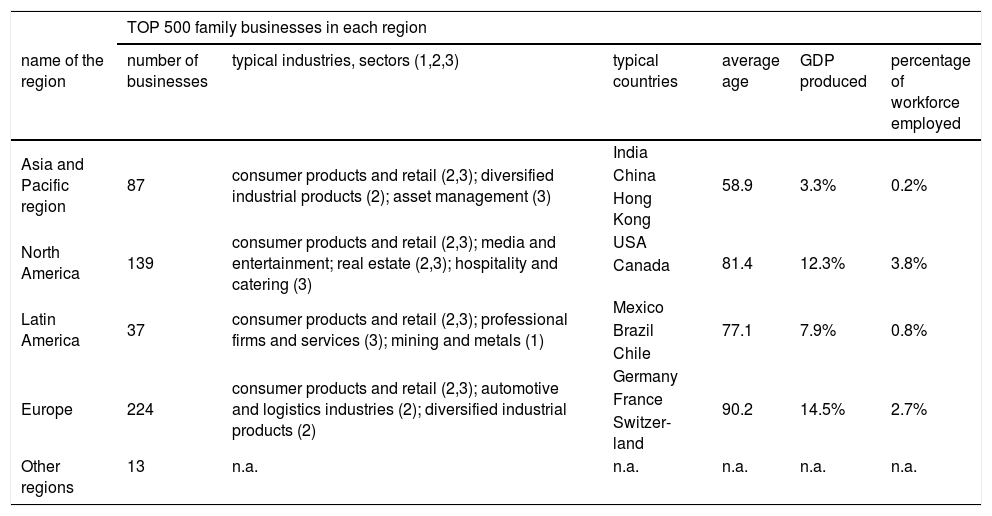
Family businesses operating in different regions of the world have to face a variety of economic, political, social and cultural challenges. The facts and figures regarding the characteristics of the Top 500 family businesses (average age, GDP produced2, employee percentage3) are summarised on the basis of the 2017 survey conducted by Ernst and Young (EY) for the individual regions in Table 1. It is interesting to note, based on a distribution according to sectors, 4 most of the world’s top 500 family businesses are active in the secondary sector, with the fewest in the primary sector.
Characteristics of the TOP 500 family businesses in each region.
| TOP 500 family businesses in each region | ||||||
|---|---|---|---|---|---|---|
| name of the region | number of businesses | typical industries, sectors (1,2,3) | typical countries | average age | GDP produced | percentage of workforce employed |
| Asia and Pacific region | 87 | consumer products and retail (2,3); diversified industrial products (2); asset management (3) | India | 58.9 | 3.3% | 0.2% |
| China | ||||||
| Hong Kong | ||||||
| North America | 139 | consumer products and retail (2,3); media and entertainment; real estate (2,3); hospitality and catering (3) | USA | 81.4 | 12.3% | 3.8% |
| Canada | ||||||
| Latin America | 37 | consumer products and retail (2,3); professional firms and services (3); mining and metals (1) | Mexico | 77.1 | 7.9% | 0.8% |
| Brazil | ||||||
| Chile | ||||||
| Europe | 224 | consumer products and retail (2,3); automotive and logistics industries (2); diversified industrial products (2) | Germany | 90.2 | 14.5% | 2.7% |
| France | ||||||
| Switzer-land | ||||||
| Other regions | 13 | n.a. | n.a. | n.a. | n.a. | n.a. |
Source: Authors’ own editing on the basis of the EY Family Business Yearbook (2017).
Fig. 2 reveals the distribution of the world’s top 50 family businesses according to their business activities. The basis of the ranking is the revenue information for 2015. Note that Consumer Products and Retail accounts for 38 percent or 19 of the world’s top 50 family businesses. Media and Technology accounts for only 4 percent each of the top 50 largest family controlled businesses in the world. The “Other” category includes insurance, life sciences, mining and metals, energy, public utilities and telecommunications.
 and the Family Business Index (2018).")
The distribution of the world’s top 50 family businesses based on activity.
Source: Authors’ own editing on the basis of the EY Family Business Yearbook (2017) and the Family Business Index (2018).
The top 25 family businesses in the global ranking generated an average of approximately $101 billion USD in 2015. According to the Motion for a resolution by the European Parliament (2015), family businesses contribute to economic stability; in some EU Member States they account for a large share of the total turnover of all businesses and thus make a significant contribution to job retention, creation and growth and to the economic success of the country concerned. They are engaged in transnational activities, “a significant share of family businesses in Europe have a transnational dimension and carry out their activities in different member states”. As a result, family businesses make a meaningful contribution to the competitiveness of Europe, and play a significant role in the private sector, as they account for the largest proportion of job opportunities. Family businesses tend to be flexible and able to adapt quickly to changes in the eco-social environment. Their equity ratio is significantly higher compared to non-family businesses. Approximately 87 percent of family businesses are convinced that maintaining control of the business is one of the key factors of success. The motion highlights its recommendations concerning the challenges faced by family businesses, such as the issues of education and taxation, which are important from the point of view of business continuity. It also includes a recommendation for inheritance law, which is an issue belonging to the competence of Member States, and emphasises the dangers inherent in excessive bureaucracy.
The presence of family owned enterprises has a significant impact on the operation of the economy as a whole. There is a growing body of research published in the international literature related to the operation of family businesses. However, no research findings to date have provided an international and aggregated cross-sector analysis of family owned enterprises. The aim of this paper is to present the TONA5 model which is suitable for analyzing such cross-sector and international comparative statistical analyses.
Literature reviewThe family, as an institutional system, has been the basic unit of society since prehistoric times.
Family businesses are a popular form of enterprise throughout the world. There are numerous definitions of family businesses, but there is no standardized, universally accepted definition. We can find, however, some common elements in all definitions that should be taken into consideration and examined in order to determine whether or not an organization should be considered a family business (Miller, Breton-Miller, Lester, & Canella, 2007; Cano-Rubio, Fuentes-Lombardo, & Vallejo-Martos, 2017; Csákné Filep, 2013; Tobak, Nagy, Pető, Fenyves, & Nábrádi, 2018). Generally accepted elements used in the definition of family businesses concern ownership, management, control, generations, and the intention to pass the business down as an inheritance within the family (Ramadani and Hoy, 2015; De Massis, Sharma, Chua, Chrisman, & Kotlar, 2012; Nagy, 2007). The family business is an organization in which the control and management tasks are generally provided by multiple members of the same family even across multiple generations (Miller et al., 2007).
A family business is an enterprise in which the majority ownership and/or majority control belongs to the same family, and at least one family member actively works in the business.
In the case of traditional businesses, we can only talk about the relationship of ownership and business, while in case of family enterprises, we can speak of the relationship/combination of family, business and ownership. These three concepts have a determining role in the definition of family businesses. The so-called “three-circle model” plays a key role in this research (Tagiuri and Davis, 1982; Matsuhashi, 2013).
Gersick, Davis, Hampton, and Lansberg (1997) (IN: Csákné Filep, 2013) designed their model based on an examination of the life cycles of businesses. Their model depicts family businesses in the three dimensions already discussed (family, business and ownership), and also makes it possible to conduct analyses according to the three dimensions (Fig. 3).
.")
The maturity/development life cycles of family businesses.
Source: Authors’ own editing based on Gersick et al. (1996).
On the basis of Gersick’s approach, family businesses can be of the following 4 types:
- •
first-generation businesses owned and managed by the founder;
- •
fast growing established businesses owned by siblings;
- •
complex enterprises owned by a consortia of mature cousins;
- •
businesses preparing for generational succession, controlled by a family preparing to hand the business over (Csákné Filep, 2013; Tobak et al., 2018; Nábrádi, Bárány, & Tobak, 2016).
The purpose of this paper is to present a theoretical model building on the work of Gersick, Hampton, Lansberg, and Davis (1996) as a basis. The depiction according to the three dimensions has been developed further in the interest of elaborating a newer method suitable for cross-sector and international comparative analyses. The TONA model makes it possible to analyse family-owned businesses along the family – business – ownership dimensions (Fig. 4).
.")
The TONA model allows attributes of family businesses to be measured, evaluated and analysed both independently and in combination. The model is suitable for making an aggregated analysis of one or more companies. The simultaneous or separate examination of the development of dimensions can assist family businesses in measuring their own status and helps to compile a nationally relevant and comparable database. With this method it would be possible to make a cross-sector and international comparative statistical analysis of family owned enterprises. The TONA model is applicable to measuring the evolution of family businesses and can reveal the differences between sectors or countries in an illustrative way.
In order to conduct comparative analyses, it is necessary to survey the members of the family business sector. For the analysis and joint depiction of all three dimensions, the life cycle of maturity/development the businesses is in must be determined first.
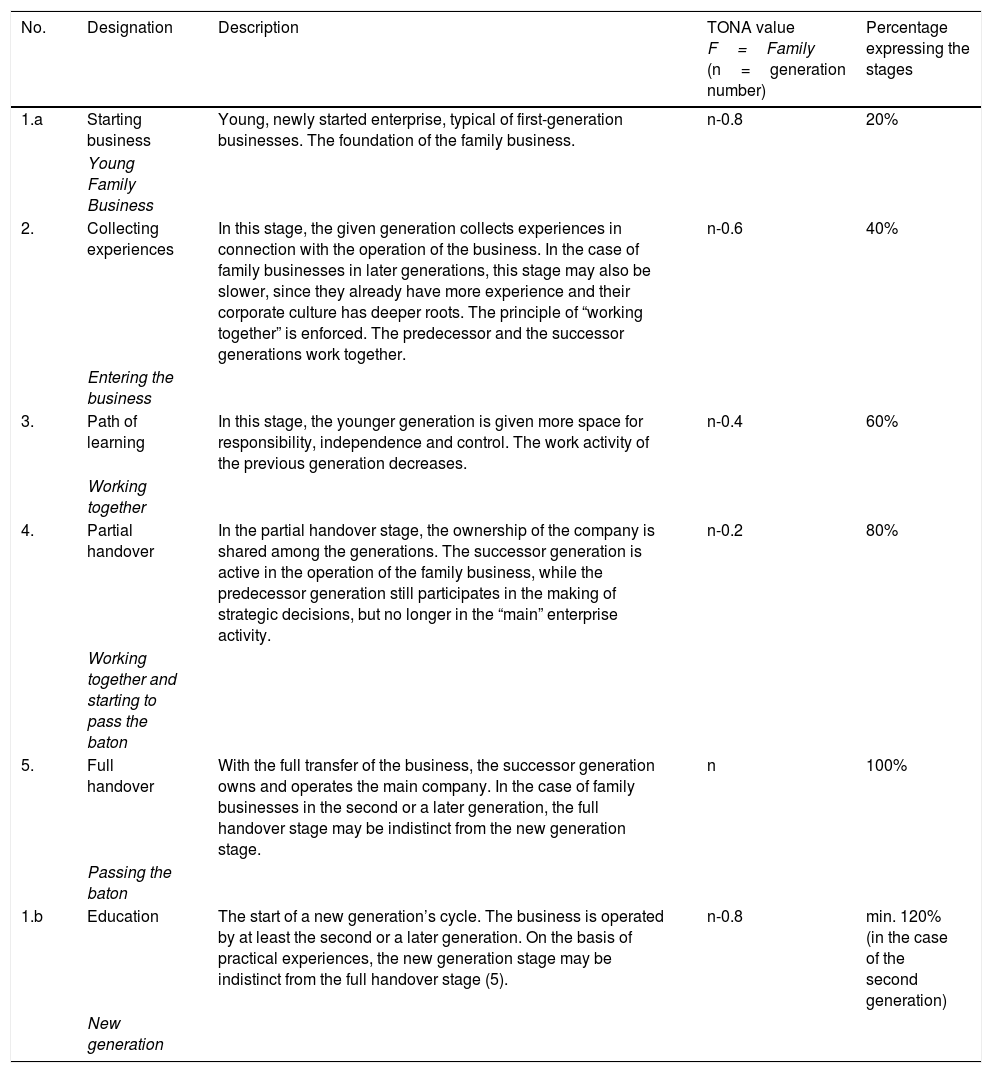
FamilyIn the model proposed by Gersick et al. (1996), the stages of family development can be described by four separate phases building upon each other. In the critical analysis of the model, in the interpretation of the generation shifting changes of Tobak et al. (2018) and Gersick et al. (1996), the phases were reconsidered and summarized (Table 2).
Summary of the individual stages of the family dimension and their related characteristics.
| No. | Designation | Description | TONA value F=Family (n=generation number) | Percentage expressing the stages |
|---|---|---|---|---|
| 1.a | Starting business | Young, newly started enterprise, typical of first-generation businesses. The foundation of the family business. | n-0.8 | 20% |
| Young Family Business | ||||
| 2. | Collecting experiences | In this stage, the given generation collects experiences in connection with the operation of the business. In the case of family businesses in later generations, this stage may also be slower, since they already have more experience and their corporate culture has deeper roots. The principle of “working together” is enforced. The predecessor and the successor generations work together. | n-0.6 | 40% |
| Entering the business | ||||
| 3. | Path of learning | In this stage, the younger generation is given more space for responsibility, independence and control. The work activity of the previous generation decreases. | n-0.4 | 60% |
| Working together | ||||
| 4. | Partial handover | In the partial handover stage, the ownership of the company is shared among the generations. The successor generation is active in the operation of the family business, while the predecessor generation still participates in the making of strategic decisions, but no longer in the “main” enterprise activity. | n-0.2 | 80% |
| Working together and starting to pass the baton | ||||
| 5. | Full handover | With the full transfer of the business, the successor generation owns and operates the main company. In the case of family businesses in the second or a later generation, the full handover stage may be indistinct from the new generation stage. | n | 100% |
| Passing the baton | ||||
| 1.b | Education | The start of a new generation’s cycle. The business is operated by at least the second or a later generation. On the basis of practical experiences, the new generation stage may be indistinct from the full handover stage (5). | n-0.8 | min. 120% (in the case of the second generation) |
| New generation |
Source: Authors’ own editing (2019).
The defined cycles repeat themselves in the case of each new generation. Starting from the second generation, the cycle consisting of 5 stages starts with the 1.b. “new generation” stage. The specified percentage values also change in accordance with this; for example, in the case of the second generation, this value is 120 percent (Table 2).
The family dimension is defined by the sequential number of the generation operating the business at that point. If the aim is to carry out cross-sector or international comparative analyses, it is sufficient to answer the question “Which generation is currently operating the family business?”
The TONA model is also suitable for determining and expressing in a quantitative way, as accurately as possible, where the family business currently stands in the process of generational succession.
However, it should be added as a general remark that the generational succession should only be expressed as a percentage when individual analyses are conducted. For the purposes of aggregated analyses, it is sufficient to establish which generation currently operates the family business.
BusinessAs proposed by Gersick et al. (1996), the business axis can be divided into 3 stages. The start-up, expansion/formalisation and maturity stages can be interpreted independently from the form of the business. When designing the development stages in the business dimension of the TONA model, the development lifestyle stages formulated by the FAMILY BUSINESS NETWORK were taken into consideration. In putting together the content of the dimension, an important aspect was to emphasize that the business operated on family foundations, and definitely complies with the definition describing family businesses.
The dimension of (2) business shows the level of separation of tasks between family and non-family members. That dimension gives an answer to the question of how the management and the ownership functions are separated.
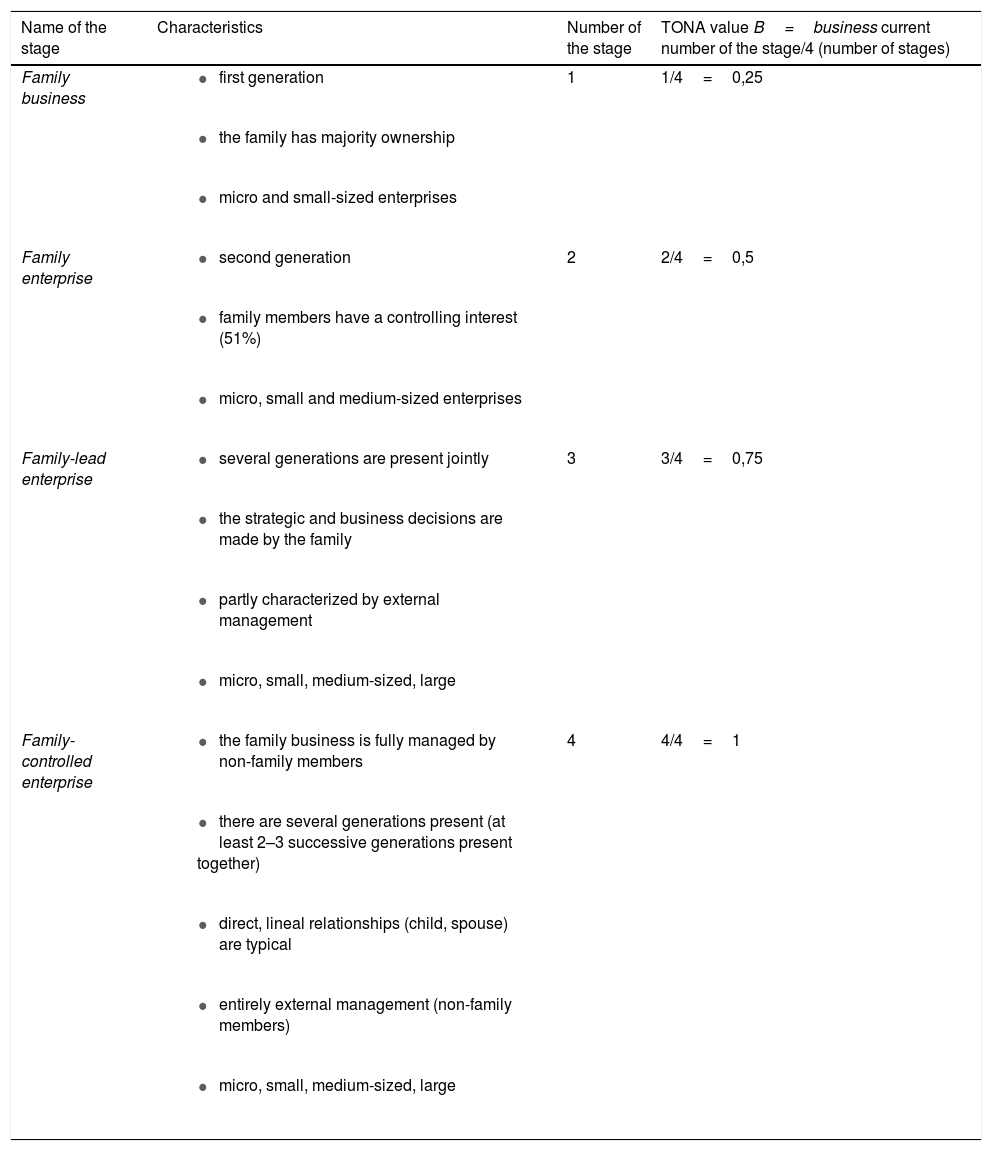
The development of today’s family businesses can be divided into four stages. A business may be placed in the various stages of development on the basis of the ownership shares of the family members, as well as what is known about their participation in the operative, tactical and strategic activities. The individual stages are separated on the basis of these characteristics (FBN-H, 2017). In the course of establishing the characteristics of the individual stages, properties referring to the size of the business are also included (European Commission, 2005) (Table 3).
The characteristics of the business dimension.
| Name of the stage | Characteristics | Number of the stage | TONA value B=business current number of the stage/4 (number of stages) |
|---|---|---|---|
| Family business |
| 1 | 1/4=0,25 |
| |||
| |||
| Family enterprise |
| 2 | 2/4=0,5 |
| |||
| |||
| Family-lead enterprise |
| 3 | 3/4=0,75 |
| |||
| |||
| |||
| Family-controlled enterprise |
| 4 | 4/4=1 |
| |||
| |||
| |||
|
Source: Authors’ own editing (2019).
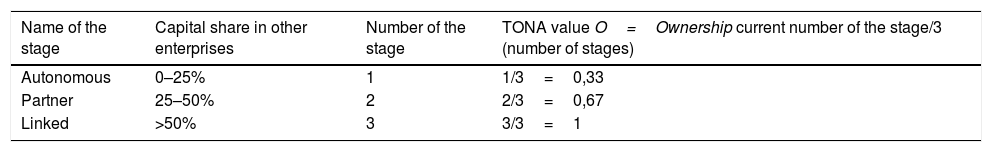
In the interpretation of the classic model, the ownership axis separates 3 categories. In defining the development statuses, Gersick et al. (1996) placed family and other relationships at the centre, and therefore the categories of controlling owner, sibling partnership and cousin consortium were formulated in their model.
The stages expressing the dimension were changed to align with the purpose of the paper. It was an important consideration on the part of the authors that it should be easy to measure and delimit the stages of ownership, and the pertinent information should be accessible potentially on the basis of other databases. In the SME Handbook, published as a European Commission Enterprise and Industry Publication (European Commission, 2005), the categories describing ownership shares were formulated.
The definition of SMEs distinguishes three categories of enterprises, each of which corresponds to a type of relationship that may connect one enterprise with another. The distinction is necessary to obtain a clear picture of the ownership status of the business. This dimension shows the ownership state of examined businesses and can clarify the stage of the ownership structure. It can show the type of the family enterprises. The three categories that can express the ownership characteristics are the autonomous, the partner and the linked types of companies.
In the case of this dimension, once again, objective measurability was an important consideration, and therefore an index number was assigned to more effectively describe each category. (Table 4).
For the assessment of these three ownership categories, it is necessary to determine if the family business controls part ownership of any other enterprise. If that other enterprise is also owned by another family member, both enterprises need to be examined in aggregate.
In case of questions of ownership, it is also important to consider control in the legal sense of the word. For example, if the basis of control is considered as a linked company, then it is not only the company’s capital or participation that needs to be examined, but also the control exercised over the other business.
Theoretical casesThe interpretation in the TONA model can be applied for the analysis of the dimensions separately and also in aggregate. However, there are some combinations of cases the interpretation of which is not possible. For example, on the basis of the definitions as described, a first generation family business cannot be considered a family led or family controlled enterprise, and in this case the principle of development life cycles will be applicable. Fig. 5 depicts several hypothetical cases. These hypothetical cases may describe an individual enterprise, but are also suitable for the comparison of the family businesses of the primary, secondary and tertiary sectors in such a way that the averages of the values of the businesses analyses are used.
.")
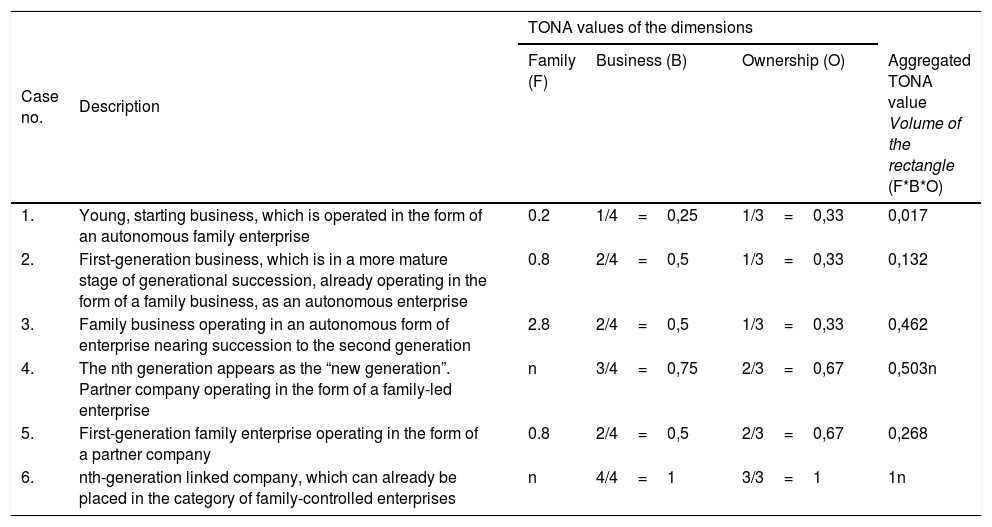
In Table 5, the hypothetical, theoretical cases6 presented in the interpretation of the TONA model are summarised and explained.
The explanation of a few fictitious examples of the models suitable for carrying out cross-sector and comparative analyses.
| Case no. | Description | TONA values of the dimensions | |||
|---|---|---|---|---|---|
| Family (F) | Business (B) | Ownership (O) | Aggregated TONA value Volume of the rectangle (F*B*O) | ||
| 1. | Young, starting business, which is operated in the form of an autonomous family enterprise | 0.2 | 1/4=0,25 | 1/3=0,33 | 0,017 |
| 2. | First-generation business, which is in a more mature stage of generational succession, already operating in the form of a family business, as an autonomous enterprise | 0.8 | 2/4=0,5 | 1/3=0,33 | 0,132 |
| 3. | Family business operating in an autonomous form of enterprise nearing succession to the second generation | 2.8 | 2/4=0,5 | 1/3=0,33 | 0,462 |
| 4. | The nth generation appears as the “new generation”. Partner company operating in the form of a family-led enterprise | n | 3/4=0,75 | 2/3=0,67 | 0,503n |
| 5. | First-generation family enterprise operating in the form of a partner company | 0.8 | 2/4=0,5 | 2/3=0,67 | 0,268 |
| 6. | nth-generation linked company, which can already be placed in the category of family-controlled enterprises | n | 4/4=1 | 3/3=1 | 1n |
Source: Authors’ own editing (2019).
The aggregated TONA value reveals the volume of the rectangular and expresses the state of the examined business or businesses (individual family businesses, company groups, sectors, industries or nations) in an illustrative and objective way.
ConclusionsThis paper proposes a methodology for the assessment of the development/maturity life cycles of family-owned enterprises. The method, which is suitable for conducting comparative statistical analyses, allows us to make an individual or aggregated interpretation of the three dimensions. The family-business-ownership dimensions express the current condition in an objective, quantitative way, which is applicable to individual family businesses, company groups, sectors, industries or entire nations. With the help of the model, cross-sector and international comparative statistical analyses may also be conducted.
The family dimension of the methodology, together with the fine-tuning, may help individual family enterprises more effectively determine their position in the process of generational succession. Knowing the current succession position, is likely beneficial for the effective formulation and implementing the strategy of generational succession.
When conducting international comparative analyses, it may be worthwhile and also enlightening to examine and/or ask the question whether the enterprise is to be considered as a conglomerate. Presumably, this may be typical in the case of family businesses launched several generations ago, which are characterised by familial relationships which are so extensive they make it possible for them to be active in several sectors.
Further research needs to be conducted to test the usability of the TONA model in practice. Before commencing the practical testing of the theoretical model, it is necessary to engage in primary and secondary research, to prepare smaller analyses and case studies, as well as to obtain feedback in connection with the model, which will allow the refining of the method, and a more accurate and more detailed definition of the factors determining the dimensions.
The authors express their gratitude to the Faculty of Economics and Business Administration of the University of Debrecen. This work was supported by EFOP3.6.3-VEKOP-16-2017-00007—“Young researchers for talent”—Supporting careers in research activities in higher education program.
BRICS countries: Brazil, Russia, India, China, South African Republic
As a percentage of the total GDP produced in the region.
As a percentage of all employees in the region.
1- Primary sector: extraction of raw materials, agriculture; 2 - Secondary sector: processing industry, construction; 3 - Tertiary sector: services, trade
articles