


Edited by: Abbas Mardari
Last update: July 2022
More infoThis study aims to determine whether big business or institutions comprise a more significant entrepreneurship determinant. In addition, we have three subobjectives: We examine (1) how the relationship between big businesses and entrepreneurship changes according to the economic development stage; (2) if big businesses affect the two different entrepreneurship types, namely, opportunity- and necessity-driven entrepreneurship, differently; and (3) which institutional factors are effective for these two different entrepreneurship types. To this end, we compare the effects of big businesses and institutions on entrepreneurship among 33 countries covering lower-middle-, upper-middle-, and high-income countries during the 2001–2015 period. Among the various determinants of entrepreneurship, we focus on two key factors that affect entrepreneurship, namely, big businesses and institutions while controlling for the demand- and supply-side factors that influence entrepreneurship. This study conducts fixed-effect estimations. We find that the relationship among entrepreneurship, big businesses, and economic development is “N-shaped.” In particular, there is a positive relationship between big businesses and opportunity-driven entrepreneurship in high-income countries. Moreover, among the various institutional factors, only supportive public policies toward new firms and positive social perceptions toward entrepreneurs are effective for opportunity-driven entrepreneurs, whereas none of the institutional factors are effective for necessity-driven entrepreneurs.
Because entrepreneurship has come to be regarded as a vital element of a nation's economic development (Huang et al., 2022; Méndez-Picazo et al., 2021; Urbano et al., 2019; Audretsch, 2018, 2007; Schumpeter, 1934), understanding the main factors driving entrepreneurship has become essential. Previous studies have uncovered various explanatory variables influencing entrepreneurship, including (1) economic factors (e.g., gross domestic product [GDP] and globalization), (2) institutions (e.g., tax policy and corruption), (3) culture (e.g., social and religious beliefs), (4) legal systems, and (5) geography (e.g., coastal and temperate zones). Currently, studies on the effects of digital technologies (Dana et al., 2022; Yang et al., 2021) and artificial intelligence (Obschonka & Audretsch, 2020) on entrepreneurship have been conducted. Among these determinants, in studying entrepreneurship within or across countries, the broad connection between entrepreneurship and various institutional factors constitutes a critical research area (Audretsch et al., 2021; Goduscheit et al., 2021; Carbonara et al., 2016; Lu & Tao, 2010; Acs et al., 2008). In particular, institutions influence the choice of opportunity- and necessity-driven entrepreneurship (Audretsch et al., 2021). Given this importance, this study regards institutions as an essential factor that influences entrepreneurship.
In contrast to the existing literature, this study's primary emphasis is on a new variable, that is, the role of big businesses. The role of big businesses has been importantly emphasized not only in the rise of current advanced economies in prominent studies such as Chandler (1990) but also in the context of newly emerging economies as a crucial vehicle for achieving rapid economic growth (Chandler & Hikino, 1997). In particular, Lee et al. (2013) pointed out a positive causal relationship between the number of big businesses and economic growth after controlling for the endogeneity that a larger economy is expected to generate more large firms than a small economy. Moreover, big businesses contain unique information that is commonly related to economic growth (Lee et al., 2013; Chandler & Hikino, 1997; Chandler, 1990, 1959; Schumpeter, 1934). Historically, large industrial firms have played a leading role in booming global economies and the upgrading of industrial structures (Chandler & Hikino, 1997). Because growth has a path-dependent tendency, it can be inferred that the leading players of the Fourth Industrial Revolution are big businesses. Despite the importance of big businesses in a country's economy, the role of big businesses in country-level entrepreneurial activity has remained unexplored. Although some studies have investigated the spillover effect of big businesses, they are limited to the study of corporate entrepreneurship1 (Urbano et al., 2022). Consequently, we consider the presence of big businesses as a predictive factor for entrepreneurship and compare this factor with the spillover effect of institutions.
However, there are concerns about the potential adverse effects of the concentration of economic power and resources by big businesses. The study by Lee et al. (2013) also identified a negative growth effect of economic concentration, although it also found that the net growth effect of having a larger number of world-class big businesses is positive, where the benefits outweigh the costs. Similar questions can be raised when examining the role of big businesses in entrepreneurship. Although negative effects such as entry barriers and the concentration of tangible and intangible resources can exist, there can also be positive effects, including the mobility and transfer of talents and technologies, the emergence of spinoff start-ups, and the support for small or new firms as suppliers. This study explores the pros and cons of the impact of big businesses on entrepreneurship.
In addition, the analysis distinguishes between entrepreneurship driven by necessity and that driven by opportunity, which is a significant consideration (Reynolds et al., 2005). An entrepreneur's motivation to initiate a business is a crucial indicator of the venture's quality. Moreover, understanding an entrepreneur's subjective reason for starting a business aids in the comprehension of certain business decisions, particularly those related to business growth. Consequently, this study classifies the determinants of necessity- and opportunity-driven entrepreneurship.
Furthermore, scholars generally agree that the level of entrepreneurial activity varies systemically across countries and evolves over time (Wennekers et al., 2005). In addition, several studies have proposed a causal “U-shaped” relationship between the level of self-employment and economic development (Wennekers et al., 2005; Carree et al., 2002; Acs et al., 1994; Blau, 1987). This study aimed to investigate the impact of big businesses on this relationship, specifically examining how the relationship between big businesses and entrepreneurship evolves along with the stage of economic development. We consider this to be a valuable perspective because there is often no one-size-fits-all development strategy, and thus, it is essential to categorize the economic development stage when assessing the interplay between big businesses and entrepreneurship. Furthermore, it is worth noting that numerous studies have primarily focused on developed economies, and there remains a substantial dearth of empirical evidence regarding developing countries. This research gap could hinder the effectiveness of the related policies.
In summary, this study compares the relative importance of traditional institutional variables with a less-explored new variable, namely, the role of big businesses in entrepreneurship. The entrepreneurship variable and the various dimensions of national institutions are constructed based on data taken from the global entrepreneurship monitor (GEM), which is widely used in entrepreneurship-related research (Autio, 2007). Additionally, we utilize the same dataset as Abbasi et al. (2021) and Hapsoro and Falih (2020), namely, the Osiris database, to create essential variables to represent the presence of big businesses. Consequently, this cross-country analysis investigates seven variables as determinants of entrepreneurship in a sample encompassing 33 countries that include lower-middle-, upper-middle-, and high-income economies during the period from 2001 to 2015.
The remainder of this study is organized as follows. Section 2 discusses the relevant literature and presents our hypotheses. Section 3 outlines the research methodology and the primary data used for testing our hypotheses. Section 4 presents tests of the hypotheses developed in Section 2. Specifically, we examine (1) how the relationship between big businesses and entrepreneurship evolves along with the stage of economic development; (2) whether big businesses affect two distinct types of entrepreneurship, namely, opportunity- and necessity-driven entrepreneurship, differently; and (3) which institutional factors are effective for these two entrepreneurship types. Finally, Section 5 summarizes the key findings and presents the contributions of this study.
Theoretical backgroundDefining entrepreneurshipA commonly recognized definition of entrepreneurship is lacking, and its conceptual boundaries are diverse. Nonetheless, multiple definitions commonly include elements such as recognizing opportunities, fostering innovation, and embracing risk. An essential facet of entrepreneurship is that individuals create new firms (Kusa et al., 2021; Metallo et al., 2021; Carter et al., 2003). This study defines entrepreneurship as new firm formation and explores the determinants of entrepreneurship in the corresponding country (Wong et al., 2005).
Types of entrepreneurshipWithin the realm of new business ventures, various types of entrepreneurs exist, including innovators, imitators (Santos-Vijande et al., 2022; Schumpeter, 1934), and entrepreneurs with or without growth aspirations (Autio & Acs, 2010). The most common method for categorizing the types of entrepreneurs is to distinguish between necessity- and opportunity-driven entrepreneurs (Reynolds et al., 2002; Krueger & Brazeal, 1994; Shane et al., 1991).
The motivation behind an entrepreneur's decision to launch a firm is a vital signal of the firm's quality. Opportunity-driven entrepreneurship tends to be more well organized and involves entrepreneurs with greater skills and better potential for higher earnings than necessity-driven entrepreneurship. Voluntary, opportunity-driven start-ups last longer; such firms are more likely to be innovative; and growth in these firms is faster than that of necessity-driven start-ups (Baumol & Strom, 2007). In addition, understanding the subjective motivations of entrepreneurs for launching a business assists in understanding certain business decisions, especially those related to business growth. Therefore, the classification of the determinants for opportunity- and necessity-driven entrepreneurship is necessary (Wong et al., 2005).
Determinants of entrepreneurshipThis study conducts a cross-country analysis of entrepreneurship. Among the various factors that influence entrepreneurship, the emphasis of this research is placed on two variables, namely, big businesses and institutions.
Key factors① Big Businesses
Big businesses, particularly large industrial firms, have a significant impact on entrepreneurship, as they perform a dual role (Chandler & Hikino, 1997), which primarily works through the barrier effect and the positive spillover effect.
- (1)
The barrier effect. The presence of big businesses can hinder the market entry of potential entrants. Highly specialized capabilities create huge barriers to entry, especially in oligopolistic industries, where the new entrants are rarely start-up firms. Rather, in these industries, new entrants are usually firms in the relevant technology industry or those in the same industry in other countries (Chandler and Hikino, 1997).
- (2)
The spillover effect. The positive spillover effect of big businesses on entrepreneurship can be primarily divided into three categories, namely, (1) technology transfer, (2) labor mobility, and (3) corporate ventures (intrapreneurship).
First, numerous large firms are often accompanied by supplier firms. Given this, we can infer that in situations where there are a large number of big businesses, the probability that new firms enter into supplier contracts would be higher than otherwise. Therefore, large industrial enterprises serve as technology transfer agents through various diffusion mechanisms, including joint research and development (R&D) projects, the co-production of manufactured goods incorporating new knowledge, technology licensing, and the establishment of manufacturing subsidiaries. New firms can compensate for their R&D deficiencies through knowledge spillovers (Audretsch & Lehmann, 2005).
Second, labor mobility plays a vital role in transferring knowledge from mature companies to new high-growth firms, particularly in high-tech sectors (Fujiwara, 2017). Often, the founders of numerous famous start-ups are former employees of large firms (Acs & Szerb, 2011). Silicon Valley serves as one of the most prominent examples of this dynamic. Giants such as Apple, Facebook, Google, and Intel originated in this environment. Placing a sole focus on Google, numerous companies, such as Twitter and Instagram, were founded by Googlers in Silicon Valley. The term “Googlepreneurs” has even been coined.
Third, the in-house start-up activities that occur within large firms, which are called intrapreneurship, also form an essential aspect of entrepreneurship. Countless large firms promote intrapreneurship within their departments to attain better elasticity and innovation (Urbano et al., 2022; Stopford & Baden-Fuller, 1994). Some of these internal start-ups eventually spin off from their parent companies to become stand-alone start-ups. This phenomenon is particularly more prevalent in developed economies.
The two contrasting effects discussed above, the barrier effect versus the spillover effect, of big businesses are related to the impact on entrepreneurship. Considering these opposing effects, it is not possible to definitively determine the net effect's sign. Therefore, verifying the overall impact of big businesses on entrepreneurship, while accounting for both the negative barrier effect and the positive spillover effect, becomes an empirical matter. Consequently, we propose the following first hypotheses, with further empirical analysis to be conducted in the next section.
Hypothesis 1-a The barrier effect of big businesses on entrepreneurship is greater than the positive spillover effect.
Hypothesis 1-b The positive spillover effect of big businesses on entrepreneurship is greater than the barrier effect.
② Institutions
To date, studies on entrepreneurship have mainly analyzed the relationship between institutions and new firm creation. However, studies investigating the influences of institutions on entrepreneurship have provided conflicting findings. Previous research has often employed institutional theory to illustrate the positive effects of institutions on entrepreneurship (Lee & Lee, 2022; Ma et al.,2019; Baumol, 1996). However, some studies suggest a neutral or negative role of institutions in entrepreneurship (Udimal et al., 2020; Román et al., 2013; Lu & Tao, 2010). For instance, Román et al. (2013) found that inflexible but rigid labor market institutions tend to lead smaller firms to avoid high employment costs. Specifically concerning the BRICS case, Udimal et al. (2020) found that institutional factors such as fiscal freedom, financial freedom, labor freedom, and investment freedom were negatively related to opportunity-driven entrepreneurship. Moreover, fiscal freedom and business freedom exhibit a significant negative relationship with necessity-driven entrepreneurship.
The divergent viewpoints and findings mentioned above may stem from various factors, including the heterogeneity of the measurements of institutional variables and different types of entrepreneurship. In terms of institutional context, as Acs et al. (2008) pointed out, the dynamics of entrepreneurship can vastly differ depending on the institutional context. Institutions come in various forms, including government regulations, commercial and legal infrastructure, and internal market openness. Different institutional factors exert different impacts on entrepreneurship. Furthermore, the type of entrepreneurship also plays a pivotal role in determining the relevance and significance of institutions to entrepreneurial activities. Udimal et al. (2020) noted that although fiscal freedom promotes the activities of opportunity-driven entrepreneurs, it holds less importance for necessity-driven entrepreneurship. Concerning property rights protection, Levie and Autio (2011) found that necessity-driven entrepreneurs, who engage in entrepreneurship as a last resort, tend to significantly invest in environments under weak property rights protection. The identification of which institutional factors favor entrepreneurship is, therefore, a critical area of research (Urbano et al., 2019; Fereidouni & Masron, 2012). Additionally, investigating the impact of each institutional factor on the two different types of entrepreneurship, namely, opportunity- and necessity-driven entrepreneurship, is necessary. Consequently, we propose our second hypothesis.
Hypothesis 2 The effect of institutions on entrepreneurship varies according to the type of entrepreneurship and the institutional context.
In addition to big businesses and institutions, we also take into account other factors that influence entrepreneurship. These additional factors can be categorized into demand- and supply-side factors (Audretsch et al., 2002; Verheul et al., 2002). In this regard, it can be viewed in alignment with the eclectic framework of entrepreneurship (EFE), initially introduced by Audretsch et al. (2002), which combines factors influencing the demand for entrepreneurs with those influencing the supply of entrepreneurs (De Clercq et al., 2008).
The demand for entrepreneurship is primarily influenced by the level of economic development as reflected in per capita income, and globalization (Carree et al., 2002; Storey, 2017; Schultz, 1990; Kuznets & Murphy, 1966). These factors shape the diversity of market demands and create opportunities for entrepreneurs. First, the effects of economic development on entrepreneurship appear to be uncertain. On the one hand, several studies have proposed that economic growth is associated with a decrease in the formation of new firms (Schultz, 1990; Kuznets & Murphy, 1966). As an economy develops, the majority of the population possesses the basic skills necessary to secure employment, thus leading to a decline in self-employment. In such cases, necessity-driven entrepreneurship predominates. On the other hand, some studies have found that an increase in per capita income has exerted a positive impact on the rate of entrepreneurial activity in several developed countries since the 1970s (Carree et al., 2002; Storey, 2017). The reason for this is that as the economy develops, consumer demand becomes more advanced, thus leading to an increased demand for various goods, which can serve as an opportunity for the formation of new firms. From the aforementioned analysis, it appears that economic development tends to increase opportunity-driven entrepreneurship and decrease necessity-driven entrepreneurship. Second, the impact of globalization (i.e., foreign direct investment [FDI] and trade) on the level of entrepreneurship can be both positive and negative. Globalization refers to the incorporation of global markets, and it provides opportunities for exploiting economies of scale. Thus, globalization influences entrepreneurship through the diversity of needs arising from people's exposure to a range of foreign products. However, the lowering of barriers to entry leads to increased competition and variability in sales. Consequently, we propose that globalization's positive and negative impacts offset each other, and its overall impact on entrepreneurship is nonsignificant.
The total supply of entrepreneurs mainly depends on the size of the population and the quality of the human capital in the labor market. A large population base indicates a high probability of entrepreneurs emerging. In addition, the quality of human capital may have a positive impact on entrepreneurship. In general, tertiary education increases formal entrepreneurship due to higher self-confidence and enhanced human capital (Jiménez et al., 2015). For example, a study involving a Swedish individual sample showed that entrepreneurs achieved a higher educational level than those in their control group (Delmar & Davidsson, 2010). Therefore, we believe that a large population base and higher human capital quality have positive effects on entrepreneurship.
Theoretical considerations for entrepreneurship, big businesses, and economic developmentPorter (1990) and Porter et al. (2002) classified the roles and characteristics of entrepreneurship into the following three primary categories based on a country's economic development level: (1) factor-, (2) efficiency-, and (3) innovation-driven stages. Building on Porter's framework, we classify countries into three stages—lower-middle-, upper-middle-, and high-income countries—according to their gross national income per capita as classified using the World Bank's method.
- ①
Factor-driven stage
(Description) In this study, we match this stage with the lower-middle-income stage. Economies in this stage focus on achieving cost efficiencies in the production of low-value-added products.
(Technology) Economies in this stage do not generate information for innovation or leverage knowledge for exports (Acs & Szerb, 2011).
(Entrepreneurship) The factor-driven stage is characterized by a high prevalence of necessity-driven entrepreneurs. In this stage, individual opportunity perception lacks the support of strong domestic demand. Moreover, the skills available are suited for low- or semi-skilled jobs, and access to formal education is limited. In factor-driven countries, most start-ups emerge due to a lack of employment opportunities, thus leading to a high proportion of necessity-driven start-ups (Acs & Szerb, 2011).
(Big businesses) The prominent actors in the factor-driven stage are large rent-seeking firms. The institutional framework rewards rent-seeking manufacturers that provide basic goods. Start-up regulations are often cumbersome in most of the poorer countries, forcing entrepreneurs to operate in the informal or underground economy (Acs & Szerb, 2011). Nevertheless, even when market failures are severe, entrepreneurs still exist. Entrepreneurs respond to these market failures by implementing various measures to bridge the gaps. As institutions are further strengthened, productive entrepreneurship gradually takes over and replaces destructive and unproductive practices (Acs & Szerb, 2011). In summary, as the dominant players are large rent-seeking firms, entrepreneurs are pushed from the formal sector into the informal sector. Therefore, we propose the following hypothesis:
Hypothesis 3 (Factor-driven stage) An increase in the share of big businesses is associated with an increase in the prevalence of necessity-driven entrepreneurship. Efficiency-driven stage
(Description) This stage matches the upper-middle-income stage. In successful emerging economies, manufacturing industries often dominate the efficiency-motivated economy, and firms in these industries tend to exploit economies of scale.
(Technology) The absorption of new technology is increasingly vital during the efficiency-motivated stage.
(Entrepreneurship) The efficiency-motivated stage is characterized by a decline in the entrepreneurial activity rate; in other words, the share of both necessity-driven start-ups and opportunity-driven start-ups decreases during this stage (Acs & Szerb, 2011). A significant portion of the population during this stage acquires the basic skills required to secure employment, thus leading to a decline in the number of necessity-driven start-ups. In addition, the overall start-up costs increase, which is partially due to heightened regulation and financial requirements. These barriers to entry increase the risk of launching a venture, thereby reducing the opportunities for start-ups.
(Big businesses) The majority of the population in this stage prefers being employed by large firms. As the scale-oriented manufacturing sector dominates the economy and offers more job opportunities, the opportunity cost of self-employment in comparison with that of being an employee increases, rendering business start-ups less attractive (Wennekers et al., 2005). This decreasing trend in business ownership is a widespread phenomenon (Parker, 2004), and developed countries, especially the successful emerging economies of the past, undergo this development phase at some point. The so-called “Asian tigers,” namely Korea and Singapore, began this transformation four decades ago. These two countries share the following common features: growth in the number of big businesses, which increases employment, and growth in the level of FDI, mainly in traditional manufacturing sectors, which creates additional jobs (Acs & Szerb, 2011). Therefore, the fourth hypothesis is as follows:
Hypothesis 4 (Efficiency-driven stage) An increase in the share of big businesses is accompanied by a decrease in the share of both opportunity- and necessity-driven entrepreneurship. Innovation-driven stage
(Description) We match this stage with the high-income stage. In the innovation-driven stage, high value-added sectors are developed, and entrepreneurship is considered a necessity. Consequently, the innovation-driven stage is characterized by heightened knowledge- and technology-intensive activities, which are deemed vital inputs.
(Technology) The application and creation of new technology are critical in the innovation-motivated stage.
(Entrepreneurship) A rising prevalence of opportunity-driven start-ups occurs during the innovation-motivated stage.
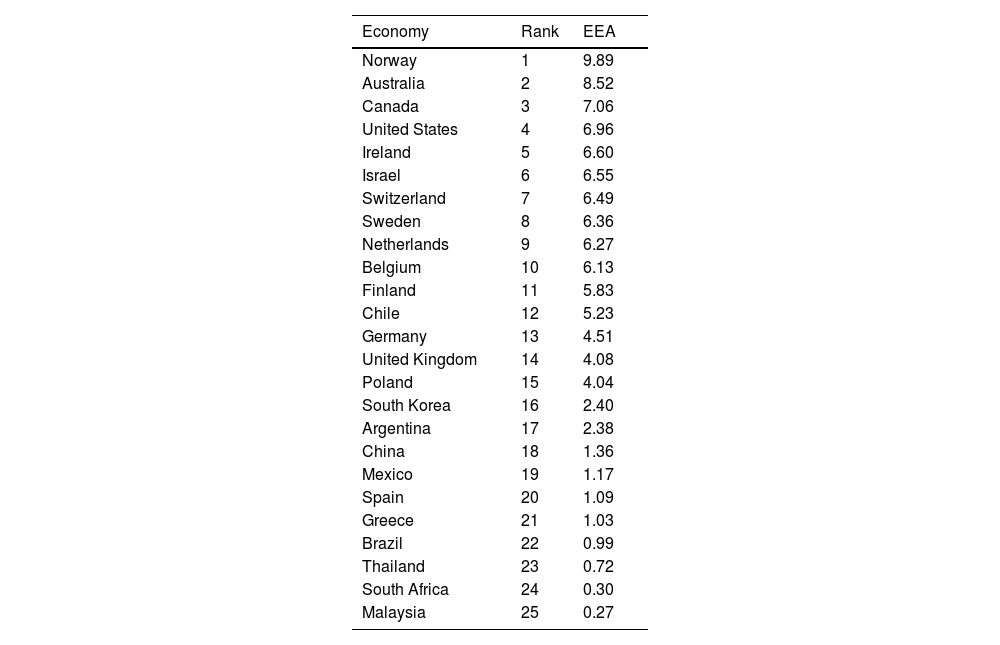
(Big businesses) In the innovation-motivated stage, companies compete on the grounds of innovation. There is a high risk of failure in this stage, which prompts large firms to concentrate on core competencies and outsource noncompetitive or nonessential business functions. These outsourced domains provide opportunities for new firms to enter the market. Moreover, at this time, venture investment ecosystems, such as angel capital, are well established and provide ready access to financing, enabling a person to start a business on the basis of a good idea alone. In this stage, the focus shifts from firms to individuals who have acquired new knowledge and decided to establish new firms based on the expected net returns of a new product. Usually, these individuals are former employees of large firms who eventually establish their own companies (Acs & Szerb, 2011). The majority of entrepreneurs in this context are undoubtedly opportunity-driven entrepreneurs. In addition, the number of corporate ventures also increases at this stage. Large firms promote intrapreneurship within their business units to achieve greater flexibility and innovativeness (Stopford & Baden-Fuller, 1994). Some of these in-house start-ups eventually separate from the parent company to become independent start-ups. The GEM has been suggested as the most consistent method for measuring the intrapreneurship level in the economy (Stam & Stenkula, 2017). Intrapreneurship is measured by entrepreneurial employee activity (EEA), that is, the entrepreneurial activities within a company. As shown in Table 1, we find that the countries with high EEA levels are all high-income countries. Therefore, we assume that opportunity-driven start-ups and in-house start-up activities in large companies are active in high-income countries. In summary, we hypothesize the following:
List of countries with associated EEA (2015).
Note: EEA: The proportion of employees participating in entrepreneurial activities, such as developing or launching new products or services, or setting up new business departments.
Source: Author's creation based on GEM Database.
Hypothesis 5 (Innovation-driven stage) An increase in the share of big businesses is accompanied by an increase in the prevalence of opportunity-driven entrepreneurship but is not directly related to necessity-driven entrepreneurship.
The empirical analysis presented herein utilizes data from the GEM program to describe and analyze entrepreneurial processes across various countries (Audretsch et al., 2021). To measure entrepreneurship, we employ the GEM's total early-stage entrepreneurship activity (TEA) rate. The overall TEA rate is defined as the proportion of working-age adults (aged 18–64 years) in the population who are either engaged in launching a business or are owners of firms established within 42 months or less.
Type of entrepreneurshipBased on the motivation for initiating a business, we categorize entrepreneurship into two types: opportunity- and necessity-driven entrepreneurship. In our empirical analysis, we utilize two distinct TEA indices, namely the opportunity-driven early-stage entrepreneurial activity (TEA-opp) rate, and the necessity-driven early-stage entrepreneurial activity (TEA-nec) rate, as measures of entrepreneurship. Opportunity-driven early-stage entrepreneurs comprise the participants in the GEM survey whose primary reason for starting a business is to exploit a promising opportunity, increase their income, or fulfill personal goals. In contrast, individuals who started a business due to a lack of alternative employment opportunities fall into the category of necessity-driven early-stage entrepreneurs. The definitions of these two groups are based on their respective proportions among working-age adults per 100 involved in nascent or young firms. Using this classification, more than 97 % of entrepreneurs are either opportunity- or necessity-driven entrepreneurs (Wennekers et al., 2005).
Big businessesWe utilize the Osiris database to measure the presence of big businesses, including publicly listed companies, delisted entities, and major unlisted companies that hold substantial influence within their respective sectors. Osiris covers approximately 70,000 companies on a global scale. A notable advantage of Osiris is that it facilitates comparisons among companies through the use of harmonized financial reports. Thus, the firms considered in this study are nonfinancial firms ranked in the top 30 in each country based on their annual sales. In our empirical analysis, big businesses are measured by the ratio of the top 30 nonfinancial companies’ total sales to GDP (Top30-ratio).
Fig. 1 presents the basic and negative relationship between big businesses and entrepreneurship. This observation generally implies that countries with a higher proportion of large firms exhibit a lower ratio of entrepreneurship. However, it is crucial to note that this finding represents a simple relationship between these two variables without controlling for other factors.
Institutions.Note: tea = TEA.")
To evaluate a country's entrepreneurial institutional environment, this study employs the entrepreneurial framework conditions (EFCs) developed by the GEM. These EFCs are used to characterize the areas of interest for policymakers aiming to promote entrepreneurship. We can treat EFCs as representing the fundamental rules of the game for entrepreneurial activity in any given setting. Thus, changing the EFCs may change the entrepreneurial activity rate (Reynolds et al., 1999). In the EFCs, 9 basic institutional conditions (with 12 detailed institutional factors) that either facilitate or hinder new business creation in each country are proposed.
In our empirical analysis, we utilize the overall composite index of institutions and their subindices that cover various dimensions, including entrepreneurial finance, government policies, entrepreneurial education, commercial and legal infrastructure, entry regulations, and cultural and social norms.2 Our focus is on examining the relationship between various aspects of the institutional environment, using both the composite institutional development index (comprising the weighted-average index, Institution-v1, and the simple average index, Institutution-v2), and the 12 components (referred to as Institution1∼12), in relation to entrepreneurship. In other words, we employ the EFCs institutional development index as the measure for institutions. This institutional environment index ranges from 1 to 5, with 1 indicating a terrible environment and 5 indicating an excellent environment. This index is derived from a survey of entrepreneurship experts conducted in each of the respective countries.
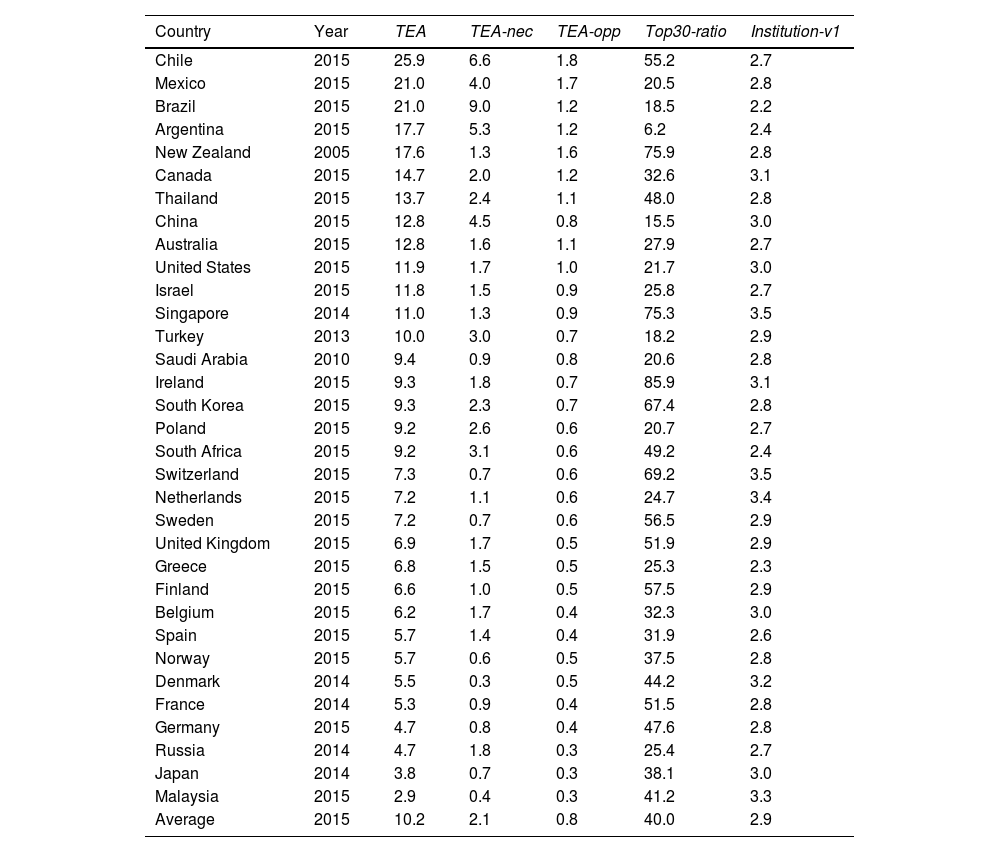
Table 2 presents the average values of entrepreneurship, big businesses, and institutions at different stages of economic development as well as those over the study period. As the economy develops, the proportion of big businesses tends to increase, institutions evolve, and the level of entrepreneurship generally decreases. Table 3 lists 33 countries, along with their corresponding levels of entrepreneurship, big businesses, and institutions. First, the average share of the overall TEA rate is 10.2 %. Chile, with the highest TEA rate, has as high a share as 25.9 %. Relatively low shares are observed in Russia, Japan, and Malaysia. Second, the average share of the total sales of the top 30 nonfinancial firms to GDP is 40.0 %. In Ireland, New Zealand, and Singapore, these shares are notably high at 85.9 %, 75.9 %, and 75.3 %, respectively. Relatively low shares are found in Turkey and China. Third, the average value of institutions is 2.9. The top three countries with the highest institutional levels are Switzerland, Singapore, and the Netherlands, whereas the bottom three countries are South Africa, Greece, and Brazil. In summary, except for the observation that more developed countries tend to have a higher proportion of big businesses, we fail to identify any other rules through the use of only raw data.
Relationship among entrepreneurship, big businesses, and institutions at different developmental levels (2015).
Source: Author's creation based on GEM Database.
List of countries with associated entrepreneurship, big businesses, and institutional levels.
Source: Author's creation based on the combined GEM and Osiris Database.
Other variables fall into two categories: demand-side factors and supply-side factors.
In terms of demand-side factors, we utilize GDP per capita (Gdppercapita) as an indicator of economic development level. To capture a country's integration into global markets, which is referred to as globalization, we incorporate trade level (Openness) and FDI (Fdi) in the equation. Openness measures the percentage of a country's exports and imports of goods and services relative to its GDP, while Fdi represents the percentage of a country's net inflow of foreign capital relative to its GDP.
For supply-side factors, we use the total population (Pop-total) of a country to assess the overall supply of potential entrepreneurs. We also control for the quality of human capital (Edu-tertiary), which reflects a country's gross tertiary education enrollment rate. Additionally, we include developmental stage dummy variables (High, UM, and LM) for the respective economies.
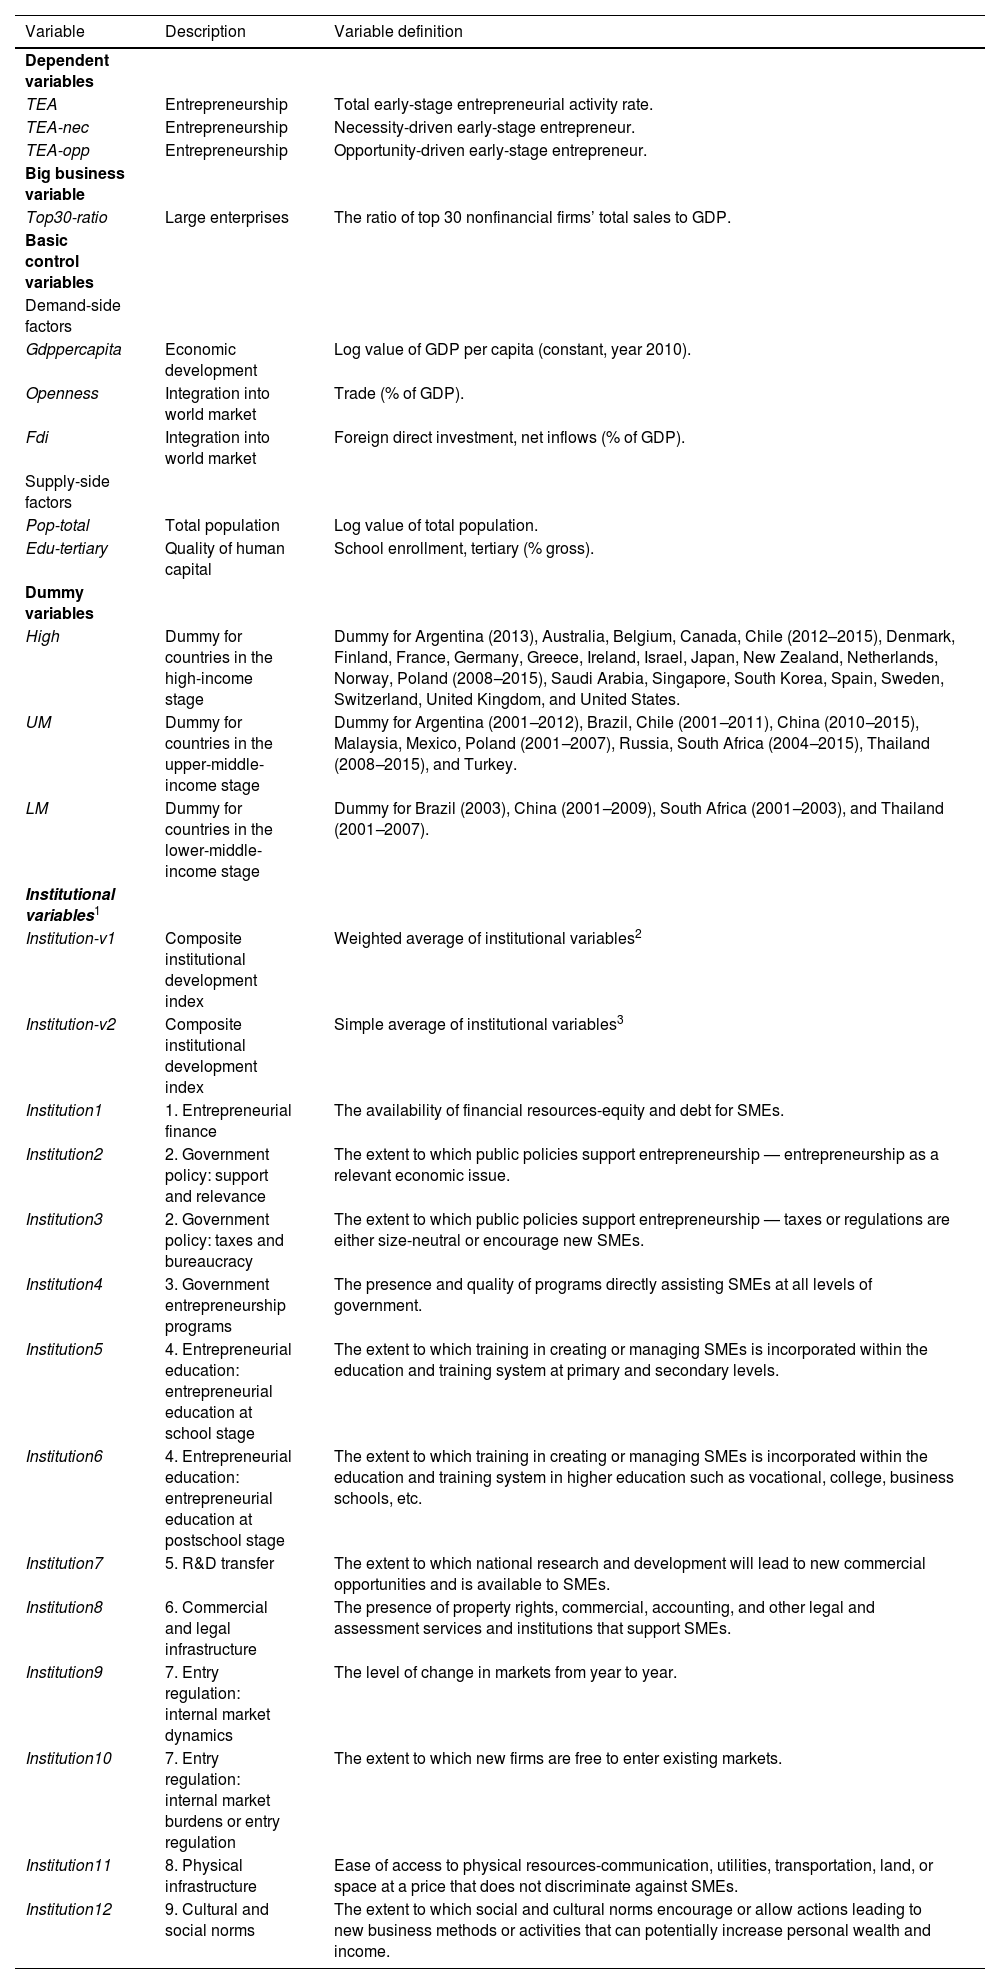
Table 4 provides definitions for the variables, including dependent variables, the big business variable, institutional variables, basic control variables, and developmental stage dummy variables for the three stages. Descriptive statistics and data sources are reported in Table 5.
Variable definitions
| Variable | Description | Variable definition |
|---|---|---|
| Dependent variables | ||
| TEA | Entrepreneurship | Total early-stage entrepreneurial activity rate. |
| TEA-nec | Entrepreneurship | Necessity-driven early-stage entrepreneur. |
| TEA-opp | Entrepreneurship | Opportunity-driven early-stage entrepreneur. |
| Big business variable | ||
| Top30-ratio | Large enterprises | The ratio of top 30 nonfinancial firms’ total sales to GDP. |
| Basic control variables | ||
| Demand-side factors | ||
| Gdppercapita | Economic development | Log value of GDP per capita (constant, year 2010). |
| Openness | Integration into world market | Trade (% of GDP). |
| Fdi | Integration into world market | Foreign direct investment, net inflows (% of GDP). |
| Supply-side factors | ||
| Pop-total | Total population | Log value of total population. |
| Edu-tertiary | Quality of human capital | School enrollment, tertiary (% gross). |
| Dummy variables | ||
| High | Dummy for countries in the high-income stage | Dummy for Argentina (2013), Australia, Belgium, Canada, Chile (2012–2015), Denmark, Finland, France, Germany, Greece, Ireland, Israel, Japan, New Zealand, Netherlands, Norway, Poland (2008–2015), Saudi Arabia, Singapore, South Korea, Spain, Sweden, Switzerland, United Kingdom, and United States. |
| UM | Dummy for countries in the upper-middle-income stage | Dummy for Argentina (2001–2012), Brazil, Chile (2001–2011), China (2010–2015), Malaysia, Mexico, Poland (2001–2007), Russia, South Africa (2004–2015), Thailand (2008–2015), and Turkey. |
| LM | Dummy for countries in the lower-middle-income stage | Dummy for Brazil (2003), China (2001–2009), South Africa (2001–2003), and Thailand (2001–2007). |
| Institutional variables1 | ||
| Institution-v1 | Composite institutional development index | Weighted average of institutional variables2 |
| Institution-v2 | Composite institutional development index | Simple average of institutional variables3 |
| Institution1 | 1. Entrepreneurial finance | The availability of financial resources-equity and debt for SMEs. |
| Institution2 | 2. Government policy: support and relevance | The extent to which public policies support entrepreneurship — entrepreneurship as a relevant economic issue. |
| Institution3 | 2. Government policy: taxes and bureaucracy | The extent to which public policies support entrepreneurship — taxes or regulations are either size-neutral or encourage new SMEs. |
| Institution4 | 3. Government entrepreneurship programs | The presence and quality of programs directly assisting SMEs at all levels of government. |
| Institution5 | 4. Entrepreneurial education: entrepreneurial education at school stage | The extent to which training in creating or managing SMEs is incorporated within the education and training system at primary and secondary levels. |
| Institution6 | 4. Entrepreneurial education: entrepreneurial education at postschool stage | The extent to which training in creating or managing SMEs is incorporated within the education and training system in higher education such as vocational, college, business schools, etc. |
| Institution7 | 5. R&D transfer | The extent to which national research and development will lead to new commercial opportunities and is available to SMEs. |
| Institution8 | 6. Commercial and legal infrastructure | The presence of property rights, commercial, accounting, and other legal and assessment services and institutions that support SMEs. |
| Institution9 | 7. Entry regulation: internal market dynamics | The level of change in markets from year to year. |
| Institution10 | 7. Entry regulation: internal market burdens or entry regulation | The extent to which new firms are free to enter existing markets. |
| Institution11 | 8. Physical infrastructure | Ease of access to physical resources-communication, utilities, transportation, land, or space at a price that does not discriminate against SMEs. |
| Institution12 | 9. Cultural and social norms | The extent to which social and cultural norms encourage or allow actions leading to new business methods or activities that can potentially increase personal wealth and income. |
Source: Author's creation based on GEM, Osiris, and World Development Indicators Database.
Descriptive statistics.
Note: Obs. = observation, Std. Dev. = standard deviation, Max = maximum, Min = minimum.
Source: Author's creation based on GEM, Osiris, and World Development Indicators Database.
The subsequent empirical analysis section compares the effects of big businesses and institutions on entrepreneurship by controlling for demand- and supply-side factors. We also investigate how the impact of big businesses varies in regard to different types of entrepreneurship across the various stages of economic development.
Regression modelThe basic approach adopted in this cross-country entrepreneurship study involves the estimation of the following model:
where i denotes the country, t indicates the time, and Entrepreneurshipit′ is a measure of entrepreneurial activity (i.e., TEA, TEA-opp, or TEA-nec) in country i at time t. Keyit′ is a vector of the variables of interest (i.e., Top30-ratio; and Institution-v1∼v2 or Institution1∼12) in country i at time t. Demandit′ is a vector of demand-side determinants of entrepreneurship, i.e., Gdppercapita, Openness, and Fdi level in country i at time t. Supplyit′ is a vector of supply-side factors determining entrepreneurship, i.e., Pop-total and Edu-tertiary in country i at time t. Demandit′ and Supplyit′ are the vectors of control variables, which are consistent with the EFE and are assumed to increase the accuracy of the parameter estimates and decrease bias. ρit is the error term.
In this study, we conduct fixed-effect (FE) estimations. As discussed in Islam (1995), FE panel estimation helps mitigate the issue of omitted variable bias (Galindo & Méndez, 2014). FE models are commonly employed in country-level regressions, as the FE allows for different intercepts for each observation (Wooldridge, 2010).
Empirical results and discussionThe relationship between big businesses and entrepreneurshipFirst, the basic relationship between big businesses and entrepreneurship is investigated in this section. We specify the following relationship:

Entrepreneurship: TEA; TEA-opp; TEA-nec
The benchmark model primarily examines whether the presence of big businesses exerts a positive or negative impact on new firm creation with basic control variables included in the regressions. The basic control variables used are GDP per capita (Gdppercapita), which is used to control economic development levels, and globalization, such as FDI (Fdi) and trade (Openness) levels. In terms of supply-side factors, the overall supply of potential entrepreneurs as represented by the total population (Pop-total) and the variable of tertiary school enrollment (Edu-tertiary) as a proxy for human capital are included in the regressions. In contrast to the existing models in the literature, a key feature of our model is the inclusion of the big business variable as a regressor. Big business is measured by the ratio of the top 30 nonfinancial companies’ total sales to GDP (Top30-ratio).
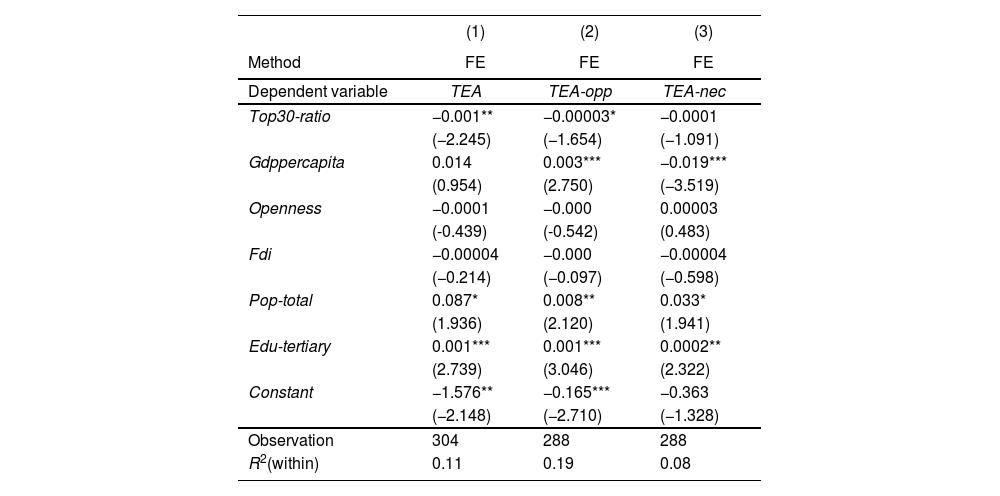
In Column (1) of Table 6, the result is represented by the estimates of the overall TEA rate of entrepreneurship and the Top30-ratio of big businesses based on the FE model. The result reveals the negative and significant coefficient of the variable of big businesses. To gain further insights into the determinants of the different types of entrepreneurship, we proceed to estimate Eq. (1) by using two different TEA indices, namely, the opportunity-driven early-stage entrepreneurial activity (TEA-opp) rate and the necessity-driven early-stage entrepreneurial activity (TEA-nec) rate, as measures of entrepreneurship. The outcomes of these two estimations based on the FE model are presented in Columns (2) and (3) of Table 6. In Column (2), the result also shows a negative relationship between the presence of big businesses and opportunity-driven entrepreneurship, but with a rather small coefficient. Regarding necessity-driven entrepreneurship, Column (3) shows that the coefficient for big businesses is not statistically significant.
The role of big businesses in different entrepreneurship types
Notes: T-values are in parenthesis.
*** p < 0.01, ** p < 0.05, *p < 0.1.
The regression results thus far indicate that an increasing share of big businesses has a negative impact on overall and opportunity-driven entrepreneurship, while it has no impact on necessity-driven entrepreneurship. In other words, the negative effect of big businesses on entrepreneurship is mainly on opportunity-driven entrepreneurship. This suggests that the barrier effect exceeds the positive spillover effect, and that a net entry barrier effect exists. This result makes sense; if resources are concentrated in big businesses, it can act as a barrier to the entry of new firms seeking opportunities. In contrast, for necessity-driven entrepreneurship, as implied by the name, the reason for starting a business is not to pursue a good opportunity but rather to compensate for having no other viable employment options. Consequently, these necessity-driven entrepreneurs are mainly influenced by personal characteristics, such as their financial constraints, and are relatively free from the influence of big businesses. In summary, the presence of big businesses is negatively related to new firm formation. This outcome aligns with the observation depicted in Fig. 1, which illustrates a basic and negative relationship between the presence of big businesses and entrepreneurship. Thus, countries with a high proportion of big businesses tend to have lower levels of entrepreneurial activity. However, notably, this finding is derived without considering the economic development stage of each country.
In addition, the other control variables tend to exhibit the expected signs and levels of significance, as discussed in the literature section. First, as shown in Columns (1) to (3) of Table 6, the coefficient of Gdppercapita exhibits different aspects depending on the type of entrepreneurship. For opportunity-driven entrepreneurship, the coefficient of Gdppercapita is positive and significant, while for necessity-driven entrepreneurship, it is negative and significant. The coefficient of Gdppercapita for overall entrepreneurship is found to be nonsignificant. These results are in alignment with the discussion presented in the literature review. As an economy develops, entrepreneurship for livelihood tends to decrease, while more individuals consider starting a business as a promising opportunity. Moreover, in Columns (1) to (3) of Table 6, the coefficients of Pop-total and Edu-tertiary are all positive and significant. These results align with the cases discussed in the literature: First, a large population base suggests that the probability of entrepreneurs emerging is high, and second, tertiary education contributes to an increased prevalence of formal entrepreneurship due to higher levels of self-confidence, lower perceived risk, and enhanced human capital (Jiménez et al., 2015; Delmar & Davidsson, 2010). Regarding globalization, encompassing such variables as Fdi and Openness, significance is not shown in any of the three models. This finding supports our proposition that the positive and negative effects of globalization offset each other, resulting in an overall nonsignificant effect on entrepreneurship.
Spillover effects of big businesses versus institutions on different entrepreneurship typesEntrepreneurship: TEA; TEA-opp; TEA-nec
This section further investigates the relationships among big businesses, various institutional factors, and different types of entrepreneurship. To explore these relationships, we employ 12 EFCs proposed by the GEM as measures of institutional factors related to entrepreneurship. In addition, two composite institutional variables are created with simple- and weighted- averages.
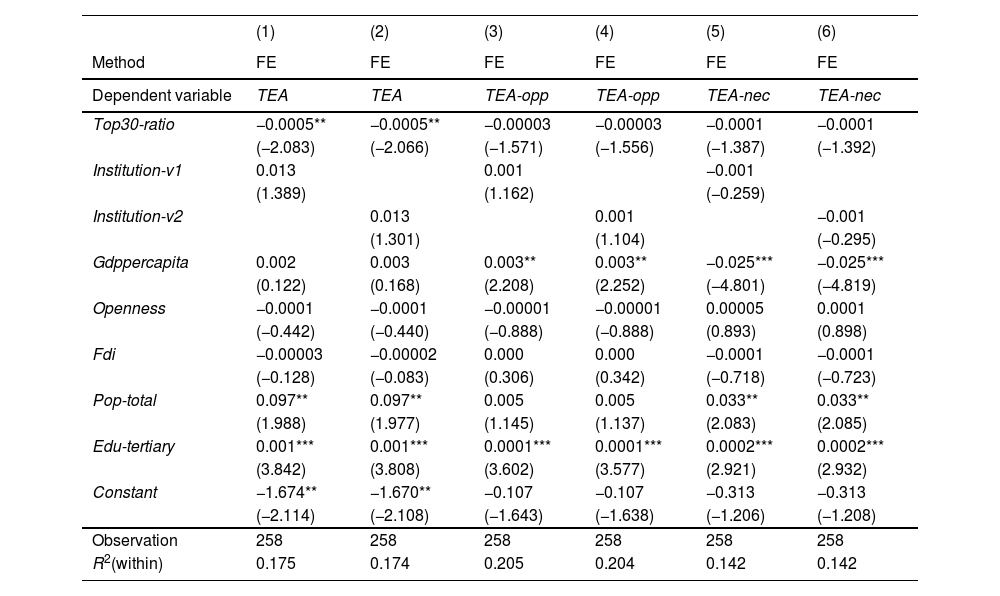
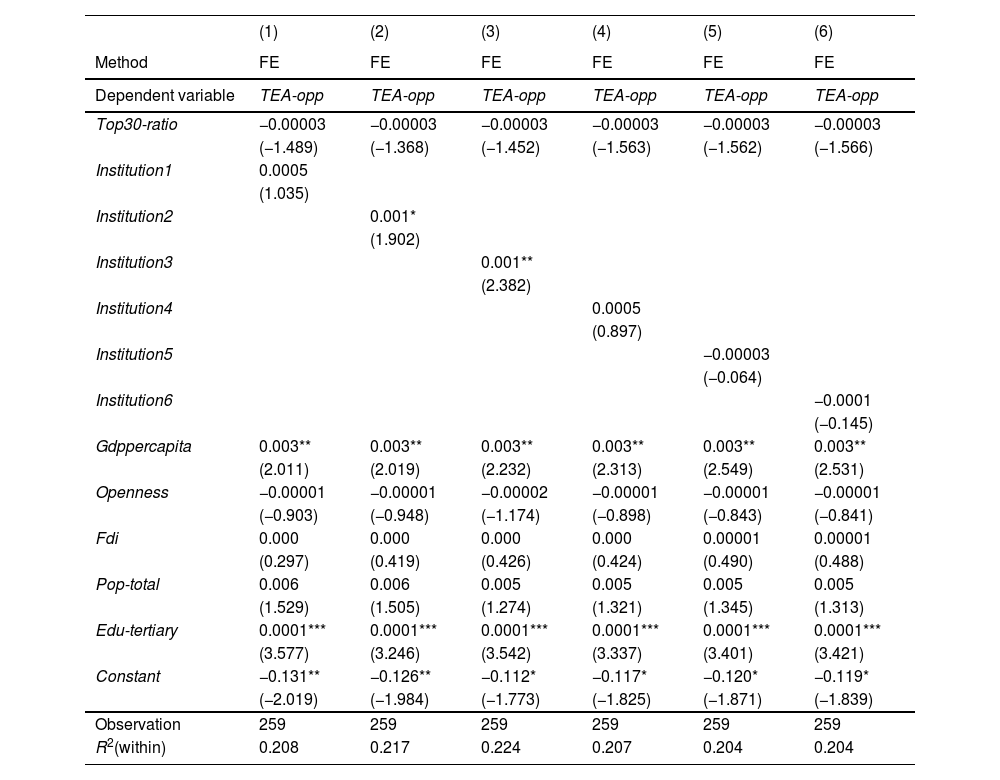
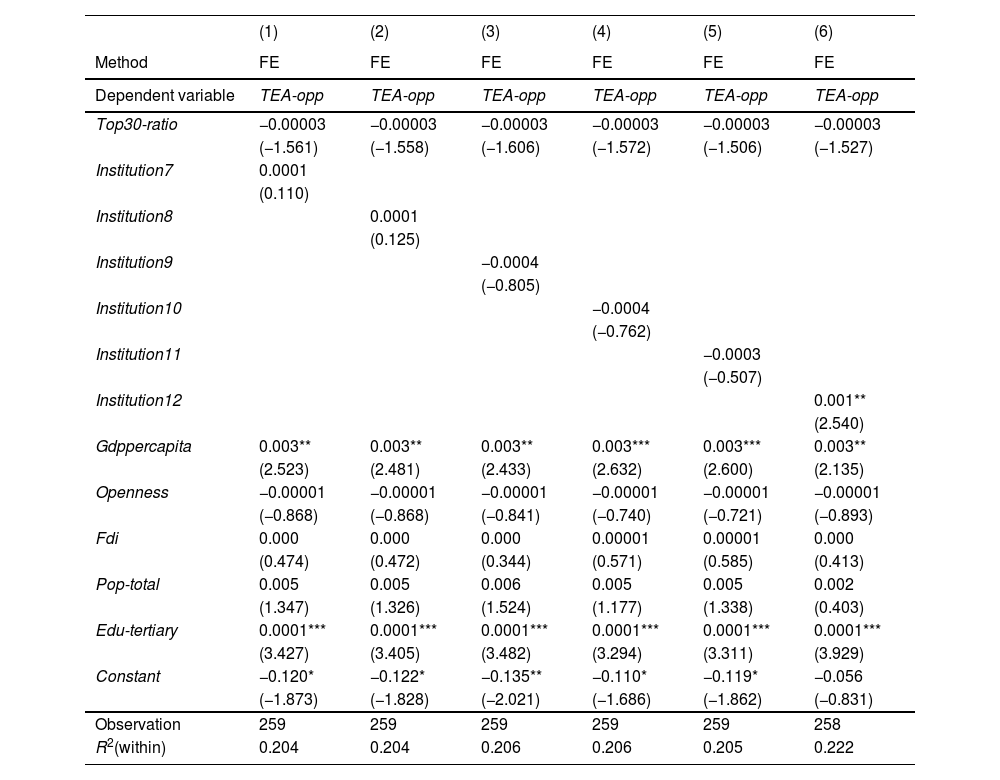
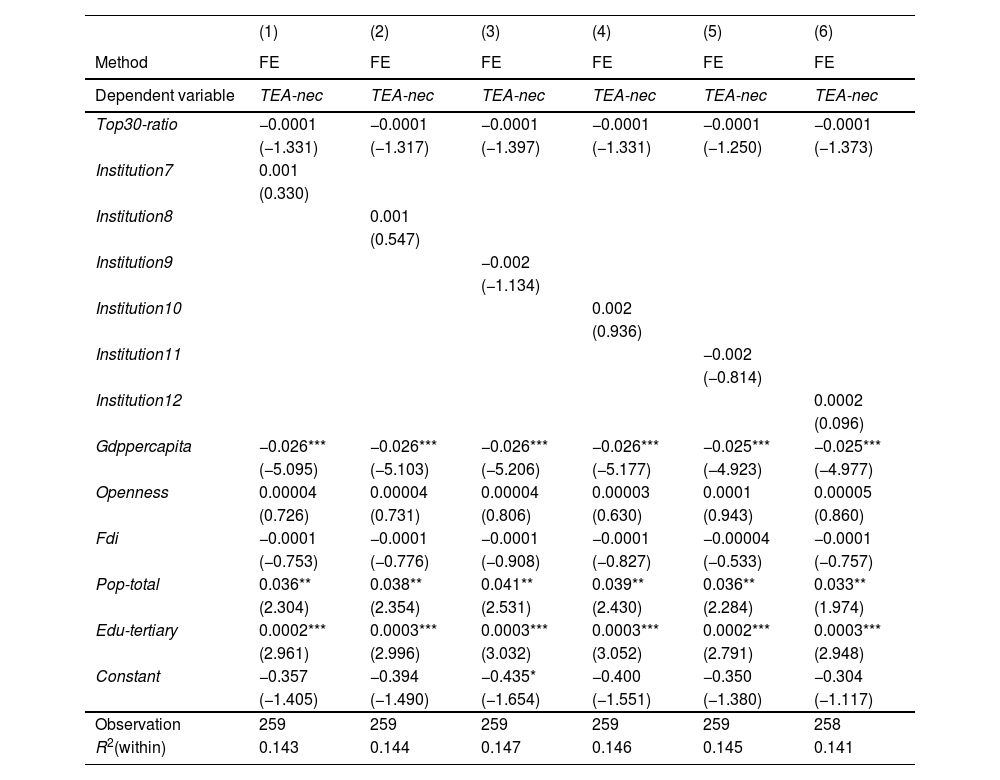
Tables 7A–7E present the results obtained after the addition of various institutional factors into a separate model. The regression results are all based on FE estimators. In Table 7A, the results are represented by the estimates of the Top30-ratio of big businesses and the composite institutional development index (namely, the weighted-average index [Institution-v1] and the simple average index [Institution-v2]) of overall institutions. Regarding the determinants of the overall TEA rate, the coefficients of big businesses are all negative and significant, as indicated in Columns (1) and (2) of Table 7A. These estimation results confirm the previous findings. However, the coefficient loses its significance after the classification of entrepreneurship types, as shown in Columns (3) to (6) of Table 7A and inTables 7B–7E. This means that the degree of the net entry barrier effect of big businesses on new firms is not that large, which implies that positive spillover effects tend to offset the negative barrier effects on new firm creation. Moreover, we fail to identify an association between a higher level of overall institutions (both the simple- and weighted-average indices) and a higher level of new business creation activities regardless of type, as indicated in Table 7A. Of the 12 institutional factors, only Institution2, Institution3, and Institution12 have a positive and significant impact on opportunity-driven entrepreneurship, as shown in Tables 7B–7C. In other words, within the institutional settings aimed at revitalizing entrepreneurship, public policies, such as taxes and regulations that support entrepreneurship, are effective in fostering opportunity-driven entrepreneurship. Moreover, positive social perceptions toward entrepreneurs have a positive effect on opportunity-driven entrepreneurship. Tables 7D–7E indicate that none of the 12 institutional factors affects necessity-driven entrepreneurship. Thus, stimulating entrepreneurship activity simply by improving the institutional factors related to entrepreneurship, particularly in the case of necessity-driven entrepreneurship, appears to be challenging.
Diverse dimensions of institutions on entrepreneurship: Composite institutional development index
Notes: T-values are in parenthesis.
*** p < 0.01, ** p < 0.05, *p < 0.1.
Diverse dimensions of institutions on opportunity-driven entrepreneurship: Subindices (Institution1∼6)
Notes: T-values are in parenthesis.
*** p < 0.01, ** p < 0.05, *p < 0.1.
Diverse dimensions of institutions on opportunity-driven entrepreneurship: Subindices (Institution7∼12)
Notes: T-values are in parenthesis.
*** p < 0.01, ** p < 0.05, *p < 0.1.
Diverse dimensions of institutions on necessity-driven entrepreneurship: Subindices (Institution1∼6)
Notes: T-values are in parenthesis.
*** p < 0.01, ** p < 0.05, *p < 0.1.
Diverse dimensions of institutions on necessity-driven entrepreneurship: Subindices (Institution7∼12)
Notes: T-values are in parenthesis.
*** p < 0.01, ** p < 0.05, *p < 0.1.
Combined with the results shown in Table 6, these findings suggest several key points. First, when the stage of economic development is not considered, the presence of big businesses usually exerts a negative spillover effect on entrepreneurship. Moreover, the presence of big businesses has a negative effect on opportunity-driven entrepreneurship but does not affect necessity-driven entrepreneurship. However, it is important to note that the extent of this net barrier effect is relatively modest. Second, only 3 of the 12 entrepreneurship-related institutional factors (Institution2, Institution3, and Institution12) positively affect opportunity-driven entrepreneurship. Moreover, none of the 12 institutional factors or the composite institutional development index affects necessity-driven entrepreneurship. These empirical results indicate that institutions are not effective in supporting individuals who are driven by the necessity to become entrepreneurs.
Big business spillover effects according to entrepreneurship type and stage of economic development
Entrepreneurship: TEA; TEA-opp; TEA-nec
In this section, we analyze whether the influence of big businesses on entrepreneurship varies across countries at different stages of economic development. We investigate the differences in big business spillover effects among high-, upper-middle-, and lower-middle-income economies by introducing an interaction term between the big business variable and the developmental stage country dummy variable.
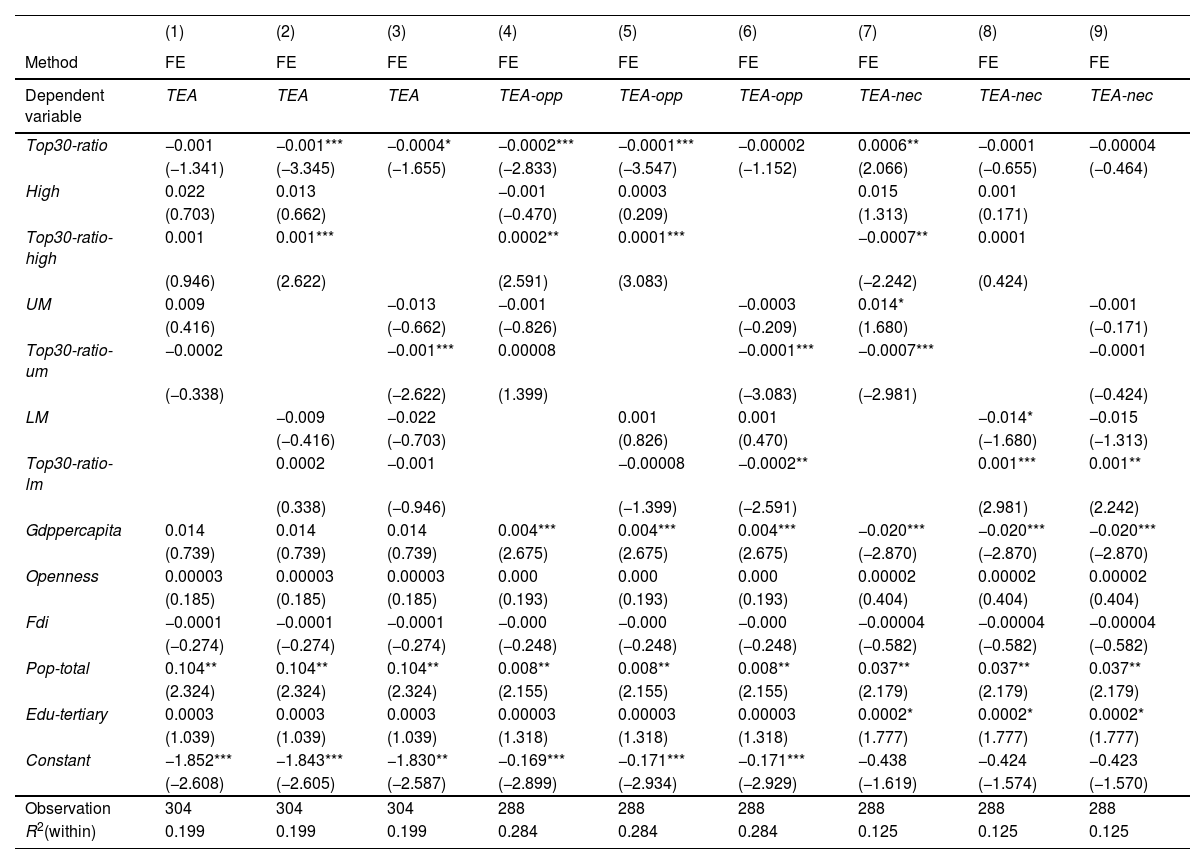
Table 8 presents the regression results. First, regarding the determinants of necessity-driven entrepreneurship in lower-middle-income countries, the coefficients of the interaction term (Top30-ration-lm) between big businesses and the lower-middle-income dummy variable are significantly positive, as shown in Columns (8) and (9). Thus, in countries at the lower-middle-income stage, the proportion of necessity-driven new ventures is positively influenced by the top 30 nonfinancial firms’ ratio of total sales to GDP. Second, in countries at the upper-middle-income stage, the proportion of overall, opportunity-, and necessity-driven entrepreneurship is negatively influenced by the top 30 nonfinancial firms’ ratio of total sales to GDP, as shown in Columns (3), (6), and (7). Third, in high-income economies, the regression results displayed in Columns (4) and (5) indicate that an increase in the presence of big businesses leads to an increase in opportunity-driven entrepreneurship. This finding is quite interesting compared with the earlier findings, as we introduce interaction terms and confirm that the effect of big businesses on entrepreneurship varies across economic development stages. The magnitude of the coefficients of Top30-ratio-high with respect to the TEA-opp rate falls within the range of 0.0001 to 0.0002, as shown in Columns (4) and (5). This suggests that if the ratio of the sales volume of the top 30 large firms to GDP in a country increases by 1 % point, the opportunity-driven entrepreneurship rate increases by approximately 0.01 % to 0.02 % points.
The changing role of big businesses according to entrepreneurship type and stage of economic development
Notes: T-values are in parenthesis.
*** p < 0.01, ** p < 0.05, *p < 0.1.
These results support our main hypotheses. First, in the early stage of economic development, an increase in the relative presence of big businesses is accompanied by a rise in necessity-driven entrepreneurship. Second, as countries advance to the upper-middle-income stage, both necessity- and opportunity-driven entrepreneurship decrease as the proportion of big businesses in the economy increases. Third, in high-income economies, an increase in the relative presence of big businesses leads to an increase in opportunity-driven entrepreneurship. As the economy grows, an “N-shaped” overall relationship between big businesses and entrepreneurship can be observed (Fig. 2).

These results require careful interpretation. The presence of big businesses in a country seems to negatively affect the creation of new businesses, but this outcome is only observed when not considering the stage of economic development. When we take into account the stage of economic development, the picture changes. At the lower-middle-income stage, where most people often struggle to secure jobs at large companies during the early phase of economic development, individuals are compelled to start businesses out of necessity. Moreover, during this period, these necessity-driven start-ups were crowded out by big businesses to start businesses in informal markets. As the economy develops to the upper-middle-income stage, individuals’ skills also improve, thereby allowing them to find jobs at large companies, representing a circumstance that reduces the level of necessity-driven entrepreneurship. However, one thing to note when interpreting the result is that this decline in necessity-driven start-ups can be viewed as a positive development at this stage. During this period, individuals tend to prefer working for large companies as the opportunity cost of starting a new business increases, which, in turn, decreases the level of opportunity-driven start-ups. As the economy subsequently enters the high-income stage, capital becomes more abundant, which makes it easier for individuals to start businesses based on innovative ideas. This leads to an increase in the presence of opportunity-driven start-ups. Meanwhile, large firms’ failure risks, such as their R&D and product risks, are high (Lin et al., 2013); thus, large firms attempt to outsource some services to other companies. This endeavor also acts as an opportunity for companies in that field and thus boosts the creation of new firms.
Summary and conclusionsIn summary, this study finds that the roles of big businesses and institutions in entrepreneurship have three interconnected aspects as follows: (1) A basic and negative relationship exists between big businesses and entrepreneurship. Specifically, an increasing share of large firms negatively affects both overall and opportunity-driven entrepreneurship, while it does not affect necessity-driven entrepreneurship. These findings hold when not considering the stage of economic development, thus supporting Hypothesis 1-a; (2) Among the various institutional factors, supportive public policies for new firms prove to be effective for fostering opportunity-driven entrepreneurs. Moreover, positive social perceptions toward entrepreneurs positively affect opportunity-driven entrepreneurship. However, none of the institutional factors appears effective for necessity-driven entrepreneurs. These empirical results support Hypothesis 2; (3) In lower-middle-income economies, an increase in the relative presence of big businesses is accompanied by a rise in necessity-driven entrepreneurship. In upper-middle-income countries, both necessity- and opportunity-driven entrepreneurship decrease as the proportion of big businesses in the economy increases. In high-income economies, an increase in the relative presence of big businesses leads to an increase in opportunity-driven entrepreneurship. These results precisely support Hypotheses 3–5. The threefold effect outlined above can be viewed as a partial answer to which actor, that is, big business or institutions, is a more critical determinant of entrepreneurship, which is our core research question. The answer is that as the economy develops, big businesses play a more important role in entrepreneurship, especially in the fostering of opportunity-driven entrepreneurship.
The core contributions of this study can be summarized as follows:
First, a big business variable is incorporated into the research concerning the determinants of entrepreneurship. Extant studies have generally either theoretically or empirically analyzed the relationship between entrepreneurship and economic development. The study of Wennekers et al. (2005) represents a prominent example of such empirical research, highlighting a “U-shaped” relationship between per capita income and entrepreneurship. However, similar to Wennekers et al. (2005), most empirical analyses are cross-sectional studies or even panel-data studies that cover periods of less than 5 years. This study takes a unique approach by investigating how the relationship between big businesses and entrepreneurship varies by the stage of economic development. We believe this perspective is valuable, as it marks, to the best of our knowledge, the first attempt at such an empirical analysis. Fig. 2 shows that when entrepreneurship type and economic developmental stage are simultaneously considered, the relationship among entrepreneurship, big businesses, and economic growth becomes “N-shaped.”
Traditionally, there have been two conflicting claims regarding the role of big businesses in entrepreneurship. The present research finds that to clarify the role of big businesses in entrepreneurship, we need to distinguish the economic development stage and the entrepreneurship type.
Second, our findings offer valuable insights for policymakers:
Institutions have traditionally been thought to play a positive role in fostering entrepreneurship in countless studies. However, our research reveals that the influence of institutions on entrepreneurship is somewhat limited. Some institutional factors, such as favorable tax policies or supportive regulations toward entrepreneurship, are effective for opportunity-driven entrepreneurs. Nevertheless, none of these institutional factors appear to have a significant impact on necessity-driven entrepreneurs. Meanwhile, the more positively society perceives start-up activities, the more encouraging their influence on entrepreneurship is (Huang et al., 2022; Haddad et al., 2021). However, changing public perceptions through government policy is difficult and, even if possible, takes a long time. Moreover, the composite institutional index is found to not affect entrepreneurship. Additionally, it becomes imperative for a government to distinguish between opportunity- and necessity-driven start-ups when formulating policy support for entrepreneurial activities. Blindly providing support for necessity-driven start-ups should be avoided.
Regarding big businesses, Lee et al. (2013) confirmed the significant role of big businesses in economic growth. However, concerns have been raised about the possibly negative impact of big businesses on entrepreneurship. The results of this study indicate that the magnitude of the effect of big businesses on the net entry barriers for new businesses is diminishing; that is, as the economy develops, big businesses increasingly become essential in entrepreneurship, especially for opportunity-driven entrepreneurship. This finding holds important policy implications for countries seeking to overcome the middle-income trap. The policy of “big businesses first and SMEs later” may be a sensible approach, particularly for emerging economies. Business group is a common form taken by big business in emerging economies. Such economies often grapple with higher degree of institutional voids, which tends to prompt the emergence and growth of business groups (Khanna & Palepu, 2000, 1997, Leff, 1978). Morevoer, given the significant shortcomings in capital markets, direct policy support for start-ups may be inefficient or prohibitively costly, whereas promoting a select few large players may offer a more pragmatic solution.
This study has some limitations. First, due to data constraints, low-income countries are not included in this research. This exclusion may introduce bias toward less developed countries. Second, this study focuses on large nonfinancial businesses. The role of large financial businesses, such as banks or securities companies, might also have spillover effects on entrepreneurship and could possess different characteristics than those of nonfinancial firms. These limitations can serve as a direction for future research.
StatementsThe authors did not receive support from any organization for the submitted work.
Corporate entrepreneurship encompasses two distinct phenomena, namely, the creation of new ventures within existing organizations and the revitalization of existing organizations through strategic renewal. However, research on spillover effects of big businesses, such as the generation of new business opportunities for third-party companies, remains unexplored.
Refer to the explanations provided in Table 4 for definitions and details regarding the institutional variables.
articles