


This exploratory study aimed to identify new predictors of the acceptance of artificial intelligence (AI) among students by comparing the effectiveness of three models: the technology acceptance, unified theory of acceptance and use of technology, and value-based adoption model. A quantitative and cross-sectional computer-assisted web interview survey was administered to 2098 university students between December 2023 and January 2024. Linear regression analysis was performed. The key contribution of the study is its introduction of the responsibility variable as a new factor that significantly increases the explanatory power of the examined models. This finding necessitates the inclusion of technology-related ethical and social aspects as an update to the existing theoretical framework. This paper offers a new perspective on the intersection of technology acceptance and responsibility, thus providing a basis for strategising and policymaking to support the implementation of AI in line with social values.
In the present era of rapid technological advancement, artificial intelligence (AI) is transforming how institutions, markets, and everyday life operate. The effects of AI extend beyond purely technical domains to include social processes, ethical norms, and political decisions (Choung et al., 2023; Dwivedi et al., 2021). AI influences not only how we work and learn but also how we perceive responsibility, control, and trust in human–technology relationships (Sartori & Bocca, 2023; Sun et al., 2024). The role of trust in the successful integration of AI in individual and organisational contexts is increasingly emphasised (Korzyński et al., 2024), further indicating the need to analyse the normative aspects of human–technology relationships. Understanding the determinants of user acceptance of AI is important not only for effective technology implementation but also for research on the social consequences of digital transformation. Reflecting on the norms and values that are considered and overlooked in the design and dissemination of AI-based solutions is crucial (Fel & Kozak, 2025).
Previous research on technology acceptance has relied mainly on the technology acceptance model (TAM), the unified theory of acceptance and use of technology (UTAUT) and the value-based adoption model (VAM; Davis, 1989; Kim et al., 2007; Venkatesh, 2000). These models have provided valuable tools for analysing user behaviour towards new technologies, and they have been widely applied in a variety of commercial and institutional contexts. Related studies have mainly focused on the functional and usability aspects of AI, such as ease of use, social impact, and utility value (Horodyski, 2023a, 2023b).
Little is known about how categories of responsibility–namely, legal, algorithmic, moral, and engineering–affect AI acceptance, especially among young adults. Research has rarely considered the responsibility dimension and has tended to be limited to constructs based on comfort of use and functional benefits. The literature reports interesting attempts to extend technology acceptance models through the inclusion of additional variables, such as trust, in the role of mediator (Korzyński et al., 2024) and through integration with other theoretical approaches such as protection motivation theory or theory of planned behaviour (TPB; Kim & Kyung, 2023). Integration with more complex approaches that combine elements of the UTAUT, the elaboration likelihood model and the information adoption model (Camilleri, 2024) has also been attempted. However, responsibility as an independent predictor remains unexplored. Even elaborate models focus mainly on the functional and cognitive aspects of interaction with AI, without considering the normative dimension of responsibility. Moreover, few studies have taken students as a research group, although students are among the so-called early adopters of technology and are of particular relevance for future technology implementation and regulation processes (Zdun, 2016).
The present study adopts an exploratory perspective and introduces responsibility as a new, external predictor that has hitherto been absent from the TAM, UTAUT, and VAM structures. The proposed approach does not calibrate existing constructs through moderation or mediation but rather aims to extend the theoretical basis of AI acceptance research to include a normative-ethical component that has thus far been excluded from these models.
The research gap regarding the role of responsibility in AI acceptance is notable for two main reasons. First, the dominant technology acceptance models (e.g., TAM, UTAUT, and VAM) focus mainly on usability and efficiency, but AI continuously generates new challenges related to security, autonomy, algorithmic justice, and others. Second, young users, such as students, will play key roles in the future as technology designers, decision-makers and regulators (Zdun, 2016). Their approach to responsibility for AI use may have important implications for shaping implementation practices and legislation. Including the responsibility variable in models of technology acceptance allows us to move beyond a functionalist perspective and incorporate an axiological dimension into analyses.
To address the identified gap, this study entailed a quantitative computer-assisted web interview (CAWI) survey. Data were collected between December 2023 and January 2024 from 2098 university students in the United Kingdom and Poland. Analysis was carried out using linear regression. The study compared three established technology acceptance models, namely the TAM, UTAUT, and VAM, and tested the impact of a novel responsibility variable. The study aimed to identify whether and to what extent responsibility can predict AI acceptance in a role complementary to existing model components.
This study contributes to the literature on technology acceptance in two ways. First, it provides empirical evidence showing that responsibility, understood as a complex moral, legal, and engineering-algorithmic construct, can play an important role in predicting AI acceptance. In contrast to trust, which has been widely analysed and frequently acts as a mediator or facilitator, responsibility captures the axiological expectations of AI designers and users. The introduction of this variable extends previous approaches by adding a socio-normative component that the TAM, UTAUT, and VAM do not consider.
Second, this study supplemented three classical models (i.e., TAM, UTAUT, and VAM) with a responsibility component and obtained comparative results that identify the VAM as the most relevant for explaining young user attitudes towards AI. This highlights the importance of values and subjectively perceived costs in the evaluation of technology, particularly when the socio-normative dimension (i.e., responsibility) is considered.
The research findings are theoretically and practically relevant. They can inform the design of technological solutions and AI implementation policies that consider societal expectations and ethical norms. This study is a response to the demand for a more inclusive, reflexive approach to technology research that goes beyond the utilitarian and efficiency approaches that dominate classical acceptance models.
Framework and literature reviewThe rapid advancement of information technology has led to the development of numerous theories aimed at explaining technology acceptance (Horodyski, 2023b). Sohn and Kwon (2020) have pointed out that most research on the use of innovative products is based on the TAM (Davis, 1989), the TPB (Ajzen, 1985), and the UTAUT (Groß, 2015; Venkatesh et al., 2003). The VAM, proposed by Kim et al. (2007), is used as an alternative model to examine the intention to use new information and communication technologies (ICTs).
The TAM is well-documented in the literature and is the most influential and widely used theory for describing the acceptance of new technologies (Afrizal et al., 2020; Huang & Liao, 2015; Laurim et al., 2021; Natasia et al., 2022). Originally proposed by Davis (1989) with reference to the theory of reasoned action (Fishbein & Ajzen, 1975), the TAM assumes that the acceptance of information systems is determined by two main variables: perceived usefulness (PU) and perceived ease of use (PEoU). Fig. 1 provides an overview of the basic concept of the TAM.
 based on (Davis, 1989).")
Graphical scheme of the theoretical framework of the technology acceptance model (Libert et al., 2020) based on (Davis, 1989).
PU refers to the extent to which individuals believe that using a system will enhance their work performance (Horodyski, 2023a). The intrinsic value of new systems lies in their capacity to facilitate the achievement of goals or the attainment of rewards with the most efficiency and the least time investment (Davis et al., 1992; van Esch et al., 2018; Webster & Martocchio, 1992). PEoU (Davis, 1989) postulates that individuals who recognise the potential utility of a system may be discouraged from using it if they believe the system is too complex such that the effort required outweighs the performance benefits. PEoU is “the extent to which a person believes that using a particular system would be free of effort” (Davis, 1989, p. 320). This notion derives from the broader definition of ease, meaning “freedom from difficulty or great effort” (p. 320). Given that effort is a limited resource, individuals must allocate their efforts across various tasks and responsibilities; consequently, systems that minimise effort are more appealing for adoption (Davis, 1989; Radner & Rothschild, 1975). When all other factors are equal, users are more likely to accept a system they perceive as easier to use (Davis, 1989). Davis (1989) has provided insights that, compounded with subsequent research, highlight the multifaceted nature of these motivations and their significant impact on technology adoption.
The UTAUT integrates several constructs derived from established and well-documented theories of technology acceptance (Menant et al., 2021). Alam et al. (2020) noted frequent employment of the UTAUT in research owing to its unified approach, which combines variables from eight theories including the TAM (Davis, 1989), social cognitive theory (Compeau & Higgins, 1995), innovation diffusion theory (Moore & Benbasat, 1996), the model of personal computer utilisation (Thompson et al., 1991), the decomposed TPB (Taylor & Todd, 1995), the TPB (Ajzen, 2011), the theory of reasoned action (Fishbein & Ajzen, 1975), and the motivational model (Davis et al., 1989). The UTAUT was developed based on an empirical comparison of those eight theories and entailed the use of longitudinal data from four companies to identify conceptual and empirical parallels (Venkatesh et al., 2003). The UTAUT framework differentiates between behavioural intention (i.e., intent to use technology) and real usage behaviour and asserts that behavioural intention directly influences technology adoption. Its four primary determinants or predictors of technology use are performance expectancy (PE), effort expectancy (EE), social influence (SI), and facilitating conditions (FCs). PE, EE, and SI directly affect behavioural intention, and FCs directly influence usage behaviour (Heikkilä & Smale, 2011).
Venkatesh et al. (2003) have identified PE as the strongest predictor of intent to use a new technology. PE derives primarily from PU in the TAM (Davis, 1989) and from outcome expectations (Compeau & Higgins, 1995). PE is the extent to which people believe that the use of a new technology will increase their work efficiency. A new system will be used if it increases work effectiveness, saves time on routine tasks, improves output quality, and increases output quantity with the same input effort. In the UTAUT, EE is the second key factor that influences the acceptance of new technologies. EE describes the degree of ease associated with the use of new technologies. SI indicates the extent to which a person believes that others presume they should use a new technology. Venkatesh et al. (2003, p. 541) have defined SI as ‘the individual’s behaviour influenced by how they believe others will view them as a result of having used the technology.’ FCs refer to the scope to which a person believes that the organisational and technical infrastructure is available to support the use of a new technology (Attuquayefio & Addo, 2014; Venkatesh et al., 2003).
Additionally, Venkatesh et al. (2003) have recognised the following four direct determinants as important variables in the UTAUT: gender, age, experience, and voluntariness of use. These factors are essential to the model because they influence individual intent to adopt new information technologies and ultimately influence the use of new technologies (Bano et al., 2019). Fig. 2 illustrates the relationships and key concepts in the UTAUT framework.
.")
Graphical scheme of the unified theory of acceptance and use of technology model (Venkatesh et al., 2003).
The VAM (Kim et al., 2007) is an alternative model for studying new technologies. Its relevance lies in the failure of the most commonly used models, such as the TAM (Davis, 1989) and UTAUT (Venkatesh et al., 2003), to consider the cost–benefit perspective when attempting to explain intent to use and adopt new ICTs. The authors of the VAM intended to achieve parsimony by considering a limited number of factors that explain most of the variance in adoption intention. Traditional technology acceptance models (e.g., TAM and UTAUT) assume that users of new technologies do not have to pay for technology use because they are either customers or employees whose technology adoption costs are covered by their employers or the technology providers (Kim et al., 2007). This approach aimed to facilitate the prediction of ICT adoption simply and straightforwardly. To evaluate intent to adopt a new technology, the VAM retains the main characteristics (i.e., usefulness, enjoyment, and system PE) of existing technology acceptance theories, with the addition of costs, which are defined as perceived monetary sacrifices (Kim et al., 2007). The authors of the VAM have defined technicality as PEoU, system reliability, connectivity, and efficiency (specifically, short loading and response times). The VAM has proven that benefits (i.e., usefulness and enjoyment) and sacrifices (i.e., technicality and perceived costs) determine the perceived value (PV) of a new technology, which directly explains intent to adopt that technology, as shown in Fig. 3.
.")
Overview of the value-based adoption model of technology (Kim et al., 2007).
In the VAM framework, PV is defined with reference to Zeithaml (1988), whose widely accepted definition states that overall consumer perception of the benefits of a product is determined by their perception of what they receive in relation to what they give. Hence, PV in the VAM is the overall consumer perception of ICTs based on the ratio of benefits to sacrifices required for the acquisition or use of the technology (Kim et al., 2007). PV, as determined by the result of a benefit–sacrifice comparison, indicates willingness to adopt a new technology. In other words, intent to adopt is determined by PV, which results from weighing benefits and costs or disadvantages.
The concept of PV is an essential component of technology adoption and is critical for predicting customer behaviour. It provides a lens for assessing trade-offs between benefits and disadvantages and is a key determinant of ICT adoption. Sohn and Kwon (2020) identified the VAM as the best suited for modelling user acceptance of highly innovative technologies such as AI-based products. The VAM has also been used to explain the adoption of Internet protocol television (Lin et al., 2012), mobile payments (Mallat, 2007), and the Internet of Things (Kim et al., 2017).
The VAM assumes that the adoption of a new system is influenced by its PV, which is determined by perceptions of the usefulness, enjoyment, costs, and technicality of the system. In the context of the VAM, the concept of usefulness is highly relevant to PV and to the intent to adopt a new technology. The concept of PU is widely used in information systems and technology research, and empirical evidence has shown that it is an essential predictor of technology adoption (Kim et al., 2007). The VAM adopts Davis’ construct of PU and assumes that the PU of a new system plays a critical role in determining the PV of that system, which, in turn, influences intent to adopt it.
The VAM also identifies enjoyment of use as a key factor that influences user intention to adopt a new technology. Kim et al. (2007) found that individuals who experience immediate pleasure when using a new system and enjoy all activities related to the instrumental value of the technology are more likely to adopt the technology and use it more intensively than others. Davis et al. (1992) found that, in contrast to PU, perceived enjoyment refers to the extent to which the use of a new system is perceived as enjoyable, regardless of expected performance. Kim et al. (2007) have argued that enjoyment and fun significantly impact technology adoption, going beyond usefulness.
Kim et al. (2007) have proposed that technicality is determined by three characteristics. The first, user PEoU, derives from the TAM (Davis et al., 1989). The second, system reliability, refers to whether the system is error-free, consistently available, and secure. The third is two-pronged: connectivity concerns whether the connection is instantaneous and straightforward, and efficiency refers to the duration of the loading and response times, with a preference for speed (Kim et al., 2007). Kim et al. (2007) have also proposed that users who lack experience with new technologies cannot judge whether associated costs are high or low. Adaptation-level theory postulates that users lack perfect price information but possess internal reference prices that they use for price comparisons (Della Bitta et al., 1981). Hence, students may compare the costs of AI tools with those of other technologies. Table 1 lists the key characteristics of the TAM, UTAUT, and VAM.
Summary of key characteristics of technology acceptance models.
| Model | Key constructs | Main focus | Strengths | Limitations |
|---|---|---|---|---|
| Technology acceptance model (Davis, 1989) | Perceived usefulness, perceived ease of use | Explains user acceptance of technology based on perceived benefits and ease of use | One of the most widely used theories to explain individual acceptance of intelligent products (Sohn & Kwon, 2020) | Limited consideration of external factors and social influences |
| Unified theory of acceptance and use of technology(Venkatesh et al., 2003) | Performance expectancy, effort expectancy, social influence, facilitating conditions | Predicts technology adoption by integrating multiple technology acceptance theories | Comprehensive model that includes social and organisational factors | Its complexity requires detailed data collection and validation. |
| Value-based adoption model(Kim et al., 2007) | Perceived value, perceived benefits (usefulness and enjoyment) and sacrifices (technicality and perceived costs) | Approaches the adoption of new technologies by focusing on user perception of value versus sacrifice | By emphasising both benefits and sacrifices, this model prioritises user experience and the subjective perception of value in technology adoption. | Less widely tested than the other two models |
These three models were adopted as a starting point because of their established position in technology acceptance research and their complementary approaches to explaining user intentions. The TAM focuses on cognitive evaluations of usability and ease of use, whereas the UTAUT considers social, organisational, and contextual influences, and the VAM broadens the analysis to include perceived value and costs. For this reason, the VAM is particularly useful in the study of new technologies, including commercial AI tools. Despite the strengths of these models, all three focus mainly on functional and cognitive dimensions while neglecting the normative and ethical aspects of the human–technology relationship.
Given these limitations, this study introduces responsibility as an external predictor, thus rendering possible the inclusion of the normative dimension of the human–technology relationship. This approach does not entail modifying the structure of the models through mediation or moderation; rather, they are extended via an independent explanatory variable that reflects social expectations of transparency, justice, and control over technology. The introduction of this component not only increases the accuracy of explanations of AI acceptance but also broadens the research paradigm by adding an axiological dimension, which has thus far been marginalised in classical approaches to technological adoption.
Research gapThe literature review identified key knowledge gaps in the context of student acceptance of AI technologies. Although existing technology acceptance models such as the TAM, UTAUT, and VAM have been widely used in various research contexts, they have not been studied with specific reference to the perception and acceptance of AI by university students. The existing research has focused on the general user population or on occupational groups and thus may not reflect the unique factors that influence younger generations who grew up in the digital age.
University students are an important social group to study because they are typically early adopters of new technology. Additionally, they are the professionals of the future. Their preferences can guide regulations that balance innovation with risk mitigation. Furthermore, their age and education level make them open and willing to use technological innovations and prime them to have extensive knowledge of the subject. In the future, they will hold managerial positions in various spheres of life including the social and economic sectors and state administration (Zdun, 2016).
The literature lacks research on integrating and testing additional predictors such as ethical awareness, the impact of technology on privacy, personal experiences with AI, and the perception of risks associated with AI technology, all of which may be crucial to understanding the process of AI acceptance among students. Addressing these gaps can lead to a better understanding of how younger generations perceive AI technology and the factors that influence their decision to adopt new technological tools.
Research questionsThis study aimed to benchmark the effectiveness of different theoretical models of how students in the United Kingdom and Poland perceive and accept AI technologies. The analysis sought to determine which model best explains student perceptions and acceptance of AI technologies and identify additional predictors that could improve understanding of the acceptance process of new technologies.
The following research questions were formulated based on the literature review, identified knowledge gaps, and the purpose of the study, with the aim of deepening understanding of the process of acceptance of AI technology among students in the United Kingdom and Poland.
- a)
Which technology acceptance model (i.e., TAM, UTAUT, or VAM) best explains student perception and acceptance of AI technologies?
- b)
Could other predictors not included in these models affect student acceptance of AI?
To investigate which of the models (i.e., TAM, UTAUT, or VAM) best explains the frequency of student use of AI tools, a detailed research procedure was carried out. First, quantitative social research was designed and conducted as part of a broader project titled Attitudes of Students in the United Kingdom and Poland Towards AI. This study, executed between December 2023 and January 2024, used a proprietary research tool, namely a questionnaire on student attitudes towards AI that considered behavioural (i.e., behaviour towards the object of attitude), cognitive (i.e., views and knowledge about the object of attitude), and affective (i.e., emotions towards the object of attitude) components (Rosenberg & Hovland, 1960).
All study participants provided informed consent. Participation in this study was anonymous and voluntary. The survey was administered using the CAWI technique, which facilitated easier, more flexible access to a broad group of respondents, improved respondent anonymity, and increased participants’ sense of privacy. This resulted in more honest and precise answers, particularly regarding sensitive issues (Feng & Huang, 2024).
Data collection and participantsA cross-sectional survey was administered in Poland. Respondent-driven sampling, a method “designed to generate estimates that are representative of the wider population of interest, despite biased sampling” (White et al., 2012, p. 397), was used (Kozak & Fel, 2024b; Phukan & Hazarika, 2024; Sadlon, 2022). The Savanta Research Panel (n > 150,000 university students) was used in the United Kingdom (Brainard et al., 2023). To ensure representativeness, panel respondents were recruited in the United Kingdom using the Universities and Colleges Admissions Service database (Neves & Sephenson, 2023). To ensure a representative sample of respondents from Poland, limits were set based on the ISCED-F 2013 classification of fields of study, published by the Central Statistical Office in June 2023 (GUS, 2023). Students sampled from the United Kingdom (n = 1010) and Poland (n = 1088) were surveyed for quantitative sociological research purposes between December 2023 and January 2024. The data were analysed using SPSS version 29.
Students were selected as the primary focus because of the specific characteristics of this social group. Table 2 presents the social and demographic characteristics of the sample. The average age of the students was 22.85 years (standard deviation = 7.7).
Sociodemographic characteristics.
Source: Compiled by authors based on own calculations.
One of the attitudinal dimensions studied was the behavioural component, which was measured using a specific subset of questions (Z01.1–7). An example question is “How often do you use specific tools using AI technology during the week?” This question aimed to elicit the frequency of use (measured on a 5-point scale ranging from 1 = Never to 5 = Very frequently) of the following AI tools:
- •
Voice assistants (Siri, Google Assistant, Alexa)
- •
Recommendation systems (movie suggestions on Netflix, music suggestions on Spotify)
- •
Automatic translators (Google Translate)
- •
GPT (Generative Pre-trained Transformer) tools (for editing text)
- •
AI algorithms in photo editing apps (automatic photo enhancement)
- •
DALL-E (or similar) tools for generating unique images based on text descriptions
- •
API (Application Programming Interface) technologies (or similar) to allow AI to integrate with various platforms and applications
The overall scores (i.e., the sum of points) of the Z01total indicator for AI tool use ranged from 7 to 35. The higher the score, the greater the AI tool use frequency. Analysis of the research tool showed that the Cronbach’s α coefficient for a subset of theorems was satisfactory with a value of 0.817.
ResultsMultiple regression analysis was performed to determine which model (TAM, UTAUT, or VAM) best explains AI tool use frequency among students. At the first stage of the analysis, linear regression was performed using only the demographic variables to assess their impact on AI use frequency among students. Next, variables corresponding to the constructs of the TAM, UTAUT, and VAM, respectively, were added to the models to determine the extent to which these theoretical models explain students' frequent use of AI tools. The block stepwise regression method was used to introduce variables into the regression model.
The regression analysis (in all analysed blocks) assumptions were investigated as follows. Regarding linearity, the scatterplots showed no apparent signs of nonlinearity, leading to the assumption of a linear relationship between the variables. Analysis of the normality of residuals through analysis of histograms and probability plot graphs confirmed that the residuals were distributed near normal. The homoscedasticity assumption was also maintained, indicating constant variance of residuals at different levels of the predicted values. The variance inflation factor values for collinearity were within the safe range, indicating no strong collinearity between the independent variables. The Durbin-Watson statistic showed no autocorrelation of residuals, which further confirmed the independence of the errors in the models. The basic assumptions of the regression model were met, allowing the models to be considered statistically reliable.
To confirm the adequacy of the approach used, analyses were also carried out using partial least squares structural equation modeling (PLS-SEM). The obtained coefficients of determination (R²) were lower in all three models than in the regression analyses, confirming the greater predictive accuracy of classical linear regression in the context of the research objective. These results are consistent with those reported in the literature, including the recommendations of Rönkkö et al. (2023, p. 1601), who have proposed that PLS-SEM may be suboptimal in analyses aimed at maximising predictive accuracy (R²). PLS-SEM is often used in studies with small samples because its advantages disappear when large samples are used. Rigdon et al. (2017, p. 10) have advised that “in the absence of a large study sample, researchers evaluating their results for predictive validity will achieve as good or better results by simply summing the indices into equal-weighted composites.” Those scholars have also stated that “with large samples, equal-weighted composites outperform index-weighting methods such as PLS-SEM in terms of loading and consistency” (Rigdon et al., 2017, p. 10). Consequently, this study selected stepwise regression as a more appropriate analytical approach for identifying significant predictors of AI acceptance.
Block 0Linear regression analysis showed higher AI use frequency among students in the United Kingdom than among those in Poland. Additionally, males were more likely to use AI than females. Other demographic variables such as education level (at the time of the study), size of place of origin, English language skills, family financial situation, academic performance, and year of study did not significantly affect AI use frequency (Table 3).
Results of multiple regression analysis of the AI use frequency outcome variable in the model.
Note. lic – licentiate, MSc – Master of Science, PL – Poland, SE – standard error, UK – United Kingdom, VIF – variance inflation factor.
Source: Compiled by authors based on own calculations.
To examine AI acceptance in the context of student use of AI, variables corresponding to the key constructs of the TAM were added to the demographic model. The main constructs of this model are PEoU (i.e., how easy and intuitive it is to use the technology), which corresponds to advantages of AI: friendly and intuitive, and PU (i.e., how technology increases user performance regarding completing tasks), which corresponds to advantages of AI: understanding and interpretation of texts and 24/7 accessibility. These three variables were added to the model to further investigate how PEoU and PU of AI affect the frequency of student use.
Regression analysis showed that AI use frequency increased with PEoU and PU. Students in the United Kingdom used AI more often than students in Poland. However, observations of the increased use of AI tools should reflect the around-the-clock availability of AI (Table 4).
Results of multiple regression analysis for the AI use frequency outcome variable in the model*.
Note. Only statistically significant predictors are listed. PL – Poland, SE – standard error, TAM – technology acceptance model, UK – United Kingdom, VIF – variance inflation factor.
Source: Compiled by authors based on own calculations.
The UTAUT is also often used to explain the acceptance and use of new technologies. The primary constructs of this model are PE, the belief that technology will increase the efficiency of task performance; EE or expected ease of use, which is, the belief that the technology is easy to use; SI, the degree to which other people influence individual decisions to use technology; and FCs, perceived accessibility of infrastructure supporting the use of the technology.
To measure AI use frequency among students, the following variables were added to the demographic model: advantages of AI: friendly and intuitive, which corresponds to EE; Hopes for AI: increased quality and accessibility of education, which is related to PE; social influence: AI usage control, which directly corresponds to SI; and AI technology should be free for all, which corresponds to FCs. Regression analysis showed increased AI use frequency with higher EE, PE, and SI (Table 5).
Results of multiple regression analysis for the AI use frequency outcome variable in the model*.
Note. Only statistically significant predictors are listed. SE – standard error, UTAUT – unified theory of acceptance and use of technology, VIF – variance inflation factor.
Source: Compiled by authors based on own calculations.
As previously mentioned, the VAM has been used to explain the acceptance and use of new technologies through constructs such as PV, perceived enjoyment, PU, technicality, and perceived costs. To determine AI use frequency among students, this study added to the VAM the following variables that correspond to its constructs, with the aim of deepening understanding of user motivations. The variables AI uptake benefit: employers, economy, and education and AI uptake benefit: public safety are related to PV. The variables advantages of AI: accuracy of responses, understanding and interpreting texts, and 24/7 availability correspond to PU and are represented as PUpro. The variables of emotions of trust and joy towards AI directly correspond to perceived enjoyment. The variable entrusting professional duties implies technical knowledge and thus corresponds to technicality. The variable having to pay for AI corresponds to perceived costs. Since AI use saves time that would have been spent engaged in work, it generates more time for leisure and entertainment.
AI use frequency increased with PU and perceived enjoyment of AI technology as well as with the technical literacy of users and their belief that AI uptake will benefit public safety. The perceived costs of AI use and the belief that AI uptake will benefit employers and the economy emerged as related to reduced use of AI tools (Table 6).
Results of multiple regression analysis for the AI use frequency outcome variable in the model*.
Note. Only statistically significant predictors are listed. SE – standard error, VAM – value-based adoption model, VIF – variance inflation factor.
Source: Compiled by authors based on own calculations.
The coefficient of determination (R²) values obtained for the TAM, UTAUT, and VAM were relatively low in the context of explaining AI use among students. This prompted a search for additional variables (i.e., predictors) that could increase the explanatory capacity of the models. Further analysis using the research tool highlighted responsibility for AI use as a variable with high explanatory potential.
Respondents were asked to imagine a situation in which an autonomous AI-operated car caused an accident. They were invited to assess who they thought was responsible for the incident. The concept of responsibility was presented perceptually via the attribution of blame or causation for the negative outcome of an action taken by a system. The presentation of the scenario was followed by the question “Who do you think is responsible for causing the accident?” Responses were given on a 5-point Likert scale (ranging from 1 = Strongly disagree to 5 = Strongly agree). Separate responses were recorded for four categories: owner/rental company, passengers, car engineers, and AI programmers. The separate evaluation of each entity on the 5-point Likert scale enabled the creation of four distinct corresponding variables: legal, moral, engineering, and algorithmic (system development) responsibility, respectively.
These variables were not combined into a single scale but were rather treated as independent predictors within an exploratory, scenario-based approach. Multi-item scales were not developed because their construction would have been unnatural given the scenario-based nature of the study and arbitrary given the strongly distinct categories of agency and responsibility (McManus & Rutchick, 2019). The use of individual items in the operationalisation of the construct was considered sufficient given the unambiguity of the categories and the high contextual accuracy, with justification found in the methodological literature (Bergkvist & Rossiter, 2007).
Although the literature indicates the existence of various types of responsibility, including institutional and collective responsibility, this study focused on the four dimensions of legal, moral, engineering, and algorithmic responsibility. This choice was based on the potential significance of these dimensions to individual perceptions of new technologies and the operability of the dimensions in a scenario focused on the agency and effects of AI systems. Unlike institutional responsibility, which is more structural and diffuse (Hughes et al., 2024; Miller, 2017, 2024), the selected categories facilitated the capture of specific, recognisable points of reference around which user intuitions about blame, control, and justice could form. Moreover, these forms of responsibility seem particularly relevant in the context of questions about trust, transparency, and risk, although such relationships require further theoretical and empirical exploration (Braga et al., 2025; Chaudhary, 2024; Díaz-Rodríguez et al., 2023).
The selection of the four types of responsibility was also based on their high operational transparency in the scenario method used and their direct link to individual perceptions of responsibility. Other forms, such as institutional or collective responsibility, would require a broader contextual framework and different methodological approaches to achieve meaningful incorporation into technology acceptance models.
The selected dimensions of responsibility also facilitated a direct, operational grasp of key reference points for individual assessments of AI system users (McManus & Rutchick, 2019). Institutional, collective, and cultural responsibility, on the other hand, face significant cognitive and pragmatic limitations that complicate the assignment of agency, blame, and control regarding new technologies. In practice, institutional and collective responsibility often lead to the blurring of responsibility or to the diffusion of accountability among many actors, which weakens the individual sense of agency and makes assigning blame or causation difficult (Beyer et al., 2017). In the context of technology, where trust, transparency, and risk perception are crucial, the chosen dimensions allow for the analysis of how users perceive and evaluate the effects of system actions. Hence, the operationalisations adopted in this study can be seen as a step towards identifying and organising the key components of responsibility for integration into technology acceptance models.
In accordance with the conceptual validation approach (Covell & Sidani, 2013), correlation analysis was performed between the variables. The results (r = −0.090 to r = 0.393) confirmed that these indicators measure related but distinguishable aspects of assigning responsibility, which justifies their independent use in predictive analyses.
Including these variables in the TAM, UTAUT, and VAM resulted in a significant increase in the R² value for each model, indicating the importance of responsibility variables as predictors. Thus, in a broad context, including ethical and legal issues appears to be essential to more accurately understand factors affecting AI acceptance and use among students.
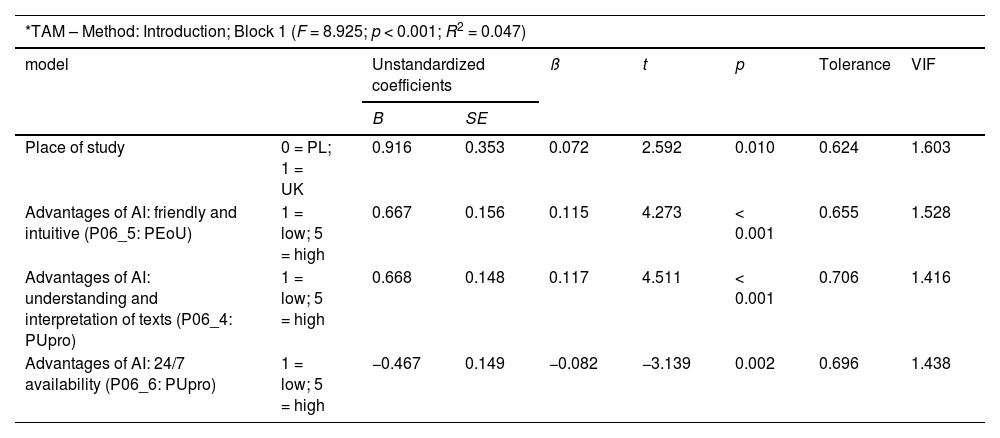
With the addition of another block of variables, regression analysis of the TAM showed that AI use frequency increased with PEoU, PU, expectations of legal responsibility of AI tool owners, moral responsibility of AI users, and responsibility of AI developers for algorithmic decisions. However, AI use frequency decreased with higher education levels. The variable advantages of AI: 24/7 availability were not reflected in the increased use of AI tools (Table 7).
Results of multiple regression analysis for the AI use frequency outcome variable in the model*.
Note. Only statistically significant predictors are listed. lic = licentiate, MSc = Master of Science, SE – standard error, TAM – technology acceptance model, VIF – variance inflation factor.
Source: Compiled by authors based on own calculations.
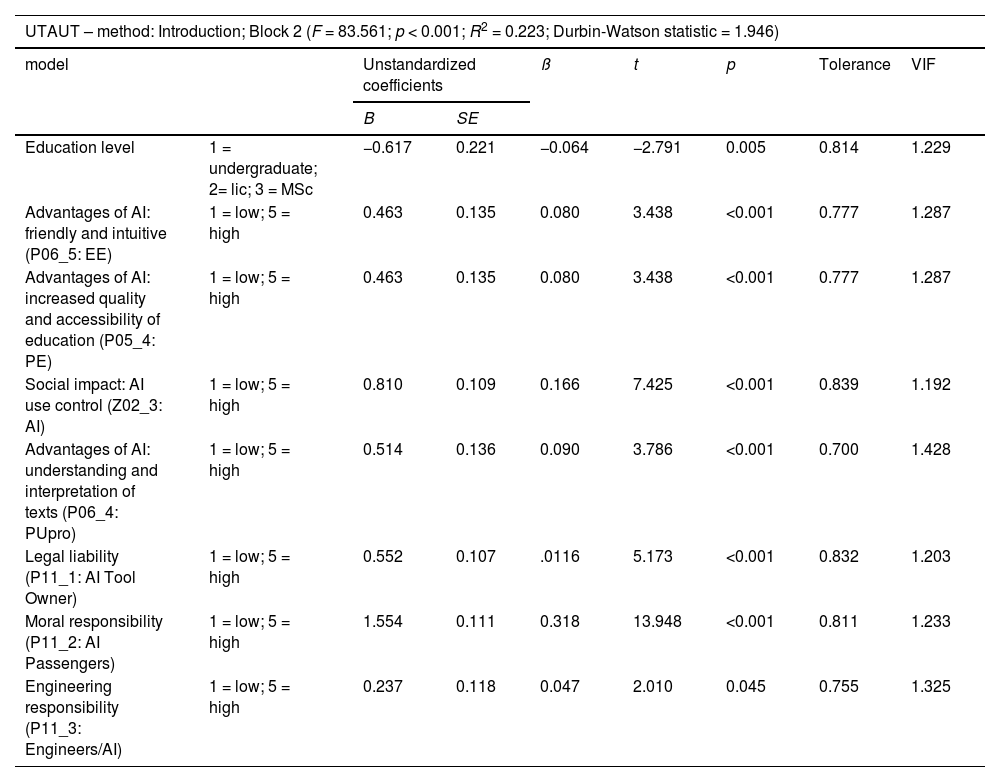
Regarding the UTAUT model, regression analysis showed that AI use frequency increased with PEoU, PE, social impact, PU, and expectations of legal responsibility of AI tool owners, moral responsibility of AI tool users, and responsibility of AI tools. However, AI use frequency decreased with higher education levels (Table 8).
Results of multiple regression analysis for the AI use frequency outcome variable in the model*.
Note. Only statistically significant predictors are listed. lic – licentiate, MSc – Master of Science, SE – standard error, UTAUT – unified theory of acceptance and use of technology, VIF – variance inflation factor.
Source: Compiled by authors based on own calculations.
Regarding the VAM, regression analysis showed that AI use frequency increased with the PV and PU of AI as well as with AI technical literacy, AI enjoyment, and expectations of the attribution of legal, moral, and algorithmic responsibility for AI tools. However, AI use frequency decreased with higher education levels and higher perceived costs (Table 9).
Results of multiple regression analysis for the AI use frequency outcome variable in the model*.
Note. Only statistically significant predictors are listed. lic – licentiate, MSc – Master of Science, SE – standard error, VAM – value-based adoption model, VIF – variance inflation factor.
Source: Compiled by authors based on own calculations.
This study sought to identify which of the TAM, UTAUT, and VAM best explains AI acceptance among students and to determine whether additional predictors can significantly improve the explanatory power of the models. The coefficients of determination (R²) for all three models in Block 1 were relatively low (TAM = 4.7 %, UTAUT = 8.3 %, VAM =11.2 %), indicating that key aspects affecting AI acceptance and use may have been overlooked in the original model configurations. This implication suggests the need to search for additional predictor variables.
The low R² values obtained for the three models also suggest that the limited ability of the models to explain user behaviour may be due to an excessive focus on instrumental and rational reasons for technology use, such as PU or PEoU. However, social (Kozak & Fel, 2024a), normative (Haupt & Marks, 2023; Tasioulas, 2022; Tasioulas & Green, 2023) and emotional (Fel & Kozak, 2025) factors are becoming increasingly important in AI-based technologies. Particularly among younger users who were raised in a digital society, aspects such as trust (Korzyński et al., 2024), transparency of system operation (Fazriati et al., 2025) and a newly discovered sense of personal responsibility, as well as the importance of attributing responsibility to technology creators, may play important roles. The low R² values indicate not only the need to consider new predictors but also the necessity of rethinking and updating the existing theoretical models to better reflect the complexity of technology acceptance processes.
The TAM had the lowest explanatory power, which may indicate its limited ability to capture the full complexity of attitudes towards technologies that are, like AI, characterised by a high degree of autonomy, a lack of operational transparency, and a strong normative and emotional charge. Although the TAM remains a valuable reference point for research on technology acceptance, its classic components, which focus mainly on rational assessments of PU and PEoU, may not fully reflect user expectations of modern, complex systems. The use of the TAM in this study facilitated not only a comparison of its effectiveness with newer approaches but also the identification of areas requiring additional predictors.
The low R² values obtained for the conventional models indicate several limitations. First, these models rely on a limited number of core constructs (e.g., PU, PEoU, PE, technicality, and perceived cost). Although parsimonious, this simplicity may ignore other important psychological, social, and normative variables. Failure to consider normative factors can affect the ability to explain acceptance behaviour towards new technologies. Importantly, this study was not limited to one type of AI. The scenario question used, concerning liability for an accident caused by an autonomous vehicle, referred to AI systems generally, allowing for interpretation in the context of both traditional and generative technologies.
Second, the limited usefulness of the studied models in analysing the acceptance of new technologies even with the inclusion of a clear normative dimension underscores the need to introduce additional predictors. Models such as the TAM and the UTAUT were developed for consumer technologies and are thus dominated by instrumental motives including PU and PEoU (Davis et al., 2024). However, AI-based technologies generate not only cognitive but also social, ethical, and cultural responses that are often not considered in classical models (Armoutı et al., 2023). Normative influences, such as cultural values and ethical beliefs, may be associated with technology acceptance indicators (Alsaleh, 2024); therefore, their omission may result in an underestimation of the motivations of potential users. In other words, the concept of acceptance that underlies traditional models does not fully reflect the diverse conditions of technology adoption in social contexts, thereby limiting the predictive accuracy of the models (Salovaara & Tamminen, 2009). Supplementing these models with a normative dimension that considers the complexity of the relationship between AI-based technology and social values will be more effective than modifying classic models with retention of their original assumptions.
Although some predictors exerted small effects in this study, their statistical significance indicates the presence of a subtle influence on perceptions of AI among university students. In large-sample studies such as this one, even very small effects become statistically significant because standard errors decrease with a larger number of observations, thereby increasing the power of statistical tests. Moreover, when researching attitudes towards complex technologies such as AI, small effects can have long-term effects, or they may be indicators of processes that are beginning to gain popular importance.
Through a detailed analysis of the various variables in the available data set, this study found that variables related to the responsibility of using AI proved crucial for increasing the precision of the regression models. The introduction of AI liability variables significantly improved the explainability of each of the studied models, suggesting that responsibility is an important element of user adoption and acceptance of AI technologies. Notably, the VAM achieved the highest determination rate of 25.6 %, which indicates the higher effectiveness of this model at accounting for the impact of liability on AI use. The UTAUT model also showed good results, with a determination rate of 22.3 %; however, the TAM, despite showing significant improvement, presented the lowest score, with 20.7 %.
These results correlate with those of Sohn and Kwon (2020), who also identified the VAM as the most effective in explaining AI acceptance, with a focus on factors such as enjoyment and subjective norms. However, these elements, although linked to the emotional aspects of perceptions of new technologies, are a fragment of a broader context in which considering responsibility seems to be important (Cheong, 2024). A clearly defined framework of responsibility for the actions of AI systems can significantly influence user decisions to adopt new technologies because users want to be sure that systems are not only efficient but also safe and fair (de Almeida et al., 2021; Díaz-Rodríguez et al., 2023; Shneiderman, 2020).
In the context of responsibility for AI use, significant differences in approaches are evident in the analysed technology acceptance models. The research results indicate that moral responsibility significantly impacts technology acceptance in all three models, which suggests that users have a key role as stakeholders in the responsible use of AI (TAM: ß = 0.337, p < 0.001; UTAUT: ß = 0.318, p < 0.001; VAM: ß = 0.313, p < 0.001). Legal responsibility also influences the acceptance process, although to a lesser extent than does moral responsibility (TAM: ß = 0.123, p < 0.001; UTAUT: ß = 0.116, p < 0.001; VAM: ß= 0.116, p < 0.001).
In the TAM and VAM, programming (algorithmic) responsibility also plays a role in the perception of new technologies. In the TAM, the responsibility of AI developers emerged as significant but exerted a relatively small impact on technology acceptance (ß = 0.045; p = 0.047). In the VAM, which focuses on user values and emotions, developer responsibility emerged as more relevant (ß = 0.062; p = 0.005). The UTAUT model, which emphasises social and organisational influences, is distinguished by its emphasis on engineering responsibility (ß = 0.047; p = 0.045). This result highlights a statistically significant but non-dominant impact of engineering responsibility on technology use in the UTAUT model. Although the beta values are low, their relevance lies not in their predictive power but rather in their identification of previously overlooked factors that may play an important role in specific contexts or user groups.
Unlike the TAM and the UTAUT, the VAM focuses not only on PU and PEoU but also on hedonistic value, which can be decisive regarding the often decadent AI technologies continuously entering the market (Lin et al., 2012). The ability of the VAM to capture the emotional aspects of technology use may explain its superior efficiency compared to the TAM and the UTAUT, which focus more on the rational and practical aspects of technology adoption (Horodyski, 2023b). However, the hedonistic aspect of the VAM is not at odds with responsibility. A clear framework of responsibility for AI use not only increases user trust but also fosters satisfaction with new technologies (Shin, 2021). Users who experience positive emotions related to technology use are more likely to accept and rely on systems that clearly define the rules of responsibility for possible errors or failures (Gursoy et al., 2019). In other words, the introduction of responsibility into models of acceptance of new technologies allows for more precise explanations of the process of perceiving AI technology use.
When comparing the TAM, VAM, and UTAUT, the differences in their approaches to algorithmic and engineering responsibility can be attributed to their differing basic theoretical assumptions and goals. The TAM focuses on individual perceptions of usability and ease of use as the main drivers of technology acceptance. In the context of algorithmic responsibility, the TAM examines how the perception of the direct functions and characteristics of technology (e.g., programming) affects the user. Developer influence is important but is seen as one of many factors that influence perceptions of technology. This explains the lower beta values.
The VAM, with its focus on values and emotions, expands this perspective by considering how values and trust affect acceptance of technology. Programmers, with directly responsible for creating algorithms, have a greater impact on perceptions of the security and effectiveness of technology, which are crucial for building trust.
The UTAUT takes a broader view of the social and organisational context in which technology is implemented and used. In this model, engineering responsibility perhaps reflects the role of engineers in ensuring that AI systems are not only effectively programmed but also properly integrated. Therefore, the UTAUT emphasises a broader scope of technical responsibility in alignment with the emphasis the model places on the social and organisational aspects of technology.
The results of this study clearly indicate the need to include responsibility when modeling perceptions of new technologies. Statistical analysis has shown that responsibility for AI use plays an important role in AI acceptance and application both societally and among students specifically. First, responsibility is important because of the perceived risks associated with new technology. Students and other users want to know who is responsible for potential malfunctions of AI technology (Burrell, 2016; Guidotti et al., 2018). Clarity about responsibility increases the sense of security and trust in technology, whereas the inability to explain why mistakes are made and how conclusions with significant consequences are drawn creates challenges and undermines trust in AI systems (von Eschenbach, 2021).
As new technologies have developed, modern society is called the risk society (Beck, 2009), has stressed the need to establish clear rules of responsibility for innovations (Owen et al., 2013). This approach focuses on responsibility as a key element that can reduce the negative effects of man-made risk in the late modern era (Giddens, 2023; Keen, 2023). Transparency about responsibility is fundamental to allow users to trust new technologies and feel safe using them (Felzmann et al., 2019). The development of new technologies that eliminate temporal and spatial barriers significantly affects the way individuals experience reality (Hutton & Giddens, 2012). Such technological transformation can lead to considerable changes in sociocultural structures, thus affecting how communities adopt and interpret a new reality enriched with new technological possibilities. This process may result in the reinterpretation of everyday interactions and decision-making processes, which, in turn, may affect the formation of new social co-responsibilities (Bauman, 1998). Understanding these transformations can be crucial for successfully integrating AI technologies and other innovations into modern society and ensuring that they are adopted in harmony with societal values and norms.
Although this study did not formally test the moderating role of cultural factors, culture may moderate how responsibility is understood and attributed in the context of AI use. Different societies have different expectations about who should be responsible for the actions of AI systems. This stems from, among other things, historical patterns of trust, dominant welfare state regimes, and types of corporate governance shaped by historically dominant cultures in some societies (Saveliev & Zhurenkov, 2021; Vallor & Ganesh, 2023). Furthermore, cultural dimensions such as power distance, uncertainty avoidance, and individualism significantly influence attitudes towards technological responsibility. For example, societies with high power distance and a strong need for social control exhibit greater scepticism towards AI and higher expectations of institutional responsibility (Chalutz-Ben Gal & Alessandro, 2025; Sui et al., 2024; Wang, 2025). In turn, differences in ethical decision-making for example, between Anglo-Saxon and continental European societies, influence the intensity of risk perception and the preferred forms of oversight (Glavaničová & Pascucci, 2022; Rausch et al., 2014). The role of culture as a moderator of the relationship between responsibility and AI acceptance is therefore a promising field for further comparative research. This is particularly important because emerging responsibility gaps resulting from the distributed nature of technology development may be perceived and addressed differently depending on the social and institutional context. Addressing these cultural moderating factors is beyond the scope of this study, but they represent a valuable direction for future empirical research.
ConclusionsThe research results for the TAM, UTAUT, and VAM confirm that clarity of responsibility significantly affects societal willingness to use new technologies. This finding has theoretical and practical implications.
Theoretical implicationsFrom a theoretical perspective, this study may inspire the gradual inclusion of the category of responsibility into existing models of technology acceptance. Integrating liability may entail the development of research tools that consider different dimensions of responsibility (i.e., moral, legal, technical, and algorithmic) and the design of AI systems that transparently communicate the extent of responsibility for system actions. Equally important is strengthening the responsible use of AI in education theory and incorporating related issues into regulatory policies. This approach can contribute to the more conscious and responsible development of technology in line with social expectations.
This study improves understanding of factors related to the perception of AI technology and can thus be an important complement to the current approach, which focuses mainly on usability, ease of use, and the balance of the costs and benefits of AI technology. The inclusion of responsibility in the analysed technology acceptance models significantly improved their predictive power. To the authors’ knowledge, responsibility has not previously been extensively researched or included in the literature on the subject.
In response to this gap, the study introduces the responsibility variable as an external (exogenous) predictor (Li et al., 2023) rather than as a moderator or mediator. This aims to extend the classical theoretical framework by incorporating a component that represents social expectations of transparency, fairness, and technological control. As empirical analyses have shown, this variable significantly increases the explanatory power of technology acceptance models, thus confirming its relevance and importance in the context of AI acceptance.
Responsibility is treated as an exogenous predictor in this study, but this does not exclude the possibility that it could act as a mediator or moderator in other models. In the VAM, responsibility can shape how users evaluate the usefulness of technology. It thus shapes the social acceptance of technology. This is because responsibility is linked to the overall value perception of an innovation, mediating between value evaluations and adoption intentions (Yen & Hsu, 2015). For example, corporate social responsibility activities can enhance the perceived utility of a technology by aligning with user values and building their trust and loyalty towards the provider (Fel et al., 2019; Nguyen et al., 2025). Additionally, perceived social responsibility can modify social influence by shaping behavioural norms and positive attitudes towards innovations (Bohns et al., 2018). Thus, although the current model focuses on the role of responsibility as an external predictor, future research can explore alternative approaches in which responsibility is treated as an intermediate (mediating) or moderating variable. This will yield a more complete understanding of the complex social mechanisms underlying AI acceptance.
The use of single-item, scenario-based measures to assess moral and legal responsibility in this study was driven by the need to balance content validity with the length constraints of the research tool and the exploratory nature of the study. Despite concerns that single-item measures may not fully capture the complexity of constructs such as responsibility (Rossiter, 2016), research has shown that they can achieve validity and reliability comparable to multi-item scales under some circumstances, particularly if the single-item measures are well embedded in a realistic scenario context (Chin et al., 2008). Furthermore, single-item tools have the advantage of reducing completion time, thereby minimising respondent fatigue and improving data quality in large samples (Buchner et al., 2024). Nevertheless, full replicability and further generalisation of the results will require the use of more complex multidimensional scales that will allow for a more accurate examination of the differences between types of responsibility and their interaction with other variables (Ammenwerth, 2019). The use of single-item measures in the present research should be considered a reasonable compromise at the exploratory stage. This study paves the way for more in-depth analyses at subsequent research stages.
In addition to theoretical contributions, this study enriches the existing literature and helps to fill the research gap regarding perceptions of responsibility for AI.
Practical implicationsThe results obtained indicate that the category of responsibility can be used by key stakeholders to increase acceptance of AI technologies. First, AI developers can design systems that clearly communicate principles of responsibility and provide algorithmic transparency. This can be achieved via interfaces that provide information about who is responsible for the decisions algorithms make.
Second, educators can incorporate the topic of responsibility into their curricula to develop students’ ethical awareness and encourage a critical approach to technology.
Third, policymakers can formulate regulations that formalise the principles of legal and technical responsibility. Such regulations would increase user trust in implemented solutions. Furthermore, such actions would strengthen users’ sense of control and security. As the analytical results obtained in this study have shown, these foster a greater willingness to adopt AI technologies.
In conclusion, the acceptance of AI depends not only on its functionality but also on how the technology fits into the framework of socially acceptable responsibility. Hence, incorporating responsibility can significantly impact the future development and use of AI technology.
Limitations and future researchThis study has several limitations that create opportunities for further research. First, the results were obtained using specific TAM, UTAUT, and VAM variables. This limits generalisability to other factors that may affect student perceptions of AI. Unexplored factors may include the maturity of AI technology and ethical and legal issues. Additionally, although the TAM, UTAUT, and VAM provide valuable analytical frameworks, they may not cover the full spectrum of factors influencing the perception and acceptance of AI. Incorporating experimental designs or mixed-methods approaches could help establish causal relationships between specific factors (e.g., AI training programmes and exposure to AI ethics) and AI acceptance to provide a deeper understanding of the underlying mechanisms.
Second, this research focused on specific AI applications deemed relevant to students. This focus may have overlooked other AI applications that could influence AI acceptance, such as AI in broader societal contexts (e.g., health care, finance, and industry). Future research could investigate student acceptance of a wider array of AI applications, including those outside the student context. Such an exploration would aid in understanding how different uses of AI influence overall perception and acceptance.
Third, longitudinal research would provide insights into how student acceptance of AI evolves over time, particularly as students gain more exposure to AI technologies in academic and non-academic settings.
Fourth, this study did not fully account for contextual factors such as institutional support, access to AI resources, and previous exposure to AI technologies, all of which can significantly impact student acceptance of AI. The study did not differentiate based on nationality and the associated cultural context, which may also provide scope for further research.
Most importantly, the present study highlights the need to expand research on the role of responsibility in AI acceptance models. Future studies should investigate how different aspects of responsibility affect the acceptance and adoption of new technologies in various contexts and communities.
Statement of the institutional ethics committeeThe study was conducted in accordance with the Declaration of Helsinki and approved by the Committee on Research Ethics in the Humanities and Social Sciences (HSSREC) protocol code 12/2023 (approval date: 2023-11-02).
Declaration of informed consentInformed consent was obtained from all study participants.
Data accessibility statementRaw data supporting the conclusions of this study will be made available by the authors upon request.
CRediT authorship contribution statementStanisław Fel: Writing – review & editing, Writing – original draft, Validation, Supervision, Project administration, Investigation, Conceptualization. Jarosław Kozak: Writing – original draft, Resources, Methodology, Data curation, Conceptualization. Piotr Horodyski: Writing – review & editing, Writing – original draft, Validation, Methodology, Conceptualization.
The authors declare no conflict of interest.
We sincerely thank the editor and anonymous reviewers for their insightful comments and valuable suggestions, which significantly improved the quality of this manuscript.