


Generative artificial intelligence (GAI) is rapidly transforming the marketing industry with its capabilities in data analysis, personalisation, strategic optimisation, and content generation, providing powerful tools for businesses aiming to establish or maintain a strong brand position. This research examines the application of Large Language Models (LLMs) for market research, enabling marketers to create insights that capture the complexities of market behaviour and customer psychology, helping them to connect with their target audiences more meaningfully and effectively. Particularly, it aims to evaluate the extent to which GAI can replicate traditional market research. We conducted a comprehensive survey on beer consumption in Spain, covering all conversion funnel stages, from Brand Awareness to Purchase. The study was replicated using four prominent LLMs: ChatGPT (OpenAI), Gemini (Google), Claude (Anthropic) and LlaMa (Meta), and the results of these LLMs were compared with those of the traditional survey using a collection of statistical methods. Our results show that LLMs are valuable for market research, offering significant insights as reliable proxies. This represents a competitive advantage by making studies of this kind more accessible and cost-effective, benefitting companies of all sizes. However, LLMs cannot fully replicate traditional methods and present result variability, introducing risks in decision-making because of potential errors in data generation that are complex to estimate without benchmarking.
Artificial intelligence (AI) is rapidly transforming the marketing landscape, providing powerful tools for companies to consolidate and maintain a strong brand position. One of the most important contributors to this transformation is the rise of Generative AI (GAI), a subset of machine learning that uses algorithms to create new data, such as text, images, and code, based on existing data, driven by advanced Large Language Models (LLMs) (Kshetri et al., 2023). This technology promises unprecedented scale and speed in gaining market insights. For example, LLMs can process and analyse millions of online reviews in real time to identify emerging consumer preferences, which would take human analysts weeks or months (Cano-Marín, 2024; Yenduri et al., 2024).
The global LLM market is experiencing significant growth. Projections show that it will increase from USD 6.4 billion in 2024 to USD 36.1 billion in 2030, at an impressive compound annual growth rate of 33.2 % (MarketsandMarkets, 2024). This growth is in response to the increasing demand for advanced natural language processing capabilities in various industries, including marketing and consumer research (Pagani & Wind, 2024). This article focuses on the latter and explores how LLMs are revolutionising brand positioning by enabling marketers to connect meaningfully and effectively with their audiences. It discusses the application of LLMs in competitive market analysis and compares their capabilities to traditional research methods.
For marketers, particularly those in small and medium-sized enterprises (SMEs), LLMs offer an unprecedented opportunity to conduct sophisticated market research and customer segmentation without the traditionally high costs associated with large-scale surveys or focus groups (González-Padilla et al., 2025; Zhu & Zhang, 2023). Regarding the automation of tasks such as data collection, analysis or message personalisation, LLMs reduce overhead and execution times, enabling marketing strategies to be deployed more quickly and at scale. Moreover, as these models can process and synthesise vast amounts of unstructured consumer data in real time, they allow for a faster adaptation to market trends and audience preferences, levelling the playing field between SMEs and large corporations (Dwivedi, 2025).
AI is a set of programmes, algorithms, systems, and machines that exhibit aspects of human intelligence, enabling marketers to leverage vast volumes of consumer data (Arora et al., 2024; Park & Ahn, 2024). This dataset includes everything from sentiment analysis on social networks (Nicolescu & Rîpă, 2024; Rostamzadeh et al., 2024; Zhou et al., 2023) to shopping behaviour (Hermann & Puntoni, 2024; Peres et al., 2023) and online behaviour (J. S. Park et al., 2022; Saura & Ruizxiskiene, 2025), generating actionable information that facilitates precise personalisation (Campbell et al., 2023; Prados-Castillo et al., 2024; Tafesse & Wien, 2024), and creating highly segmented messages across multiple channels (Cillo & Rubera, 2024; Kumar et al., 2024; Lee et al., 2024).
Emerging literature suggests that the most effective approach is a hybrid model, where GAI complements and enhances traditional methods rather than replacing them entirely (Chiarello et al., 2024; Estevez et al., 2024; Grewal et al., 2024a, 2024b; Park & Ahn, 2024). The main advantages of this integration include cost reduction by automating tasks such as data collection, transcription, and analysis, the ability to process massive volumes of information more quickly and accurately, and the creation of personalised messages tailored to specific market segments, thus optimising marketing strategies (Brand et al., 2024; Goretti et al., 2024; Li et al., 2024).
This article contributes to the debate on the future of market research in the age of AI by examining the extent to which LLMs can complement or replace traditional methods in assessing brand perception and consumer psychology. It addresses key issues such as identifying brand personality traits, mirroring consumer survey responses, generating persuasive personalised messages, using synthetic data, collaborating on market research, and conducting perceptual analysis (Atari et al., 2023; Matz et al., 2024; Wach et al., 2023).
However, current LLMs face significant challenges in replicating the dynamic decision-making processes characteristic of human behaviour in competitive environments. Recent experimental studies have shown that LLMs cannot achieve market equilibrium in simulated scenarios, underscoring the need for additional advances to fully capture the complexities of market behaviour and consumer psychology (Bolukbasi et al., 2016; Brown et al., 2020; Cao & Kosinski, 2024; Demszky et al., 2020; Pagani & Wind, 2024).
Our research compares leading LLMs to traditional market research (TMR) methods, aiming to provide a comprehensive view of AI's potential and limitations in marketing. By exploring the synergies between AI-driven approaches and conventional methods, we seek to contribute to developing more effective and efficient marketing strategies in a constantly evolving digital environment.
This transformation in marketing, driven by GAI and LLMs, demands a reassessment of traditional methodologies and a re-evaluation of how brands understand and engage consumers. In this context, our study contributes to the debate on the future of market research by empirically examining the role of LLMs as both a complement and a potential substitute for traditional survey methods (Juárez-Madrid & Monreal, 2024). The rest of the article is structured as follows. Section 2 presents the review of the literature and theoretical framework. Section 3 describes the data collection, study design, and execution. Section 4 details the empirical analysis stage, including descriptions of the statistical methods used and the presentation of the results along with their explanations. Section 5 summarises the conclusions of this research and offers proposals for future research.
Theoretical frameworkThe advent of GAI has sparked growing interest in its application to market research, promising unprecedented scale and speed in obtaining insights (Kshetri, 2023). This ability to analyse vast data sets and generate real-time knowledge offers companies a potential competitive advantage. However, it is imperative to recognise the inherent limitations of GAI. The quality and potential bias of training data directly influence the accuracy and reliability of the responses generated, with the risk of producing inaccurate or even misleading information (Abumalloh et al., 2024; Campbell et al., 2023; Eloundou et al., 2023; Pagani & Wind, 2024).
Emerging literature suggests that the most effective strategy is a hybrid approach, where GAI complements and enhances traditional methods rather than replacing them entirely (Noy & Zhang, 2023; Peres et al., 2023). Among the most prominent advantages of GAI in this context are 1) cost reduction by automating tasks such as data collection, transcription, and analysis, generating significant savings in time and resources (Noy & Zhang, 2023), 2) scalability, enabling a faster and more accurate analysis of massive volumes of data compared to traditional methods and encompassing a wider range of sources such as social networks, product reviews, and online forums (Kshetri et al., 2024; Peres et al., 2023), and 3) personalisation, facilitating the creation of messages and content tailored to specific consumer segments, thus optimising marketing strategies based on the needs and preferences of the target audience (Hermann & Puntoni, 2024; Kumar et al., 2024; Lee et al., 2024; Wahid et al., 2023). This theoretical framework aims to explore in depth these advantages and limitations and emerging methodologies that combine GAI with traditional approaches to delineate the future of marketing research in the era of AI.
LLMsLLMs are a subcategory of foundational AI models that have emerged as a disruptive technology because of their ability to process and generate natural language text (Brown et al., 2020; Devlin, 2018). A language model (LM) is a probabilistic representation of a language, which estimates the probability of occurrence of a given linguistic sequence, be it a word, phrase, or sentence, within that language.
LLMs, similar to conventional LMs, are trained using a self-supervised learning paradigm, where the goal is to predict a hidden word within a textual sequence (Mikolov, 2013). The term ‘large’ refers to the massive scale of data with which they are trained, often spanning multiple languages and heterogeneous textual corpora, as well as the sheer number of parameters that these models possess. Following Achiam et al. (2023) and Raffel et al. (2020), we define an LLM as a conditional probability distribution p(xn|x1, …, xn-1) over tokens, where each xi belongs to a finite V vocabulary. In their training, they use a mixture of datasets that include multilingual corpora such as Common Crawl, Wikipedia, and specialised domain data. To handle multiple languages, they incorporate tokenisers and embeddings designed for language-specific characteristics, ensuring semantic consistency across linguistic boundaries.
The base of the text generative process in an LLM is an iterative sampling of the learned distribution to select the next most likely token. At each iterative step, the model evaluates a probability distribution over the vocabulary V, which indicates the probability that each token is the following xi in the sequence, assuming that the model was reading a pre-existing text. Initiating this generative process requires an initial ‘conditioning’, that is, a set of input tokens x1, …, xn-1, known as a ‘prompt’.
The prompt acts as an initial context that influences the probability distribution over the vocabulary, favouring the selection of tokens semantically and syntactically consistent with the given context. For example, given the prompt ‘This is a review…’, the model would assign a higher probability to tokens such as ‘article’ or ‘book’ compared to tokens such as ‘bus’ or ‘mountain’. Using a distribution function, such as the softmax function, the model stochastically selects a token from a set of plausible candidates. The new token xi is incorporated into the sequence, resulting in a new iteration of the process.
Prominent examples of LLMs include models such as BERT (Bidirectional Encoder Representations from Transformers) (Devlin et al., 2018), T5 (Text-to-Text Transfer Transformer) (Raffel et al., 2020), and the GPT series, including ChatGPT-4 (OpenAI, 2023).
LLMs and human personalityThe intersection between LLMs and human personality is an emerging area of research with significant implications for understanding human behaviour and developing more sophisticated human–computer interaction systems. Although LLMs, as computational models, inherently lack personality, they have demonstrated the ability to capture and reflect human perceptions of third-party personality (Cao & Kosinski, 2024; Kirk & Givi, 2025; Lee et al., 2024). For instance, Kirk and Givi (2025) showed that GPT-4 could infer Big Five personality traits from social media bios with 80 % accuracy relative to human raters.
A key finding in this domain is the capacity of LLMs to predict perceived personality. Recent studies using models such as GPT-3 (Brown et al., 2020) indicate that word embeddings—vector representations that encode the semantic meaning of words—can predict the perceived personality of public figures with considerable accuracy. This predictive ability persists even after statistically controlling for variables such as likeability and demographic information, suggesting that LLMs can extract specific information related to personality traits from their training corpora (Park et al., 2022).
These word embeddings not only possess predictive value but also exhibit an internal structure that reflects personality perception (Cao & Kosinski, 2024). Moreover, the models generated by these LLMs demonstrate high face validity, with descriptive personality adjectives appearing at the extremes of the dimensions predicted by the model (Atari et al., 2023; Wach et al., 2023). This finding reinforces the notion that the internal semantic structure of LLMs captures relevant dimensions of human personality, which can be applied in contexts such as marketing (Lee et al., 2024; Zhou et al., 2023; Demzky et al., 2020).
These findings open the possibility of using LLMs for message personalisation (Lee et al., 2024). Having captured information about an individual's personality or archetype, an LLM could tailor a message's style, tone, and content to maximise its persuasive impact (Matz et al., 2024). As quoted earlier, this ability has implications in advertising, marketing, political communication, and the development of personalised virtual assistants, among others (Peres et al., 2023).
The approach to these capabilities should be cautious. LLMs learn from vast textual datasets; thus, there is a risk that they reproduce and amplify biases present in training data, including biases related to gender, race, or cultural stereotypes (Bolukbasi et al., 2016; Campbell et al., 2023). Therefore, rigorous validation of the accuracy, reliability, and fairness of personality predictions generated by LLMs is crucial before their implementation in real-world applications (Lee & Kim, 2024). In addition, using LLMs for message personalisation raises important ethical issues related to manipulation, privacy, and transparency (Lee & Kim, 2024). One approach to bias mitigation is ‘bias calibration prompts’, which aim to rebalance model outputs by enforcing fairness constraints. Others include fine-tuning curated, debiased datasets or employing post-processing filters (Zhou et al., 2023).
When LLMs infer personality traits, moral values, or ideological leanings to tailor content, there is a risk that personalisation can cross into psychological manipulation. For example, hyper-personalised political messages or persuasive ads targeting emotional vulnerabilities may exploit cognitive biases, nudging consumers toward decisions that do not align with their true preferences or interests (H. Wang & Lu, 2025). Such practices blur the line between persuasion and coercion, undermining consumer autonomy. Practitioners and platform designers should implement transparency measures, such as informing users when content is personalised, disclosing the use of inferred psychological profiles, and allowing opt-out options, to foster trust and ensure that personalisation respects individual agency and data ethics (Anthis et al., 2025; Yenduri et al., 2024).
LLMs and market researchTraditionally, brand perception studies have relied on consumer surveys to collect data on consumer opinions and preferences. However, the irruption of LLMs has opened new avenues for market research, offering alternative methods with the potential to increase the efficiency and scalability of these studies. In this context, two recent papers have explored the application of LLMs to brand perception analysis: Li et al. (2024) and Brand, Israeli and Ngwe (2023).
Li et al. (2024) propose an automated method for brand perception analysis based on response generation from carefully designed prompts. Their methodology relies on the ability of LLMs to complete sentences and generate coherent text within a given context. For example, they use prompts such as ‘Car Brand X is similar to Car Brand…’ to assess perceived similarity between car brands. The responses generated by the LLM are further processed using text analysis techniques to obtain similarity scores and construct perception maps that visualise the relationships between brands in a multidimensional space.
Brand, Israeli and Ngwe (2023) evaluate the usefulness of GPT for simulating human responses in marketing research studies, focussing specifically on estimating the willingness to pay (WTP) for different attributes of a product. To this end, they employ GPT to simulate responses to conjoint analysis questions, a common technique in marketing research to extract consumer preferences and quantify the relative importance of different product attributes (Green & Srinivasan, 1978). In this context, GPT has a choice scenario where it must select between two product configurations with different attributes and prices, simulating a consumer's decision-making process. From these simulated choices, WTP is estimated for each product attribute.
Both methodologies depend on strategically using prompts to obtain relevant information from the LLM. However, they differ in the type of data collected and the objective of the analysis. Li et al. (2024) focus on assessing brand similarity and attribute scoring, using prompts that induce the LLM to complete sentences related to perceived similarity or to identify the brand that best matches a specific attribute. In contrast, Brand, Israeli and Ngwe (2023) focus on estimating WTP, using conjoint analysis-type questions to simulate a choice scenario between different product configurations to infer underlying consumer preferences.
Both studies compare the results obtained from LLM with empirical data collected through consumer surveys to validate the effectiveness of their respective methodologies. Li et al. (2024) introduce a novel ‘triplet method’ to compare LLM-generated and human-generated perception data sets by assessing the agreement between similarity relationships and attribute scores obtained by both methods. In turn, Brand, Israeli and Ngwe (2023) compare WTP estimates obtained from GPT-simulated responses with estimates derived from the responses of human participants in traditional conjoint analysis studies.
Their results suggest that LLMs can be a valuable tool for market research, providing relevant information on consumer perceptions. However, there are inherent limitations to these models. Li et al. (2024) caution that the nature and scope of the training data limit the capability of LLMs, which may introduce biases in the results. Similarly, Brand, Israeli and Ngwe (2023) note that while GPT can simulate responses at the aggregate level, it may have difficulty capturing the heterogeneity inherent in individual consumer preferences.
Park et al. (2022) take a different approach, introducing ‘social simulations’ to prototype social computing systems. Although not directly focussed on consumer psychology, the proposal by Park et al. (2022) allows them to take advantage of their ability to simulate human interactions in digital environments. Applied to a product forum, for example, an LLM could generate realistic conversations between consumers with diverse profiles, allowing the analysis of the formation of perceptions, the dissemination of information, and the emergence of opinion leaders. This simulation would facilitate the identification of consumption patterns, the deep understanding of needs and desires, and the design and testing of marketing strategies, such as advertising campaigns or responses to reputational crises, before their actual implementation.
Our research question is as follows: To what extent can A) models, specifically LLMs, replace or complement TMR (Market Research) methods in the evaluation of brand perception and consumer psychology? Following Anthis et al. (2025), ‘complement’ here refers to the use of LLMs as auxiliary tools that support or enhance TMR methods, such as assisting in survey design, generating hypotheses, or simulating responses during exploratory phases, without displacing human respondents or analysts. By ‘replace’, we imply a full substitution of traditional methodologies with AI-generated data or analysis, treating LLMs as standalone research agents. To answer this question, we set the following three hypotheses:
Hypothesis 1 LLMs have the potential to complement and even replace human involvement in market research.
One of LLMs' promises is that they respond similarly to humans. Thus, they could replace or complement TMR methods (Kshetri, 2023, 2024). Previous studies support the general idea that LLMs have great potential in market research, both as a complement and a possible substitute for specific tasks. For instance, Singh, Kumar and Mehra (2023) validated GPT-3 responses against Nielsen panel data with 74 % alignment in attribute prioritisation. Our work complements studies to determine the validity and reliability of LLMs in different market research contexts and to establish best practises for their use (Hermann & Puntoni, 2024; Kshetri et al., 2024).
Thus, Arora et al. (2024) demonstrate the potential of LLMs as active collaborators in qualitative research. Their ‘human-IA hybrid’ model suggests that LLMs can assist in question generation, topic identification, and preliminary data analysis, optimising the researcher's role toward interpretation and insight generation tasks. This approach emphasises synergy rather than complete substitution.
Li et al. (2024) evidence the ability of LLMs to perform automated perceptual analysis with high concordance over traditional survey-based methods. Their work leans toward task-specific substitution, arguing for the efficiency and accuracy of LLMs in generating perceptual maps from brand and attribute similarity data.
Sarstedt et al. (2024) take a more cautious stance on substituting human participants for silicon samples generated by LLMs. While acknowledging the potential of LLMs to generate synthetic data, a review of the existing literature reveals mixed results compared to human data, especially in contexts that demand a deep understanding of cognition and emotions. They recommend an exploratory use in the preliminary phases of research.
Our first objective is to determine the extent to which traditional surveys can be made possible through GAI. Our work enriches the existing literature by comparing different LLM architectures, supporting the second hypothesis.
Hypothesis 2 LLMs can capture and reflect aspects of consumer psychology, including perceptions of brand personality, in a manner comparable to TMR methods.
This capability derives from their ability to process natural language, learn complex patterns from vast data sets, and infer psychological constructs from linguistic expressions, thus allowing them to emulate human perception of brands. One of these areas is the ability to identify brand personality traits. Using the self-verification theory, Park and Ahn (2024) show that GAI—in this case, ChatGPT—can identify luxury brand personality traits that align with consumers' self-concept. While traditional models exhibit greater explanatory power, AI-generated content demonstrates significant potential to reflect brand personality perceptions, encouraging brand identification.
Brand, Israeli and Ngwe (2023) demonstrate that LLMs (GPT-3.5 Turbo) can generate responses to market research surveys that reflect what consumers would give. Their study on WTP shows that estimates obtained from GPT responses are realistic and comparable to those from human studies, indicating the ability of LLMs to capture consumer preferences.
AI can also aid in direct consumer engagement by creating Personalised Persuasive Messages tailored to psychological profiles (personality traits, ideologies, moral underpinnings), which are more effective than non-personalised ones. LLMs can infer and use psychological constructs to influence consumer perception and behaviour (Campbell et al., 2023; Lee et al., 2024; Matz et al., 2024).
Generating Data from silicon samples with Limitations: Sarstedt et al. (2024) examine the use of LLMs to generate silicon samples. While acknowledging limitations in fully mimicking human behaviour and incredibly complex cognitive processes, they suggest that LLMs may be valuable in the early stages of research or for specific tasks, suggesting a potential for understanding aspects of consumer psychology with appropriate development.
Li et al. (2024) demonstrate that LLMs can generate human-like responses in brand perception surveys, enabling the creation of accurate perceptual maps and the exploration of consumer heterogeneity. They suggest that LLMs trained on vast data sets can overcome human limitations in understanding and utilising psychological constructs, tailoring messages to individual profiles with greater accuracy (Li et al., 2024).
LLMs detect psychological cues primarily through the linguistic analysis of adjectives, tone, syntactic structure, and contextual semantics within user-generated content. When exposed to text rich in evaluative language (e.g., ‘refreshing’, ‘pretentious’, ‘authentic’), models such as GPT-4 can infer dimensions of personality using pre-trained associations between linguistic features and psychological traits. Atari et al. (2023) and Cao and Kosinski (2024) demonstrate that LLMs can predict perceived personality traits of brands and individuals with surprising accuracy, even outperforming humans in some tasks of attribute matching. These capabilities allow LLMs to generate marketing messages tailored to personality archetypes, increasing persuasive effectiveness and engagement.
Hypothesis 3 The value of the results generated by LLMs in market research decreases as the level of concreteness of the questions asked increases because of the difficulty of LLMs to process and generate accurate and relevant information about specific products or brands compared to general or abstract information.
This hypothesis—a contribution to the literature—is based on inferences drawn from the existing literature on the capabilities and limitations of LLMs in market research-related contexts. Sarstedt et al. (2024) observe that GPT emphasises high-level abstraction and goal-oriented features to the detriment of low-level and means-oriented features, suggesting a remarkable aptitude of LLMs to handle general and abstract information, which would imply lower effectiveness in addressing product—or brand-specific details.
In parallel, Li et al. (2024) find that these models' contribution is limited in the initial stages that require specific market knowledge, such as defining the breadth of a category or selecting representative brands. Finally, Brand, Israeli and Ngwe (2023) warn about the possibility of LLMs generating erroneous conclusions when evaluating new or particular product characteristics. They illustrate with examples the difficulty of LLMs handling product-specific information reliably, which could compromise the usefulness that Hypothesis 5 proposes, that is, the diverse construction of GAI models can cause substantial variations in market research results. Researchers should be aware of such heterogeneity and carefully consider the choice of LLM when designing and executing market research studies. Comparing results between different LLMs and testing the robustness of the findings are essential steps to ensure the validity and generalisability of the conclusions (Costa & Di Pillo, 2024; Peng, 2023).
Sarstedt et al. (2024) investigate using LLMs to generate in silicon samples in market research and highlight that results vary considerably across domains and models used. The authors attribute this variability to differences in the operating principles of LLMs, including ways to customise and parameterise them. They also point to researchers' use of different versions of LLMs as another source of variability in the results.
Brand, Israeli, and Ngwe (2023) test the robustness of the results as a function of the LLM chosen. They replicated their study using several OpenAI, Meta, and Anthropic models. They found notable differences in responses, such as WTP ratings for the MacBook brand and screen size preference. Based on these findings, the authors argue that researchers should be aware of the sensitivity of the results to the choice of LLM. Li et al. (2024) suggest that the choice of language model may influence the results. Although the authors focus on two specific models (GPTNeo 2.7B and ChatGPT based on GPT4), they suggest their method can be adapted to any generative model. Szczesniewski et al. (2024) obtain similar results in a different setting, reinforcing the relevance of the analysis of the hypotheses.
LLMs show limitations in handling brands when analysing emergent or niche markets with limited digital presence. For example, Brand, Israeli and Ngwe (2023) use GPT-3.5 to estimate WTP for new product attributes in a tech accessories market. While the model accurately predicts preferences for widely known features (e.g., battery life or screen size), it does not yield consistent responses for a lesser-known brand. The model overestimated brand recognition and assigned implausibly high WTP values, likely because of a lack of training data for the brand in question.
Data collection, study design and executionThe research aims to determine to what extent TMR can be replicated by using GAI. For this purpose, we have designed and executed a real market research survey conducted by the professional service provider MásMétrica, focussing on the beer market industry in Spain. This survey provides a deep understanding of beer consumption habits in Spain, covering all the stages of the conversion funnel, from Awareness and Consideration of the Brand to Purchase and Consumption Experience. It also includes the evaluation of specific attributes most valued by the customer in relation to two specific well-known beer brands: Heineken and Corona. Then, we compare these results with the responses generated for the same questions by four of the most popular LLM models currently available in the market: ChatGPT from OpenAI, Gemini from Google, Claude from Anthropic, and LlaMa from Meta.
We have chosen the beer market for this research because it not only allows us to investigate customer behaviour in a well-defined, data-rich context but also serves as a compelling case to compare TMR methods with AI-driven approaches.
The beer market offers an ideal testing ground for comparing TMR with AI because of its complexity, data availability, practical relevance, and the opportunity to effectively address specific challenges that AI could solve (Nave et al., 2022). The beer market is mature, with a high concentration of players and intense competition, which generates a large amount of historical and current data helpful for training and evaluating AI models (Malone & Lusk, 2018; Ricciuto et al., 2006). Despite its maturity, the sector is constantly evolving because of factors such as the growing popularity of craft beers, consumer trends toward premium and non-alcoholic products, and innovation in flavours, formats, and production processes (Thomé et al., 2017). These conditions create a scenario for comparing traditional research and AI's adaptive and predictive capabilities.
Traditional market research survey (TMRS): study design, setting and distributionA cross-sectional survey was conducted by MásMétrica, a professional market research services provider. The objective is to provide a contemporary overview of consumer knowledge, opinions, perceptions, and preferences about beer consumption in Spain. The universe and population under study are people aged 18 to 75 years, residing in Spain at the time of the survey.
In the present study, a sample of 1003 individuals aged 18 to 75, belonging to a panel associated with MásMétrica, was selected intentionally and proportionally to the quotas of the Spanish population (according to the provisional INE Population Census as of 1 January 2024), based on sex, age group, and Autonomous Community (CCAA).
The questionnaire was self-administered via email through a link that was enabled from 24 to 26 July 2024. The final sample size (n) is 1003, with a maximum sampling error of ±3.1 % at a 95 % confidence level, assuming P = Q = 50 % (maximum variability). Sample size and level of precision are standard for national surveys conducted by national statistical institutions.
Survey designThe survey comprised 24 items, 9 focusing on demographics and 15 on consumer knowledge, opinions, perceptions, and preferences regarding beer consumption. The questions were based on previous studies’ validated questionnaires on beer consumption (Malone & Lusk, 2018; Vrontis, 1998; Wang et al., 2023). Descriptive statistics of the demographic characteristics of the sample in the TMRS are provided in Tables A1-A9 in Annexe A. To ensure a concise yet comprehensive analysis, we strategically selected six key questions that cover all stages of the conversion funnel (Fig. 1) (Colicev et al., 2019). These questions are crucial for assessing customer behaviour from awareness to experience and were chosen for their established relevance and significant contribution to understanding the dynamics of beer consumption, as established in previous research (Vrontis, 1998; Malone & Lusk, 2018), without compromising the depth and validity of the insights.
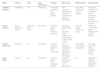
LLMs used to simulate Market Research: Case Study on Beers in Spain.
Compiled in-house, based on the following sources: (Anil et al., 2023; Bai et al., 2022; OpenAI, 2023; Touvron et al., 2023).
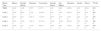
Comparison of each LLM with the TMRS: Chi-Square Test Results and Similarity Metrics for three key attributes of the Corona Brand.
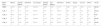
Comparison of each LLM with the TMRS: Chi-Square Test Results and Similarity Metrics for three key attributes of the Heineken Brand.

In parallel, the same survey was conducted using four of the most prominent LLMs models available on the market: ChatGPT by OpenAI, Gemini by Google, Claude by Anthropic, and LlaMa by Meta (Table 1).
To conduct our LLM market research, we developed a methodological roadmap to ensure the robustness of the research process (Fig. 2). We asked the LLM models to perform as market researchers and prompted them with the questions from the original market research questionnaire. This step was crucial to directly compare LLMs' responses with those of the TMRS. We then requested the models to identify the sources used to generate their responses, to ensure transparency and traceability of the generated data. For models without internet access, we required them to rely on their pre-trained databases, simulating a real-world scenario. Additionally, for multiple-choice questions, we ensured the model could accurately recognise and respond to these question formats by instructing it to correct its response when necessary. This methodological roadmap ensures that LLM-generated responses are rigorously produced and are comparable with those from TMRS.

In this research, we employ widely recognised LLM models currently available in the market (Table 1). However, to preserve scientific rigour and ensure neutrality, specific model names will be anonymised throughout the article, as the objective is not to compare commercial performance but to provide unbiased insights.
Empirical analysis and resultsThis section introduces the empirical analysis and results. First, it presents a description of the statistical methods used to compare AI-based survey responses with those from our TMRS, specifically within the beer market in Spain. Second, the results are explained through the comparison of frequency distributions, the testing of hypotheses regarding their equality, and measuring the degree of similarity across various beer consumption questions to assess how closely the responses generated by each LLM method match those obtained through the TMRS. Finally, a summary of the findings is presented.
Statistical methodsThis research focuses on six questions from the market research survey, which include both single-response and multiple-response formats corresponding to different stages of the conversion funnel that customers—in this case, beer customers—experience.
The selected statistical tests and measures are appropriate for analysing survey questions with these specifications, enabling a methodological comparison of categorical distributions from complementary perspectives: first, hypothesis testing for the simultaneous comparison of the five distributions, including the TMRS and the responses from multiple LLMs and second, two additional metrics for one-to-one comparisons between the TMR responses and each individual LLM-generated response.
This methodological approach is grounded in the theoretical assumption that LLMs can act as proxies for human judgment in customer behaviour analysis and market research. Accordingly, the statistical techniques selected aim to validate this premise by comparing the structure and consistency of the LLMs-generated responses with those from TMRS.
Hypothesis testing of distribution equality across multiple populationsThe chi-square distribution test of homogeneity of proportions is suitable for working with categorical single-response questions. The aim is to test the null hypothesis that no difference exists in the proportion of responses in a set of mutually exclusive categories between two or more populations (Garson & Moser, 1995).
Where Oij are the observed frequencies, and Eij are the expected frequencies under the null hypothesis. F represents the number of populations (market research methods’ responses), and C denotes the number of mutually exclusive categories for each question. We first use this test to compare the six distributions simultaneously and later to perform four one-to-one tests comparing each LLM-generated response with the TMR results for each question. In the case of categorical multiple-response questions, the same approaches are used, but the first-order Rao-Scott corrected chi-square is applied instead. Hence, the correction factor c^ minimises the impact of dependencies that may arise from multiple responses, where c^ is the ratio of expected variance under independence to the observed variance (Bilder & Loughin, 2001; Heo, 2006; Lavassani et al., 2009).Measuring distribution similarity between two populations

We use the Jensen-Shannon Distance (JSD) statistic to measure the similarity between the distributions of two populations—in this case, between each LLM and the TMRS. The goal is to determine to what extent any of the LLM-generated responses can replicate the distribution of those provided for the TMRS, as well as to facilitate the ranking of the AI models’ performance. This metric (JSD) is a symmetrised, smoothed version of the Küllback-Leibler divergence, which measures the relative difference between two probability distributions (Pinto et al., 2018; Sadrani et al., 2024).
Specifically, given two distributions P and Q, the divergence is defined as follows:
where M= 12(P+Q)is the mean distribution.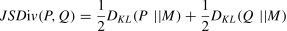
The JSD is obtained by taking the root of the Jensen-Shannon Divergence as follows:

This metric is highly robust for categorical distributions, including both single-response and multiple-response questions. Its value ranges from 0 to 1, where 0 represents identical distributions, and values close to 1 indicate significant differences between the distributions (Briët & Harremoës, 2009; Connor et al., 2013). Values below 0.1 indicate very high similarity, while those below 0.5 indicate sufficient similarity. Values above 0.5 indicate high dissimilarity (Blair et al., 2012; Spinner et al., 2021).
Measuring the average pointwise discrepancy between two populationsThe Mean Absolute Difference (MAD) is used to measure the similarity between two vectors. This statistic quantifies the average absolute error between two populations—in this case, the difference between the responses provided by each of the AI models and the TMRS. This metric is widely adopted for evaluating the accuracy of prediction models. If A=(a1,a2,….,an) and B=(b1,b2,….,bn) are vectors of size n (Song et al., 2003; Ye et al., 2024), the MAD is defined as follows:
Empirical analysis and results
In this section, we provide a descriptive statistical analysis comparing the relative frequency distribution between the TMRS and the responses generated by LLMs across different beer consumption questions (Annexe B). Additionally, we apply the statistical methods described in Section 4.1 to test equality hypotheses and measure the similarity between the responses obtained from the TMR and those generated by each LLM across all the different questions. Finally, a summary of the results and findings is presented.
Awareness stage in the conversion funnel: survey questions focused on user awareness and spontaneous brand recallAt the awareness stage of the conversion funnel, the research focuses on one question related to the first brand that comes to the customer’s mind when asked about beer brands.
Question 1: If we talk about beer brands, which beer brands do you know or come to mind?
The results of the TMRS show not only a high level of awareness of several brands but also market fragmentation, with high variability in the responses. This question has been processed as a single response using the first brand mentioned by the 1003 respondents. Mahou is the most frequently mentioned brand by beer consumers, with 24.53 % of the mentions, followed by Estrella Galicia with 13.86 % and Heineken with 10.57 %. Other brands mentioned include Cruzcampo (8.47 %), Estrella Damm (7.68 %), San Miguel (5.48 %), Alhambra (4.69 %), and Amstel (4.19 %). Notably, 20.54 % of the customers mentioned other brands. Annexe B: Table B1 shows the distribution of the relative frequency of responses regarding top-of-mind beer brands among customers, including a comparison with LLM-generated responses.
The chi-square test shows significant differences among the five response distributions (TMRS and four LLMs) with a value of 1541.06, degrees of freedom (df) = 32, and p-value = 3.59e-304, leading to the rejection of the null hypothesis of distribution equality.
Complementarily, four chi-square tests were performed to compare the response distributions of each LLM with the TMRS (Table 2). All the p-values were smaller than 0.01, leading to the rejection of all four null hypotheses. This means that none of the LLMs can fully replicate the response distribution of the TMRS regarding beer awareness and spontaneous brand recall, indicating significant differences.
Nevertheless, we observe differences in the performance of the LLMs. The model with the smallest chi-square value is LLM_4 (chi-square = 78.13), indicating its responses are the most aligned with those of the TMRS.
This finding is also supported by the JSD and the MAD metrics, indicating high similarity for the LLM_4 (JSD = 0.1415 and MAD = 32.33), lower than 0.2 and 50, respectively, suggesting that it can serve as a reliable proxy for estimating the beer awareness and spontaneous brand recall in Spain. The other LLMs show lower similarity to TMRS, with JSD higher than 0.2, but still below the cut-off of 0.5, and MAD values greater than 50.
Therefore, H1 is accepted, particularly for LLM_4, as its responses, although they cannot fully replicate those provided by the TMRS, can serve as a proxy and complement them. As this question corresponds to the awareness stage of the conversion funnel, the variability observed in brand recall responses may affect strategic decisions made by decision-makers regarding brand positioning, market share estimations, and top-of-mind visibility in the Spanish beer market. The closer alignment of LLM_4 with TMRS results suggests its potential as a complementary tool for identifying leading brands in consumers’ minds and detecting fragmentation in spontaneous recall patterns. This stronger alignment may be related to the specific characteristics of the model that showed the closest results to TMRS, as reported in Table 2. These findings may help inform the design and selection of models better suited for the awareness stage tasks in customer behaviour research.
Consideration stage in the conversion funnel: survey questions focused on factors influencing consumption decisions and perceived value of specific products and brand attributesAt the consideration stage of the conversion funnel, the research focuses on comparing specific attributes of two well-known beer brands, Heineken and Corona. Interviewees are asked to evaluate attributes such as price, flavour, and advertising in questions 2 and 3. These attributes were selected based on their examination in empirical studies and their identification as key drivers of brand evaluation, consumption, and purchase intention (Chen et al., 2005; Lerro & Nazzaro, 2020; Meyerding et al., 2019; Noel et al. 2018; Orth, 2006). The suitability of these attributes was also empirically supported by the results obtained in our TMRS as follows:
Question 2: Evaluate the following attributes of the Corona brand: (1) price; (2) flavour; (3) advertising.
Question 3: Evaluate the following attributes of the Heineken brand: (1) price; (2) flavour; (3) advertising.
The results of the TMRS show that the most significant factor influencing beer brand choice is flavour, with 82.3 % of the respondents citing it as their primary consideration. Price is the second most important factor, influencing 46.4 % of the consumers, followed by brand importance (40.2 %). Other factors include the availability at the place of consumption or purchase (35.7 %), recommendations from friends or family (13.0 %), and advertising, which influences 6.2 % of the respondents.
Heineken is a highly valued brand in terms of flavour and, particularly, in advertising, with a vast majority of the respondents rating these attributes as very good or good (77.18 % and 82.47 %, respectively) and only a few of them as very bad or bad (15.46 % and 7.88 %, respectively). Annexe B: Table B3 shows the distribution of the relative frequency of responses regarding the customers' perceived value of these attributes for the Heineken brand. In comparison, Corona gets slightly lower ratings, with most of the respondents rating the same attributes (flavour and advertising) as very good or good (74.42 % and 65.60 %, respectively) and only a few of them as very bad or bad (15.21 % and 16.76 %, respectively). Annexe B: Table B2 shows the distribution of the relative frequency of responses regarding the customers' perceived value of these attributes for the Corona brand.
Customers tend to be more critical when evaluating attributes such as price. Heineken receives a 67.63 % rating for good and very good, but simultaneously, 23.24 % of the customers assess it as bad or very bad. The same effect happens with Corona, as 56.56 % of the customers rate its price as very good or good, but 30.76 % assess it as very bad or bad.
Evaluating the attributes of the Corona brand
Three chi-square tests of the joint distribution of the TMRS and the four LLMs for each Corona brand attribute (Table 3) show significant differences across their distributions, with p-values below 0.01. This leads to the rejection of the null hypothesis of distribution equality for the three Corona brand attributes: price, flavour, and advertising.
Complementarily, four chi-square tests were performed for each of the three Corona attributes (price, flavour, and advertising) to compare the response distributions of the LLMs with the TMRS (Table 4). All the p-values were smaller than 0.01, leading to the rejection of the 12 null hypotheses. This means that none of the LLMs can fully replicate the response distributions of the TMRS regarding the evaluation of the key attributes of the Corona brand, indicating significant differences.
Nevertheless, we observe differences in the performance of the LLMs, with a clear pattern of superior performance across the three key attributes. Among them, LLM_3 stands out as the best performer, achieving the lowest chi-square values across all attributes (53.09, 37.20, and 84.88 for price, flavour, and advertising, respectively), indicating that its responses are the most closely aligned with those of the TMRS. LLM_2 follows as the second-best model for the attributes of flavour and advertising, with chi-square values of 81.66 and 146, respectively, while LLM_1 is the second-best for the price attribute, with chi-square values of 73.67.
This finding is also supported by the JSD and MAD metrics, indicating high similarity for LLM_3 with JSD values of 0.1227, 0.1017, and 0.156, all lower than 0.2, and MAD values of 35.20, 46.00, and 45.20, all lower than 50, for price, flavour, and advertising, respectively. These metrics suggest that LLM_3 responses can serve as a reliable proxy for estimating the customers’ perceptions about these three key attributes.
LLM_1 could serve as a less reliable proxy for the price attribute (JSD = 0.1449 and MAD = 52.40), and LLM_2 could serve the same role for the attributes of flavour and advertising (JSD values of 0.1510 and 0.206, and MAD values of 68.00 and 90.80).
Evaluating the attributes of the Heineken brand
Three chi-square tests of the joint distribution of TMRS and the four LLMs for each Corona brand attribute (Table 5) show significant differences across their distributions, with p-values below 0.01. This leads to the rejection of the null hypothesis of distribution equality for the three Heineken brand attributes: price, flavour, and advertising.
Complementarily, four chi-square tests were performed for each of the three Heineken attributes (price, flavour, and advertising) to compare the response distributions of the LLMs with the TMRS (Table 6). All the p-values were smaller than 0.01, leading to the rejection of the 12 null hypotheses. This means that none of the LLMs can fully replicate the response distributions of the TMRS regarding the evaluation of the key attributes of the Heineken brand, indicating significant differences.
Nevertheless, we observe differences in the performance of the LLMs, with performance varying by beer attribute. Among them, LLM_3 stands out as the best performer for two out of three attributes. It achieves the lowest chi-square values across the flavour and advertising attributes (10.88 and 54.58, respectively), indicating that its responses are the most closely aligned with those of the TMRS for these two attributes. LLM_1 stands out as the best performer for the price attribute, with a chi-square value of 61.80, followed by LLM_3 with 79.96. The second-best performing models for the attributes flavour and advertising are LLM_1 and LLM_4, with chi-square values of 38.97 and 150.32, respectively.
These findings are also supported by the JSD and the MAD metrics, indicating high similarity for LLM_3 in the beer attributes of flavour and advertising (JSD = 0.0532 and 0.1204, lower than 0.2, and MSD = 18.40 and 38.40, both lower than 100), while LLM_1 for the price attribute has JSD = 0.1295 and MAD = 38.40. LLM_1—the second-best performing model in terms of similarity for flavour—has JSD = 0.1020 and MAD = 38.80; for advertising, it is LLM_4, with metrics closer to the cut-off and with higher JSD = 0.20 and MAD = 90.80, but still below the acceptable thresholds of 0.5 and 100, respectively.
As a summary of the evaluation of attributes of the Corona and Heineken brands:
H1 is accepted, particularly for LLM_3, as its responses for all three product attributes of the Corona brand and the attributes of flavour and advertising in the Heineken brand, although they cannot fully replicate those provided by the TMRS, can serve as a proxy and complement to them. For the price attribute of Heineken, LLM_1 performed better, indicating that not all attributes are as well captured by a single model.
However, there is enough statistical evidence to accept H3, as LLMs can capture and reflect aspects of customer psychology—in this case, the tendency of customers of both Corona and Heineken to be more critical when evaluating attributes such as price—and the recognition of highly personal product preferences, such as flavour, as well as attitudes towards advertising (like or dislike).
These results also highlight the importance of combining several models to calibrate and reinforce the validity of some results when using LLMs to replicate TMRS.
Purchase stage in the conversion funnel: survey questions focussed on users’ brand consumption behaviourAt the purchase stage of the conversion funnel, the research focuses on one question related to the users’ habitual consumption behaviour.
Question 4: Which beer brands do you usually consume? Select all that apply.
(1) Mahou; (2) Estrella Galicia; (3) Heineken; (4) Cruzcampo; (5) Estrella Damm; (6) San Miguel; (7) Alhambra; (8) Amstel; (9) Águila; (10) Corona; (11) Others.
To analyse this question, consumers who stated that they did not drink beer were excluded, adjusting the sample size to 921 respondents. The customers are offered ten different brands of beer, along with the option to choose an additional ‘others’ category. This is a multiple-response question; thus, the sum of percentages exceeds 100 %.
The results of the TMRS show the presence of two highly popular brands, alongside significant market fragmentation, as reflected in the variability of responses. The most preferred brands are Estrella Galicia (49.84 %) and Mahou (42.35 %), followed by Heineken (30.62 %). The remaining brands are selected by <30 % of the respondents: Alhambra (27.14 %), San Miguel (25.41 %), Cruzcampo (23.45 %), and Estrella Damm (22.69 %). Finally, the less popular brands include Amstel (15.96 %), Águila (15.20 %), and Corona (15.20 %). Notably, 41.04 % of the respondents mentioned other brands, highlighting the diversity of preferences within the beer market. Annexe B: Table B4 shows the distribution of the relative frequency of responses regarding customers' brand consumption intention, including a comparison with LLM-generated responses.
The first-order Rao-Scott corrected chi-square test shows significant differences between the five response distributions (TMRS and four LLMs) with a value of 1468.35, degrees of freedom (df) = 40, and p-value 0.0, leading to the rejection of the null hypothesis of distribution equality.
Complementarily, four first-order Rao-Scott corrected chi-square tests were performed to compare the response distributions of each LLM with the TMRS (Table 7). All the p-values were smaller than 0.01, leading to the rejection of all four null hypotheses. This means that none of the LLMs can fully replicate the response distribution of the TMRS regarding users’ habitual beer brand consumption behaviour, indicating significant differences.
In this case, the LLMs show less variation compared to other survey questions. LLM_2 has the smallest first-order Rao-Scott corrected chi-square with 198.64. However, LLM_3 outperforms with the lowest JSD and the MAD metrics, with values of 0.2104 and 102.82, respectively. Although the JSD is higher than 0.2, it remains below the 0.5 threshold, indicating moderate alignment with the traditional survey responses. The MAD also exceeds 100.
Therefore, H1 is partially accepted, particularly for LLM_3, as its responses, although they cannot fully replicate those provided by the TMRS, demonstrate a low-moderate level of reliability and can cautiously serve as a proxy and a complementary source of insights. Additionally, H3 is accepted, as the precision of the LLMs in market research decreases when dealing with highly specific questions about future purchase intentions, brand or product positioning, and market share in relation to the industry landscape. This information is more difficult to find on the internet or in public sources used to train these models, and complexity increases with multi-response questions.
Experience stage in the conversion funnel: survey questions on user experience and general consumption habitsAt the experience stage of the conversion funnel, the research focuses on two questions related to general beer consumption habits, specifically the frequency and the places where it occurs.
Question 5: How frequently do you consume beer? The possible response options are as follows: (1) Daily; (2) At least once a week; (3) At least once a month; (4) Less frequently; (5) Never.
The results of the TMRS show that most respondents (48.90 %) consume beer at least once a week, 24.90 % daily, 10.50 % monthly, 7.60 % less frequently than monthly, and 8.20 % never. This question is a single response and has 1003 respondents. Annexe B: Table B5 shows the distribution of the relative frequency of responses regarding beer consumption frequency, including a comparison with the LLM-generated responses.
The chi-square test shows significant differences among the five (the TMRS and four LLMs) with a value of 377.68, degrees of freedom (df) = 16, and p-value 1.710e-70, leading to the rejection of the null hypothesis of distribution equality.
Complementarily, four chi-square tests were performed to compare the response distributions of each AI-based model with the TMRS (Table 8). All the p-values were smaller than 0.01, leading to the rejection of all four null hypotheses. That is, none of the LLMs can fully replicate the response distribution of the TMRS regarding the frequency of beer consumption, indicating significant differences.
Nevertheless, we observe differences in the performance of the LLMs. The models with the smallest chi-square values are LLM_3 (chi-square = 66.19) and LLM_4 (chi-square = 86.89), indicating that their responses are more aligned with those of the TMRS compared to the other LLMs.
This finding is also supported by the JSD and the MAD metrics, indicating high similarity for the LLM_3 (JSD = 0.1289 and MAD = 56.20) and LLM_4 (JSD = 0.1477 and MAD = 75.40). Both models have JSD values below 0.2 and MAD values below 100, suggesting they can serve as reliable proxies for estimating the frequency of beer consumption in Spain. In contrast, the other LLMs show lower similarity, with JSD values greater than 0.2 but still below the cut-off of 0.5, indicating moderate alignment with the traditional survey responses and much higher MAD values (greater than 100).
Therefore, H1 is accepted, particularly for LLMs 3 and 4, as their responses, although they cannot fully replicate those provided by the TMRS, can serve as a proxy and complement them.
Question 6: Where do you usually consume beer? Select all that apply. The possible responses are as follows: At home; (2) In bars or restaurants; (3) At parties or events; (4) Others.
To analyse this question, consumers who stated that they do not drink beer were excluded, resulting in a sample size of 921 respondents. This is a multiple-response question; thus, the sum of percentages exceeds 100 %. The results of the TMRS show that the majority of respondents consume beer in bars or restaurants (83.06 %), followed closely by consumption at home (77.2 %). A smaller proportion of participants reported consuming beer at parties or events (43.8 %), and only 0.98 % selected other places for beer consumption. Annexe B: Table B6 shows the distribution of the relative frequency of responses regarding places of beer consumption, including a comparison with the LLM-generated responses.
The first-order Rao-Scott corrected chi-square shows significant differences among the five response distributions (TMRS and four LLMs) with a value of 897.80, degrees of freedom (df) = 12, and p-value 0.0, leading to the rejection of the null hypothesis of distribution equality.
Complementary, the first four-order Rao-Scott corrected chi-square tests were performed to compare the response distributions of each LLM with the TMRS (Table 9). All the p-values were smaller than 0.01, leading to the rejection of all four null hypotheses. This means that none of the LLMs can fully replicate the response distribution of the TMRS regarding places of beer consumption, indicating significant differences.
Nevertheless, we observe differences in the performance of the AI-based models. LLM_2 and LLM_3 have the smallest first-order Rao-Scott corrected chi-square, 50.57 and 78.14, respectively, indicating that their responses are more aligned with those of the TMRS compared to other LLMs.
This finding is also supported by the JSD and the MAD metrics, indicating high similarity for the LLM_2 (JSD = 0.0904 and MAD = 77.50) and LLM_3 (JSD = 0.1088 and MAD = 56.00), both with JSD and MAD lower than 0.2 and 100, respectively. This suggests they can serve as reliable proxies for estimating beer consumption in Spain. In contrast, the other LLMs show lower similarity, with JSD values greater than 0.2 but still below the cut-off of 0.5, indicating moderate alignment with the traditional survey responses and much higher MAD values (greater than 100).
Therefore, H1 is accepted, particularly for LLMs 2 and 3, as their responses, although they cannot fully replicate those provided by the TMRS, can serve as a proxy and complement them.
Summary of results: comparison of JSD in LLMsBased on these results, Fig. 3 summarises the similarity of LLMs by question using JSD, which enables the comparison and ranking of the models’ performance. LLM_3 is the top performer in seven out of ten questions and ranks second in the remaining three, with an average JSD of 0.1412. This contrasts with the poorest performer, LLM_2, which has an average JSD of 0.2295 (62.6 % higher).

Through our analysis, we have found that although LLMs cannot fully replicate TMRS, as all the chi-square tests and first-order Rao-Scott corrected chi-square tests led to the rejection of the null hypotheses of equality of distributions compared to the TMRS; they serve as effective proxies for the response distribution. The JSD of all the LLMs was <0.5 for all the questions, and for all but one question, there was always at least one model with a JSD <0.2, which represents a high similarity to TMRS.
However, Fig. 3 also highlights differences in the performance of the models. LLM_3 has an average JSD of 0.1412, which is 36.69 %, 38.50 %, and 36.62 % lower than the averages for Models 1, 2, and 4, respectively. Additionally, the accuracy of the responses varies by both the model used and the type of question (Fig. 4), indicating that different models perform better or worse depending on the specific attributes being evaluated.

For example, JSD values range from a minimum of 0.0532 provided by LLM_3 in Question 3 for evaluating the attribute ‘Flavour of Heineken’, to 0.3541 (565 % higher) provided by LLM_1 in Question 2 for the evaluation of the attribute ‘Flavour of Corona’. This variability complicates understanding the errors made in the simulation when there is no real benchmark (TMRS) for comparison. Therefore, it is recommended to use several LLMs to corroborate and calibrate results.
These differences in the capabilities of the models to address different kinds of questions are summarised in Fig. 4. AI-based models are more effective at answering questions based on publicly available and observable data used to train them, such as consumption behaviours and product attributes, because of the abundance of information. This is evident in stages such as Consideration (Questions 2 and 3) and Experience (Questions 5 and 6) of the conversion funnel, which show very low average JSDs (0.1140 and 0.1097, respectively). However, they are less precise in predicting less documented aspects such as future purchase intentions or market share, apparent in stages such as Awareness (Question 1) and Purchase (Question 4), where higher JSDs (0.1415 and 0.2104 respectively) indicate that the lack of detailed data and the need to understand complex competitive and economic contexts increase the error compared to TMRS.
Theoretical contributions and implications for practiceNone of the LLMs evaluated fully replicates the response distributions obtained through the traditional survey. Statistically significant differences were detected in all the questions analysed, confirming that these models, in their current state, are not perfect substitutes for human participation. However, and here lies one of the main theoretical contributions, similarity analysis using the JSD demonstrates that these models act as reliable and valuable proxies. The responses generated by LLMs show high similarity to human data, with JSD values mostly below 0.2. This finding validates our first hypothesis: LLMs can effectively complement traditional methods, especially for companies (including SMEs) seeking to conduct market research in a more agile and cost-effective way.
We also confirmed the hypothesis that LLMs can capture and reflect complex aspects of consumer psychology. The models could identify perceptions about brand attributes such as taste and advertising, and even reflected consumers' tendency to be more critical of price. In addition, we provide empirical evidence for one of our novel hypotheses: the accuracy of LLMs decreases as the concreteness and specificity of the questions increase. The models are more effective at assessing conversion funnel stages such as Consideration and Experience, which rely on more observable and publicly available data, but show greater discrepancies at the Brand Awareness (Top of Mind) and Purchase stages, where information is less accessible and the competitive context is more complex.
The implications for professional practice are profound. The main recommendation is to adopt a hybrid approach, where GAI does not replace but augments and enhances the capabilities of the human researcher. LLMs are excellent tools for exploratory phases, hypothesis generation, or scenario simulation. However, the remarkable variability in performance among the different models, with LLM_3 being the most consistent in our analysis, underscores the critical need not to rely on a single tool. Practitioners must use multiple LLMs iteratively to corroborate and calibrate their findings, thereby mitigating the risk of errors in decision-making, especially when a benchmark such as a traditional survey is not available.
Limitations and future research directionsThere are several restrictions on this study. Our TMRS focuses on the beer market in Spain; data from other industries should be examined in future studies.
In addition to this, to ensure a concise yet comprehensive analysis, we strategically selected six key questions that cover all stages of the conversion funnel. We aim to expand this research by replicating the analysis for the nine remaining questions and also by conducting an in-depth analysis for specific subgroups of respondents according to distinct customer segments.
ConclusionsAI—in particular, GAI—is evolving rapidly, and companies are eager to adopt it in various fields, especially in marketing, where it can provide a significant competitive advantage in an increasingly dynamic market. Our study contributes to the theoretical and empirical understanding of how GAI can reshape the foundations of market research and its implications for decision-making in companies.
Thus, we compare the capabilities of the four most popular LLMs available on the market (ChatGPT from OpenAI, Gemini from Google, Claude from Anthropic, and LlaMa from Meta) with TMR methods, such as surveys applied to the beer market in Spain. This comparison sheds light on both their benefits and drawbacks and provides practical recommendations for decision-makers on adopting these tools for performing market research studies. The mature and highly concentrated competitive beer market offers an ideal testing ground for comparing AI-based models and TMRS.
Our analysis shows that LLMs represent a valuable tool for performing market research. They can serve as a proxy to complement TMRS, responding with high similarity to most of the questions (JSD <0.2 in all questions but one, with a value of 0.2104), and are consistent with the distribution provided for the TMRS. Nevertheless, none of them can fully replicate the TMRS, confirming H1. Therefore, the adoption of LLMs can represent a competitive advantage not only for large companies, which can develop market research studies more efficiently through the combination of these models and TMRS, but also for SMEs that can now perform studies previously less accessible to them because of high costs.
Another relevant finding from this research is the confirmation of the hypothesis that LLMs can capture and reflect aspects of customer psychology, just as TMRS do. These aspects include personal preferences for product and brand attributes such as flavour and advertising, as well as the intrinsic tendency of customers to be more critical of product prices compared to other attributes. Compared to other types of questions, the average similarity for questions related to products and brand attributes is 20.16 % closer to the responses provided by the TMRS. This high similarity to the TMRS distribution responses demonstrated the capability of LLMs to effectively address questions related to customer psychology, confirming H2.
These findings also indicate variability in the performance among the models, with LLM_3 emerging as the top performer in seven out of ten questions and ranking second in the remaining three with an average JSD of 0.1412. Additionally, the accuracy of the responses varies depending on both the model used and the type of question, showing a + 565 % JSD difference from the most precise to the least precise response provided by an LLM. This indicates that different models perform better or worse depending on the specific aspects or attributes being evaluated. This variability complicates understanding the errors in the responses and represents a risk for companies in the decision-making process.
It stems from a combination of factors, including the training data and model architecture, temporal and contextual coverage, and the nature of the alignment mechanisms used during the development and training (also summarised in Table 1). In addition, the level of abstraction in the questions is also a very relevant factor, as the LLMs’ accuracy decreases as questions become more concrete and specific. This is particularly evident in questions related to future purchase intentions, brand or product positioning, and market share, where highly detailed and context-specific information is required.
We found that the LLMs were more precise in funnel conversion stages related to Consideration (Question 2 about factors influencing consumption choice and Question 3 about brand attributes) and Customer Experience (Question 5 about frequency of consumption and Question 6 about place of consumption), showing slight differences compared to the TMRS (JSD= 0.1140 and 0.1097 respectively), indicating minor discrepancies.
However, they are less accurate in predicting less documented aspects, such as future purchase intentions or market share, apparent in stages such as Awareness (Question 1 about top-of-mind brand recall) and Purchase Intentions (Question 4 about consumption) with JSD = 0.1415 and 0.2104, respectively.
These results show that the lack of detailed training data and the need to understand complex competitive and economic contexts to train the models impact the accuracy and relevance of their results compared to TMRS, thereby confirming H3.
Finally, another drawback is the reproducibility of results. The robustness of TMRS depends on the sample selection method, which aims to ensure the representativeness of the sample. In contrast, AI models are prone to producing varying results for the same questions. Practitioners and decision-makers must be aware of these risks and mitigate them by using multiple LLMs and employing an iterative process to corroborate and calibrate the results, especially when they do not have a TMRS to contrast these results.
Our findings indicate that LLMs can serve as proxies to replicate customer behaviour in market research studies, especially when these models are well-trained, calibrated, and benchmarked appropriately or when several LLMs are used simultaneously to triangulate results and enhance the capabilities of the human researcher. This challenges the boundaries between human and synthetic respondents and invites rethinking the theories related to customer behaviour, brand perception, and the value and efficiency that simulated data can bring to behavioural sciences.
CRediT authorship contribution statementMacarena Estevez: Investigation, Formal analysis, Data curation, Conceptualization. María Teresa Ballestar: Writing – original draft, Methodology, Investigation, Formal analysis. Jorge Sainz: Writing – review & editing, Writing – original draft, Validation, Supervision, Methodology, Investigation.
Age distribution.
Location distribution.
Question 1: Distribution of the relative frequency of responses regarding top-of-mind beer brands among customers.
Question 2: Distribution of the relative frequency of responses regarding customers' perceived value of specific beer attributes for the CORONA BRAND.
Question 3: Distribution of the relative frequency of responses regarding customers' perceived value of specific beer attributes for the HEINEKEN BRAND.
Question 4: Distribution of the relative frequency of responses regarding customers' brand consumption intention.
Question 5: Distribution of the relative frequency of responses regarding beer consumption frequency by model type.
Question 6: Distribution of the relative frequency of responses regarding places of beer consumption.