


A new industrial development paradigm, the Fifth Industrial Revolution or ‘Industry 5.0’ is expected to humanise green technological innovation (GTI), social resilience, and sustainable development of industrial ecosystems. Emphasising the supplier-customer interaction, ‘Industry 5.0’ is technological revolution, which is a value-driven initiative that drives knowledge spillovers along the sustainable supply chain (SSC). In this context, enterprises are incorporating more GTI activities into their partners’ SSC strategies. This study employs samples of China's A-share listed companies covering the period from 2010 to 2021 to examine the spillover effects between customers’ GTI and suppliers total factor productivity (TFP). Both GTI and TFP indicators are important representations of ‘Industry 5.0’, with our major concerning on the enhancement of supplier's long-term orientation (LTO). We calculated TFP by the Olley-Pakes and Levinsohn-Petrin methods, dividing GTI indicators into three levels: substantial green technological innovation (SGTI), non-substantial green technological innovation (NGTI), and overall green technological innovation (OGTI). Our empirical results show that 1) Customer's GTI contributes to supplier's TFP, and supplier's LTO including environmental, social & governance (ESG) performance, and R&D input can strengthen this beneficial link; 2) customer's NGTI represents a significant differentiation in comparison with SGTI, where R&D investment weakens the positive relationship between customer's NGTI and supplier's TFP; 3) heterogeneity analysis indicates that the spillovers of customer's GTI on supplier's TFP are more pronounced among state-owned enterprises, high-tech enterprises, and non-polluting enterprises. Notably, the connectedness demonstrates dynamic patterns through 2SLS and GMM regressions, highlighting the importance of enterprises' SSC and LTO being the shock transmitters to their TFP. Our study is prone to benefit lawmakers, regulators, and firm executives responsible for analysing and assessing the SSC, providing more policy implications with future prospects for sustainable transformation in the upcoming ‘Industry 5.0’ era.
Sustainable productivity has received increasing attention from both governments and enterprises since the end of the last century. The focus of productivity growth is now directed at Industrial Internet of Things (IIoT) or ‘Industry 5.0’ – a new industrial development paradigm related to the humanisation of green technologies, social resilience, and sustainable development of industrial ecosystems. Therefore, the long-term impact of technological progress on total factor productivity (TFP) growth should be further assessed through an integrative framework (Colino et al., 2014; Chou et al., 2014; Edquist & Henrekson, 2017). The impact of green technological innovation (GTI) activities on eco-efficiency is more specific and targeted (Chen et al., 2017; Ghisetti et al., 2017; Liu et al., 2020), promoting the response of the economy to global climate change (Chen et al., 2022; Saunila et al., 2018; Yu et al., 2019). The GTI emphasises green transformation in the industrialisation process, which can relieve the damage caused by industry on the ecological environment in the context of ‘Industry 5.0’. China's expansion of heavy industries over the last several decades has reversed the course of its ecological process (Chen, 2015), and China's import competition further stimulates a rapid growth in technological innovation and TFP since the end of the last century (Bloom et al., 2016). Under the dual pressure of sustainable productivity and environmental protection, the Chinese government has contributed to global ecosystems through indirect policy learning and GTI diffusion (Zhu et al., 2019). Consistent with the research of Song et al. (2022) and Chen et al. (2024), this study selected GTI and TFP indicators as important representations of ‘Industry 5.0’.
Furthermore, the supplier-customer interaction (SCI) can significantly affect stock prices (Pandit et al., 2011), CEO turnover (Intintoli et al., 2017), adulteration risks (Levi et al., 2020), earnings announcements (Cho et al., 2020), investment efficiency (Chiu et al., 2019), and innovation activities (Chu et al., 2018). However, existing empirical research focuses on the influencing mechanism of enterprises' innovation on productivity at the individual level, with a few concerning the SCI (Thomas and Carsten, 2020). Based on the SCI, a sustainable supply chain (SSC) has emerged as the management of material and information flows with the joint objective of improving the sustainable outcomes (Koberg & Longoni, 2019), aligned with environmental and social performance (Farooque et al., 2019). Emerging technologies have also given rise to more opportunities for sustainable operations within supply chain management (Choi, 2019; Choi et al., 2020; Xu et al., 2023), and the new industrial development paradigm of ‘Industry 5.0’ further highlighting the importance of SSC (Wang et al., 2023). The key aspect is determining the influencing mechanism of partners' sustainable operations on both TFP and GTI performance. The main problem lies in the uncertainty of the internal impact of SSC within the relationship between the TFP and GTI indicators. In addition, there may exist more negative externalities of a different kind; therefore, the search for a compromise and consistency of interests is of fundamental importance. Inspired by the promotion of ‘Industry 5.0’, we directed our research toward searching for approaches to the GTI activities of partners' TFP in China's SSC paradigm. Based on the long-term relationship and orientation, this study aims to stimulate empirical research leading to thought-provoking works that have substantial relevance to sustainable business strategies and GTI supporting sustainable productivity along the SSC.
The remainder of this paper is organised as follows: Section 2"Hypothesis development" details the theoretical foundation underpinning the investigation and proposes the hypotheses. Section 3" Methodology" describes the study data, variables, and models. Section 4"Empirical results" presents the benchmark regression results, robustness checks, and a heterogeneity analysis. Finally, Section 5"Conclusions, enlightenments, and limitations" concludes with a summary of the findings and practical implications of future prospects.
Our contributionsThe implementation of IIoT or ‘Industry 5.0’ attaches a major concern to value creation in the industrial ecosystems. This study advances the literature by identifying customers' GTI as an important antecedent of suppliers' TFP for SSC and exploring the moderating roles of enterprises long-term orientation (LTO) indices. Broadly, we contribute to the literature on LTO and the SSC as follows.
- (1)
Existing research has focused on the TFP of focal firms (Song et al., 2022), neglecting the potential influencing mechanism of partners' GTI (such as customers) on firms' TFP. Meanwhile, the R&D spillover effect of customers’ R&D input (RDI) on a supplier's R&D output is positively moderated by partners' technological proximity (Isaksson et al., 2016). This study explores the effective pathways of stimulating customers’ GTI practices on suppliers’ TFP growth, while RDI plays an important role in enriching and extending the current scope of knowledge spillover theory in academia.
- (2)
As a comprehensive non-financial indicator, ESG (environmental, social, and governance) rating has been completely investigated for its causal relationship in the econometrics field; however, a few empirical studies have clarified the enhancing and moderating mechanisms of ESG efforts. Moreover, previous studies indicate that LTO is highly related to RDI (Flammer & Bansal, 2017; Miller & Xu, 2020), environmental performance (Durach & Wiengarten, 2017; Dou et al., 2019) and social responsibility (Kim et al., 2020; Wang & Bansal, 2012). Combining a deeper insight of SCI and LTO, this study introduces the moderator of ESG indices into the econometrics model. Our findings contribute toward presenting the internal driving mechanisms and impact of LTO performance at the micro enterprise level, filling the research gap in the enhancement of the overall ESG practice for the upcoming ‘Industry 5.0’ era.
- (3)
A sustainable supply chain (SSC) play a critical role in facilitating environmentally and economically sustainable transitions in human communities (Reklitis et al., 2021). Industry 5.0 has emerged as a novel improvement in SSC by utilising advanced technologies to continuously monitor and manage industrial processes (Wang et al., 2023). However, the current literature does not extend to knowledge spillovers in view of the uniqueness of customers’ GTI activities along the SSC. This paper constructs a theoretical analysis framework for SSC spillovers, focusing on the internal moderating impact of LTO. We examine how customers’ GTI stimulates suppliers’ TFP, which may affect the establishment of long-term relationships with core enterprises and complete exploitation of technical knowledge resources within the SSC. From the perspective of partners' GTI activities, our findings also contribute to the broader literature on searching for approaches toward SSC paradigm, providing a recondite understanding of ‘Industry 5.0’ prospects in corporate finance.
Keller (2002) and Lychagin et al. (2016) examined the influence of knowledge spillovers on enterprise productivity growth at both macro and micro levels. Technological innovation can facilitate efficient resource utilisation and reduce production costs (Goldfarb & Tucker, 2019), and it is positively correlated with TFP growth (Balasubramanian & Sivadasan, 2011). Furthermore, the improvement in TFP due to upgrades in the technology-driven industrial structure is also reflected in the strengthening of the industrial structure based on GTI activities (Zhao et al., 2022). The benefits of GTI activities include increased productivity growth (Porter, 1991) and reduced production costs (Berrone et al., 2013; Sun et al., 2017). The GTI can increase TFP in OECD (Organization for Economic Co-operation and Development) member countries (Sohag et al., 2021). Compared with developing countries, the GTI has more a significant impact on the TFP of developed economies (Du & Li, 2019). However, detailed research at the micro-level is still lacking, indicating a research gap in econometrics.
With regard to both SCI and SSC, the social exchange theory (Lawler et al., 1999) posits that the majority of interpersonal interaction behaviour originates from social exchange, and the ‘reciprocity effect’ is the basic principle of a mutually beneficial relationship. Technological innovation is closely associated with supply chain partners in terms of the ‘reciprocity effect’ of external networks (Li et al., 2018). TFP represents a firm's GTI output most intuitively, and is spillable and quantifiable within the internal and external networks of the industry (Chen et al., 2021). Both customers and suppliers along the SCI would benefit from efficient communication and specialised cooperation within their partnerships (Dyer & Singh, 1998; Kotabe et al., 2003). The effect of a firm's GTI on TFP can be further reflected in the concentration of innovation factors in the external network (Zhao et al., 2022). The uniqueness of the SCI motivates this ‘reciprocity effect’, due to the high mutual dependence and low product-market competition (Pandit et al., 2011). Green practices within the SSC can increase customers’ positive intention (Peng, 2023), and a higher level of customer GTI tends to overflow knowledge via SSC to stabilise this mutually beneficial relationship (Xu et al., 2022), which may ultimately promote the supplier's TFP. Based on the SCI, the GTI is highly associated with increases in the learning ability of enterprises, allowing them to develop advanced production technologies and management experiences (Zhao et al., 2021), thus enhancing TFP through product reform and the GTI (Song et al., 2022). As the level of GTI activities and the demand for green products continue to increase, a spontaneous flow of suppliers’ production factors will be fully exploited for customers’ green strategy. Therefore, a close supplier-customer relationship can further motivate the spillover effects of customers’ GTI activities (Zhong et al., 2021). Customers’ GTI activities have additional knowledge spillover effects, and suppliers may actively improve their TFP by learning and imitating advanced green strategies from their customers. Based on the above theoretical framework, we propose Hypothesis 1.
H1. Customer's GTI is positively related to supplier's TFP.
Enhancement of supplier's ESG performanceEnterprises’ GTI activities are closely related to long-term orientation (LTO) (Saether et al., 2021) and corporate social responsibility (CSR) (Hao & He, 2022) indicators. From the perspective of stakeholder theory (Freeman et al., 2004), CSR can be recognised as a powerful and crucial factor in terms of social responsibility. Scholars have widely accepted that CSR can enhance a corporate's reputation and reduce the volatility of its stock price (Hur et al., 2014; Miller et al., 2020; Wang et al., 2022). Thus, CSR activities can create extra value for shareholders if long-term investors managers are properly monitored by Nguyen et al. (2020). Considering stakeholder incentives, organisational LTO can maximise staff commitment to improving sustainability performance (Caprar & Neville, 2012) which involves a proactive environmental strategy (Durach & Wiengarten, 2017), environmental practices, and environmental performance efficacy (Dou et al., 2019). Meanwhile, LTO can offset the liability of newness by making strategic decisions that realise the benefits of CSR activities better, leading to profitable outcomes for CSR initiatives (Wang & Bansal, 2012). On one hand, CSR performance is a focal indicator in building long-term relationships or orientation with customers (Kim et al., 2020); on the other hand, LTO benefits stakeholders' relationships (Flammer & Bansal, 2017), based on the contribution of such relationships to long-term value creation (Edmans, 2012; Flammer, 2015).
Based on CSR initiatives, ESG indicators are highly correlated with organisational LTO (Capelle et al., 2019; Sardanelli et al., 2022; Chen et al., 2024). Integrating a positive interaction between LTO and CSR at the microenterprise level, we address the importance of ESG indices to discuss the possibility of enhancement in the promotion of GTI on TFP. Previous studies have investigated the impact of ESG performance on corporate financial aspects such as financial performance (Bruna et al., 2022; Zheng et al., 2022), financial risks (Capelle et al., 2019; Shakil, 2021), and financing costs (Ng & Rezaee, 2015; Ielasi et al., 2021). However, little emphasis has been placed on how ESG efforts influence corporate productivity and TFP. In an SSC, there are three primary mechanisms through which ESG can strengthen the positive impact of GTI on TFP. First, as a general concept related to a firm's productivity, non-financial information is an unignorable element, and it is natural for ESG ratings to influence TFP (Deng et al., 2023). Thus, suppliers’ ESG performance can improve TFP at the individual level. Second, ESG practice has become increasingly important for financial institutions and individual investors, especially for raising stakeholders’ awareness on ecological issues and mitigating environmental externalities from social assessments (Berg et al., 2022; Zheng et al., 2022). Improved ESG performance offers low-cost financing channels for external institutions and governments (Eliwa et al., 2021; Khoury et al., 2022), which can alleviate financial pressure on innovation activities (Apergis et al., 2022). That is, a higher ESG score can alleviate the financial pressure on GTI activities (Chen et al., 2022), thus strengthening the beneficial link between GTI and TFP. Third, ESG efforts strengthen employees’ recognition and satisfaction (He et al., 2022) to promote labour productivity and the competitive advantage of production (Hur et al., 2018). With such incentives from the customer side, suppliers’ ESG performance encourages customers’ GTI motivation, which can reduce production costs and produce greener and differentiated products compared to those of competitors, thereby gaining suppliers’ TFP and market share in the long run. Based on this, we propose Hypothesis 2 with a deep insight into SSC.
H2: Supplier's ESG performance strengthens the positive relationship between the customer's GTI and supplier's TFP.
Enhancement of supplier's R&D investmentThe upper echelons theory (Hambrick & Mason, 1984) posits that the scope of negative attainment discrepancy motivates firms to actively increase R&D input (RDI), particularly for firms operating with LTO (Chen et al., 2023). As technological innovation relates strongly with LTO (Ruvio et al., 2014), and exogenous long-term incentives can increase the amount of RDI (Flammer & Bansal, 2017), organisational LTO is becoming a critical prerequisite for RDI (Miller & Xu, 2020). The contribution of a firm's RDI to productivity growth has been investigated extensively, and most quantitative studies have shown that RDI positively affects productivity growth (Griffith et al., 2004). Higon (2007) reviewed previous studies and concluded that the output elasticity of RDI for TFP growth is between 0.015 and 0.37. The recent literature has drawn controversial conclusions regarding the relationship between RDI and TFP. According to Fang et al. (2020), both patent stocks and initial patenting events contribute fundamentally to TFP. Xu and Deng (2022), further indicating that government-directed R&D expenditure has a significant impact on the urban TFP growth. However, Ejermo et al. (2011) and Yu et al. (2021) find that RDI cannot be converted into high productivity, which is known as the ‘Swedish Paradox’ effect. Given the important role RDI plays in ensuring the survival and growth of firms after COVID-19 (Chen et al., 2022), an increasing number of firms are seeking to recover from LTO and RDI activities, whereby it is reasonable to assume that RDI stimulates TFP growth with LTO incentives.
Considering SCI and SSC, the high-cost and complexity of innovation activities push companies to leverage external knowledge resources (Laursen & Salter, 2006). Reduced product market competition and mutual dependence further motivate tacit knowledge transfer during SCI (Isaksson et al., 2016). According to the knowledge spillover theory, knowledge spillovers reflect unexpected, uncompensated, and informal knowledge transfers (Acs et al., 2009), and such knowledge transfers ensue in both upstream and downstream industries (Xu et al., 2022). By exploiting knowledge spillovers along the SSC with LTO, enhancement of RDI on the relationship between GTI and TFP can be categorised into the following three aspects. First, upstream R&D activities are key inputs for downstream R&D incentives (Harhoff, 1996). Compared with horizontal R&D spillovers among rival firms, knowledge exchange in SCI acts as an additional channel for promoting the transaction of valuable tacit knowledge (Cassiman & Veugelers, 2002). Thus, customers’ RDI contribute significantly to the supplier's RDI, owing to the facilitated possibilities of R&D spillover effects along SCI through repeated interactions (Isaksson et al., 2016). Such RDI incentives along the SCI are typically associated with repeated interactions between partners, enabling the transfer of green technical knowledge and patents from the SSC. Second, knowledge diffusion from RDI can stimulate both labour productivity and TFP level (Bin, 2008). By combining insights derived from knowledge spillovers and LTO, suppliers along the SSC may actively increase RDI to enhance their TFP levels and maintain long-term relationships with customers. Third, the impact of customer's RDI on suppliers’ RDI is positively moderated by the duration of SCI and technological proximity (Isaksson et al., 2016). With such incentives, suppliers’ RDI encourages enterprise managers to conduct R&D output and GTI activities that reduce production costs and produce greener and more differentiated products than competitors. Accordingly, supplier's RDI strengthens the positive impact of the customer's GTI on TFP. Consistent with the above hypothesis development, we propose Hypothesis 3 and research design of Fig. 1, as shown below.

H3: Supplier's RDI strengthens the positive relationship between the customer's GTI and supplier's TFP.
MethodologyDataThis study selected A-share listed companies on the Shenzhen and Shanghai Stock Exchange from 2010 to 2020, company-level data were obtained from listed companies’ databases such as Chinese Research Data Services (CNRDS), China Stock Market & Accounting Research (CSMAR), and Wind China Financial database (WIND). Based on Isaksson et al. (2016) and Chu et al. (2018), our samples comprised all supplier–customer pairs that can be identified in the CSMAR database during the past decade, where the supplier–customer-year observations of A-X-2015, A-Y-2015, and A-Z-2015 represent supplier A, corresponding to multiple customers X, Y, and Z in 2015, respectively. As customers’ annual GTI information is only disclosed in the following year, the impact on suppliers has 1-year lag period. Thus, our sampled customer data are from 2009 to 2020, and the corresponding supplier samples are from 2010 to 2021; all continuous variables were winsorised by 1 % and 99 % quantiles to control the influence of extreme values. We conducted the following data processing by excluding (1) samples with missing data, (2) financial and real estate samples, and (3) ST and PT samples during the research period. Finally, a total of 1410 supplier-customer-year observations were acquired, including 528 suppliers and 408 customers.
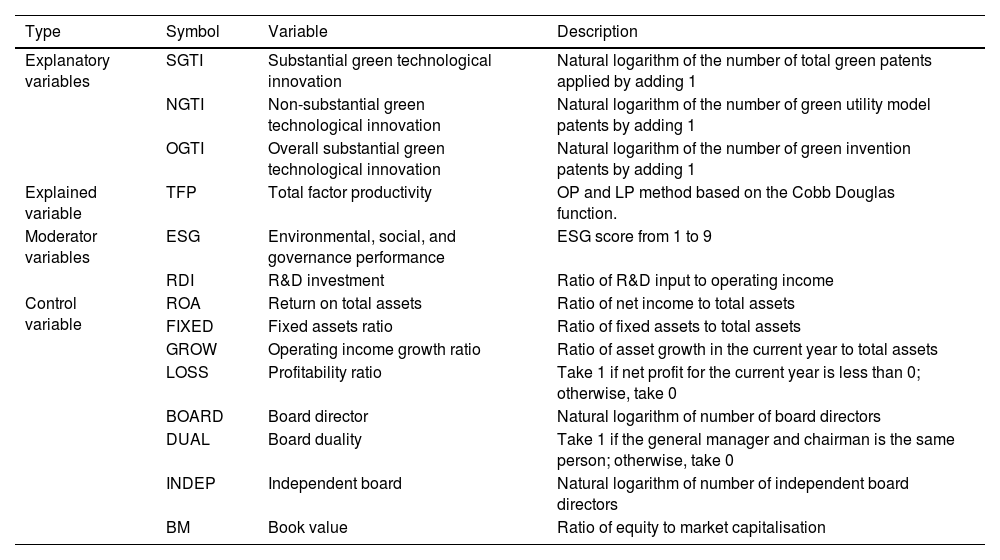
VariablesExplanatory variablesThe number of patent applications is closely related to the TFP indicator (Balasubramanian & Sivadasan, 2011), and green patent applications can significantly improve the TFP performance of listed Chinese companies (Song et al., 2022). Thus, the number of green patent applications is considered a proxy for a firm's GTI activities (Liu et al., 2022). Consistent with previous literature, this study employs the number of green patent applications as a proxy variable to measure GTI activities, distinguishing GTI from dimensions such as substantial green technological innovation (SGTI), non-substantial green technological innovation (NGTI), and overall green technological innovation (OGTI) (aligned with Cao et al., 2022; Jiang & Bai, 2022; Zhang et al., 2021). Considering the huge deviation and delay effects of patent applications within companies, we conducted natural logarithm processing and lag by one period on the patent counts.
Explained variablesThe Olley-Pakes (OP) and Levinsohn-Petrin (LP) methods are increasingly adopting empirical measures of the green bioeconomy or bio-based economy impact on panel data (Chen et al., 2021; Moghaddasi & Pour, 2016; Zheng et al., 2021). The parametric estimation method proposed by Olley and Pakes (1996) is as follows:

In formula (1), Yit represents the total output of company i during year t; and Ait represents the TFP that could facilitate the marginal product of all inputs.; Kit and Lit delegate the capital input and labour input of the company; Year, Reg, and Ind delegate dummy variables for the enterprise year, region, and industry, respectively. Additionally, dummy variables for firm age (FA), firm ownership (FO), and export behaviour (EX) are introduced in the formula (1). However, the Olley-Pakes (OP)method may cause the missing samples within the estimation process (Chen et al., 2021), whereas the Levinsohn-Petrin (LP) method can effectively avoid these endogeneity and truncation issues (Li et al., 2022). Therefore, the production function estimation of TFP developed by Levinsohn and Petrin (2003) is further adopted, as shown below:


In formula (2), Wit represents the intermediate input products, and Mit is calculated using a monotone increasing function Mit = Mt (kit, Wit). This study uses the LP method of formula (3) to solve the data truncation and endogeneity issues in TFP calculation, and the TFP scores measured by the LP function are employed as our robustness indicators.
Moderating variablesESG performanceDrawing upon Tang (2022), Deng et al. (2023), and Zhong et al. (2023), this study employs Huazheng's ESG ratings to measure the ESG performance of the enterprise, which differentiates ESG ratings into nine scales (C-AAA) and assigns points (1–9) for each observation. The Huazheng ESG database comprises 14 secondary-and 26 third-level scoring systems.
R&D investmentThe ratio of R&D investment to operating income can effectively delegate a firm's innovative efforts while allowing to conduct quantitative research (Isaksson et al., 2016; Taques et al., 2021). This study employs the ratio of R&D input to operating income as a quantitative indicator of RDI and examines knowledge spillovers along the SSC.
Control variablesReferring to Chen et al. (2022), Zheng et al. (2022), and Song et al. (2022), we introduce a series of characteristic variables that affect enterprises’ TFP and GTI, including return on total assets, fixed assets ratio, operating income growth ratio, profitability ratio, board directors, board duality, independent boards, and book value (see Table 1). Meanwhile, year- and industry-fixed effects were added to reduce the difference in research results between years and industries.
Variable description.
Notes: Table shows the summary statistics of the variables.
Based on previous theoretical analysis results, this study establishes the following fixed effect (FE) panel regression model:

In Model (4), the subscripts i and t denote the industry firm and year, respectively. The explanatory variable is TFP, and the explained variable of GTI includes substantial green technological innovation (SGTI), and non-substantial green technological innovation (NGTI). Controlsi,t includes all control variables, and εi,t is the random error term of the model.
Moderating effect modelsTo further examine the enhancement effect of LTO on the positive relationship between GTI and TFP, the following econometric models were established based on the method described by Shakil (2021) and Zhao et al. (2021), where the coefficients of the interaction term in Models (5) and (6) represent the moderating effects of LTO and GTI and include the three dimensions of OGTI, SGTI, and NGTI.
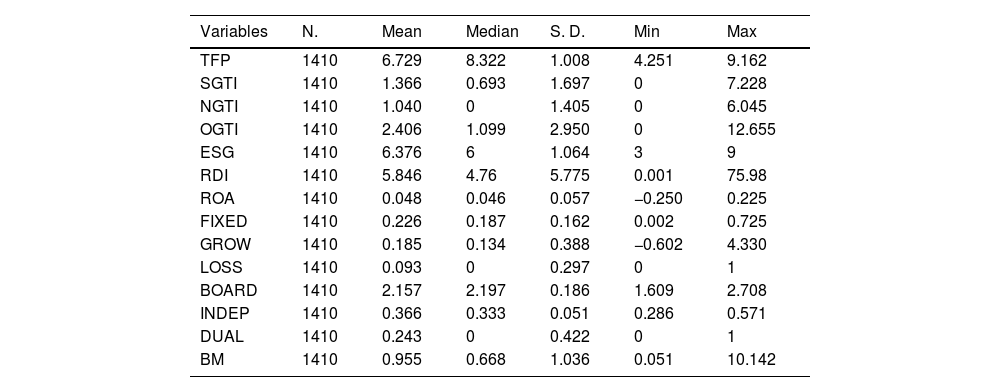
Empirical resultsDescriptive statistics and correlation matrix

Table 2 presents the descriptive statistics that offer concise insights into the distribution and characteristics of the variables examined. The mean value of TFP is 6.729, with a standard deviation (SD) of 1.008, indicating sufficient variety within the TFP among enterprises. The mean values of GTI indicators (SGTI, NGTI, and OGTI) were 1.366, 1.040, and 2.406, with SD of 1.697, 1.405, and 2.950, respectively. This suggests that the GTI indicators can be fully identified between the samples. The ESG indicators displayed a medium level of variability (SD = 1.064), and the RDI showed wider variability (SD = 5.775). The absence of outliers within the sample enterprises indicates that no extreme observations are likely to influence subsequent research significantly.
Descriptive statistics.
Notes: All the variables are explained in Table 1.
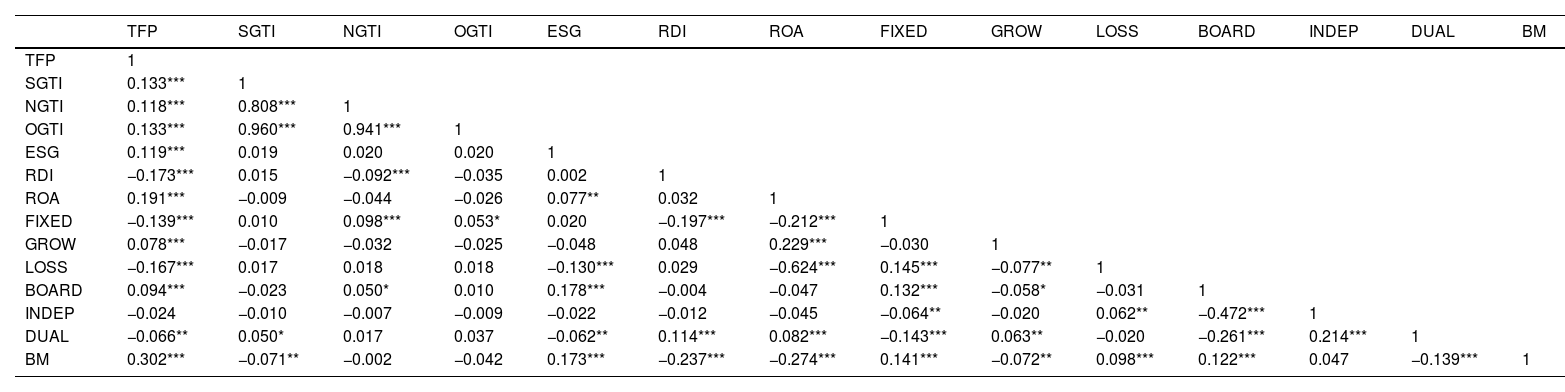
Table 3 presents Pearson's correlation coefficients, the coefficients between TFP and GTI indicators (SGTI, NGTI, OGTI) are 0.133, 0.118, and 0.133, with a strategically significant 1 %. The OGTI comprises the two dimensions of SGTI and NGTI, so it is reasonable to assume a high correlation between SGTI, NGTI, and OGTI. Moreover, the correlation coefficients of other variables in Table 3 are less than 0.7, implying that these variables can be fully identified, and there is no serious multicollinearity in our panel data.
Correlation matrix.
Notes: All the variables are explained in Table 1. The t-statistics in parentheses, * p < 0.1, ** p < 0.05, *** p < 0.01.
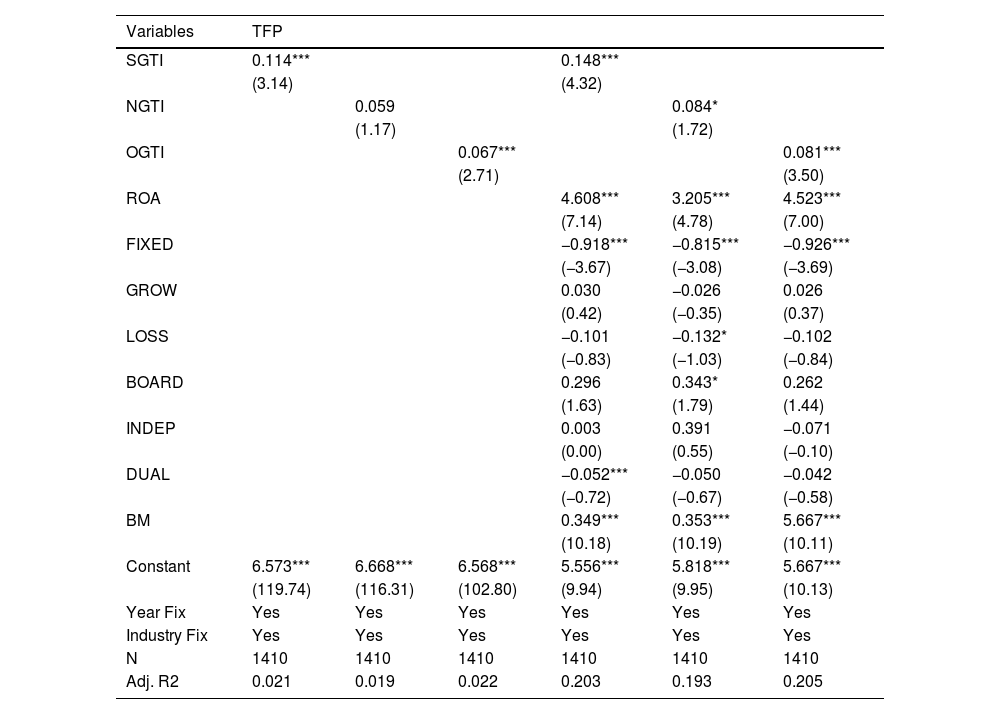
Table 4 reports the regression results of the benchmark model of customer's GTI on supplier's TFP. Non-substantial green technological innovation (NGTI) can affect TFP positively after importing the control variables. Although the positive relationship exists in column (2), this impact is not significant unless the influence of the control variables is considered. Moreover, both OGTI and SGTI demonstrate a statistically significant positive coefficient, indicating a strong causal relationship between customer's substantive green innovation activities on supplier's TFP, thereby supporting Hypothesis 1.
Promotion of customer's GTI on supplier's TFP.
Notes: The t-statistics values are reported in parentheses as * p < 0.1, **p < 0.05, ***p < 0.01.
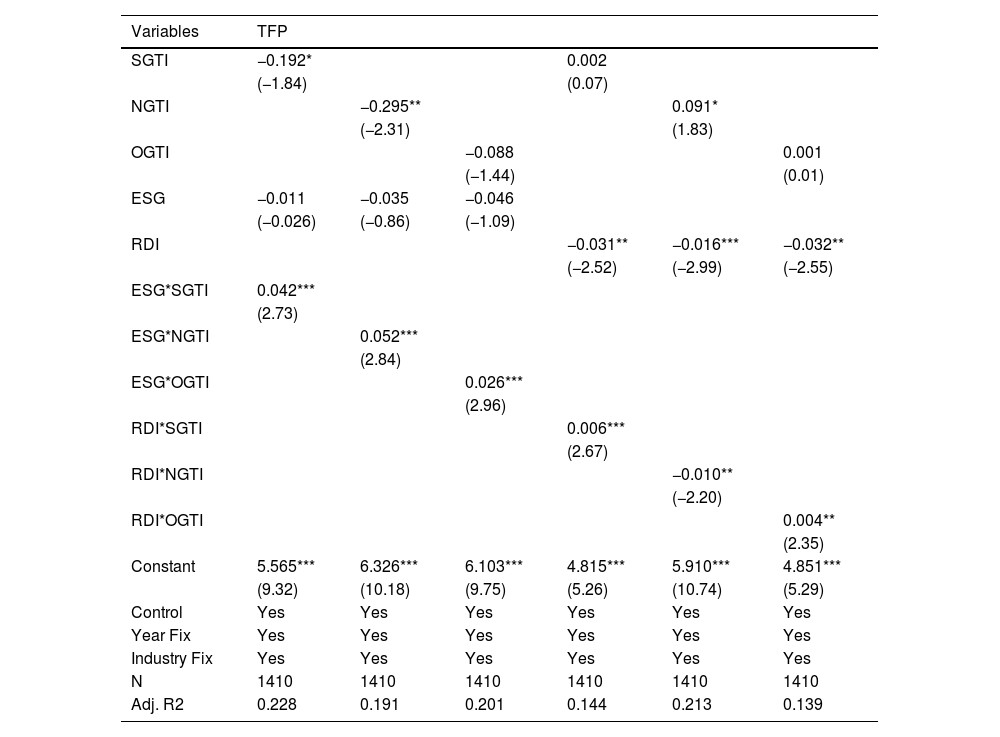
To fully identify the intrinsic influencing mechanism of the GTI on TFP, this study introduces ESG and RDI indicators into the benchmark regression model. Table 5 reports the moderating effects of ESG and RDI, with significant coefficients for all the cross-terms. The results illustrate customer's NGTI is significantly different from SGTI, and supplier's RDI weakens the positive relationship between customer's NGTI and supplier's TFP. Thus, Hypothesis 2 is fully supported, and Hypothesis 3 is partial verified.
Moderating effect of Supplier's ESG and RDI.
Notes: The t-statistics values are reported in parentheses as * p < 0.1, **p < 0.05, ***p < 0.01.
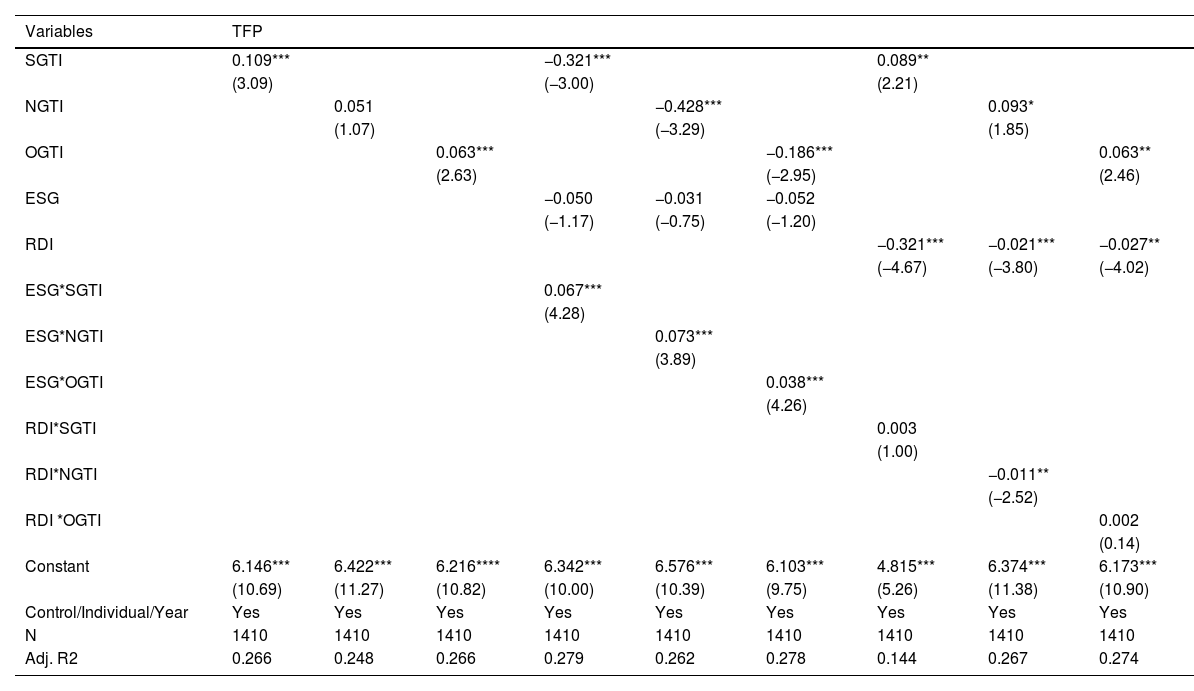
To verify the robustness of our results from the perspective of TFP measurements, we replaced the supplier's TFP by the LP method as the dependent variable. Table 6 presents the regression results, where supplier's ESG and RDI can enhance the impact of customer's GTI on supplier's TFP.
Regression results of the replacing variable.
Notes: The t-statistics values are reported in parentheses as * p < 0.1, **p < 0.05, ***p < 0.01.
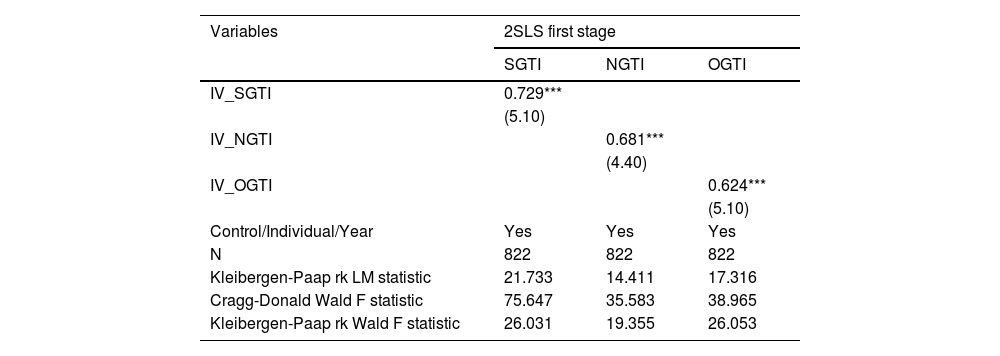
Considering endogenous problems such as measurement errors and missing variables, we refer to the method proposed by Dertinger and Hirth (2020) and Zheng et al. (2022) employing the average number of SGTI, NGTI, and OGTI in the industry and year as the instrumental variables, obtaining the instrumental values of IV_SGTI, IV_NGTI, and IV_OGTI to investigate the influencing mechanism of customer's GTI on supplier's TFP applying heterogeneous tools. The calculation formula is as follows:


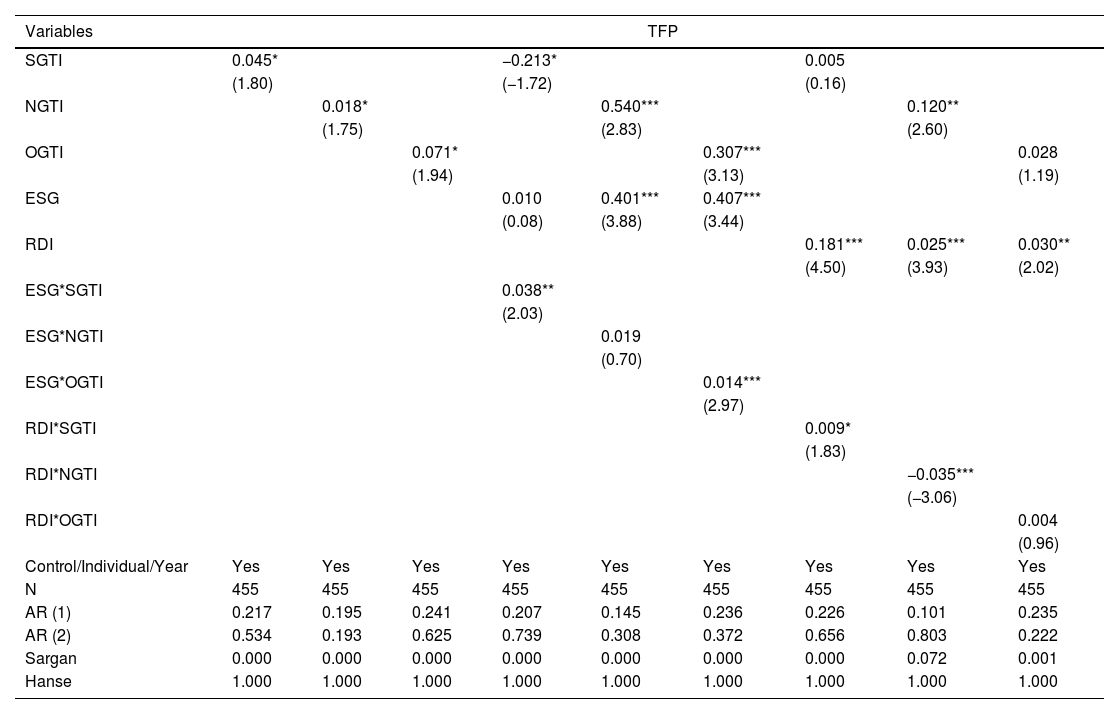
Tables 7 and 8 illustrate the regression results of the two-stage least squares (2SLS) approach using instrumental variables, and the coefficients of the one-stage regressions IV_SGTI, IV_NGTI, and IV_OGTI pass the significance test at the 1 % level. The p-value of the Kleibergen-Paap LM statistic is less than 0.1, indicating that our instrumental variables can be effectively identified. The Cragg-Donald Wald F-statistic is much greater than the Stock-Yogo critical judgment value at the 10 % level, indicating that there is no weak instrumental variable issue in the following regressions: As shown in Table 8, the regression coefficients of all three dimensions of GTI can have a significantly positive impact on TFP after controlling for endogeneity. Further, the 2SLS regression results indicate that supplier's LTO performance, including ESG and RDI, can strengthen the positive impact of customer's GTI on supplier's TFP, which is also consistent with the baseline regression results, thus verifying the robustness of our main test.
Estimation of weak instrumental variables in the 2SLS first stage.
Notes: The t-statistics values are reported in parentheses as * p < 0.1, **p < 0.05, ***p < 0.01.
Regression results in the 2SLS second stage.
Notes: The t-statistics values are reported in parentheses as * p < 0.1, **p < 0.05, ***p < 0.01.
Our personal contributions involve a two-step generalised method-of-moments (GMM) approach based on the weak instrumental variable test. These results emphasise the applied scientific nature, which is appropriate and consistent with the tools adopted in empirical research. Bottomed on the instrumental variable, we further conducted a dynamic estimation using the GMM method, and all the results presented in Table 9 are aligned consistent with the main regression.
Regression results by GMM method.
| Variables | TFP | ||||||||
|---|---|---|---|---|---|---|---|---|---|
| SGTI | 0.045* | −0.213* | 0.005 | ||||||
| (1.80) | (−1.72) | (0.16) | |||||||
| NGTI | 0.018* | 0.540*** | 0.120** | ||||||
| (1.75) | (2.83) | (2.60) | |||||||
| OGTI | 0.071* | 0.307*** | 0.028 | ||||||
| (1.94) | (3.13) | (1.19) | |||||||
| ESG | 0.010 | 0.401*** | 0.407*** | ||||||
| (0.08) | (3.88) | (3.44) | |||||||
| RDI | 0.181*** | 0.025*** | 0.030** | ||||||
| (4.50) | (3.93) | (2.02) | |||||||
| ESG*SGTI | 0.038** | ||||||||
| (2.03) | |||||||||
| ESG*NGTI | 0.019 | ||||||||
| (0.70) | |||||||||
| ESG*OGTI | 0.014*** | ||||||||
| (2.97) | |||||||||
| RDI*SGTI | 0.009* | ||||||||
| (1.83) | |||||||||
| RDI*NGTI | −0.035*** | ||||||||
| (−3.06) | |||||||||
| RDI*OGTI | 0.004 | ||||||||
| (0.96) | |||||||||
| Control/Individual/Year | Yes | Yes | Yes | Yes | Yes | Yes | Yes | Yes | Yes |
| N | 455 | 455 | 455 | 455 | 455 | 455 | 455 | 455 | 455 |
| AR (1) | 0.217 | 0.195 | 0.241 | 0.207 | 0.145 | 0.236 | 0.226 | 0.101 | 0.235 |
| AR (2) | 0.534 | 0.193 | 0.625 | 0.739 | 0.308 | 0.372 | 0.656 | 0.803 | 0.222 |
| Sargan | 0.000 | 0.000 | 0.000 | 0.000 | 0.000 | 0.000 | 0.000 | 0.072 | 0.001 |
| Hanse | 1.000 | 1.000 | 1.000 | 1.000 | 1.000 | 1.000 | 1.000 | 1.000 | 1.000 |
Notes: The t-statistics values are reported in parentheses as * p < 0.1, **p < 0.05, ***p < 0.01.
The coefficients in columns (1–3) of Table 9 are significant and positive, indicating that a customer's GTI can improve the supplier's TFP significantly. The effect of ESG performance on SGTI, NGTI, and OGTI in columns (4–6) is positive, but the coefficient of ESG*NGTI is not significant. The coefficients of RDI*NGTI are significant and negative; the coefficients of both RDI*SGTI and RDI*OGTI are positive, consistent with the results of the main test.
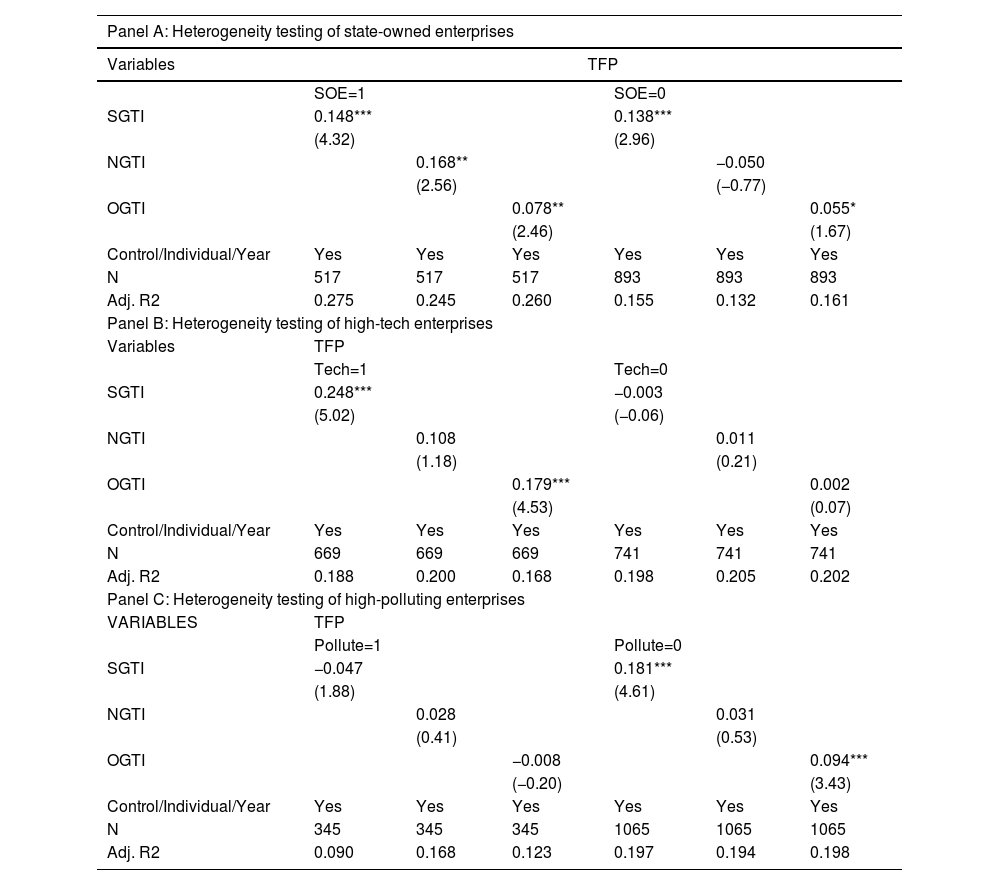
Heterogeneity analysis(1) As the property nature of the listed companies can determine the allocation and utilisation of production resources such as the GTI, there may be discrepancies in knowledge spillovers between customers and suppliers. The direct or indirect connection of state-owned enterprises (SOEs) with the government can facilitate access to scarce resources and information; therefore, their motivation for technological innovation is relatively weak in comparison with others (Chen et al., 2014). This would attach more importance to supplier enterprises on the spillover effects of GTI to SOEs. By contrast, non-SOEs need to make more efforts on searching for knowledge and information from external networks to improve their innovation levels, thus weakening the spillovers of their GTI activities. From the perspective of mutual causality between the GTI and TFP, this study speculates that the GTI of state-owned customers has a significant positive impact on their suppliers’ TFP. Panel A of Table 12 shows the regression results, indicating that customers’ GTI has a more significant impact on suppliers’ TFP among state-owned customers.
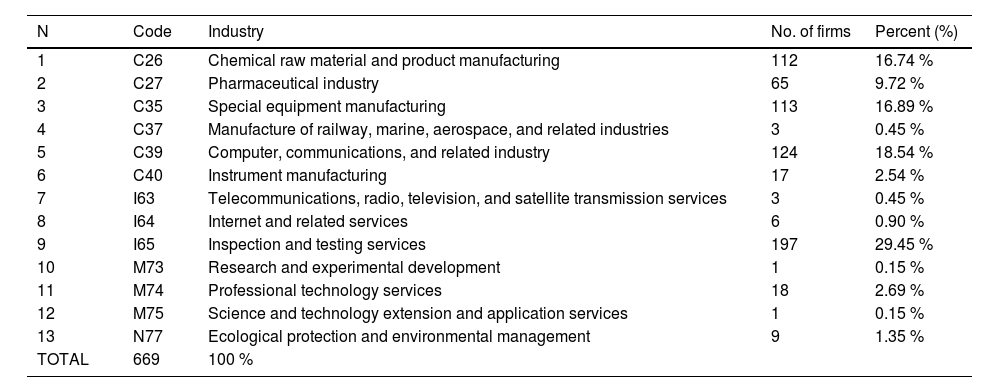
(2) High-tech enterprises (HTEs) are changing the innovative process of industries and people's lifestyle, exhibiting a more competitive trend (Kim & Steensma, 2017). Such innovative resources are constantly gathered for HTEs through the agglomeration effect, thereby promoting companies’ independent innovation ability and production efficiency (Jang et al., 2017). Specifically, among HTEs, customers’ innovation ability has additional knowledge spillovers and affects suppliers’ innovation (Isaksson et al., 2016). Therefore, HTEs would focus on scientific frontiers for obtaining corresponding innovative resources through the spillover effects of GTI along the SSC. In this context, we assume that customers’ GTI has a more significant positive impact on the TFP of high-tech suppliers. According to the OECD classification standards, HTEs can be categorised into six industries engaged in the manufacture of: scientific, electrical, aerospace, computer, pharmaceutical, and communication equipment. Meanwhile, “high-tech industry classification (2018)” of the State Council of China (SCC) further classified the high-tech industry into nine subcategories: R&D services, professional services, intellectual property services, e-commerce services, information services, inspection, testing services, technology transfer services, and environmental governance services. Drawing upon the methods of Wang (2020) and Han and Gu (2021), this study has classified 13 industries as HTEs (see Table 10). The heterogeneous results of HTEs are shown in Panel B of Table 12, demonstrating a more significant impact of customer's GTI on supplier's TFP among HTEs than others.
Subcategories of HTEs.
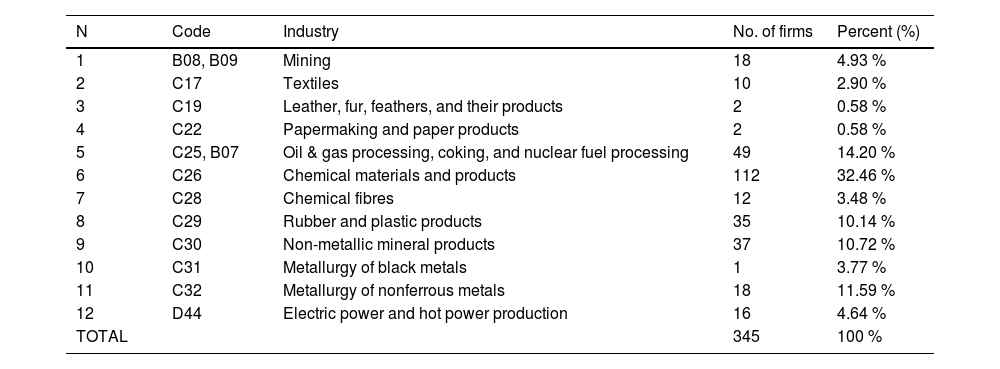
(3) Faced with the dual constraints of resources and the environment, GTI is an important measure for solving the development challenges of heavily polluting industries (Cai et al., 2020). Thus, the supply chain transmission mechanisms may be different in high-polluting enterprises (HPEs). Drawing on the methodology of Deschenes et al. (2017) and Zhou et al. (2017), 12 sub-industries were identified from 14 industrial subcategories to examine the heterogeneity in pollution-intensive industries (see Table 11). Finally, an experimental group of 345 observations was identified as the high pollution group. The regression results in Panel C of Table 12 indicate that non-polluting customer's GTI has a more significant impact on supplier's TFP.
Subcategories of HPEs.
Heterogeneity analysis.
Notes: The t-statistics values are reported in parentheses as * p < 0.1, **p < 0.05, ***p < 0.01.
China has committed to achieving “carbon neutrality” by 2060, the industrial green transformation programme for enhancing market competitiveness and realising sustainable productivity has become critical for the green and sustainable development of the overall economy. In this context, both GTI and TFP indicators are important representations of ‘Industry 5.0′, with our major concern being the enhancement effect of LTO. Based on the panel data of China's A-share listed companies from 2010 to 2020, this study examined the impact of customers' GTI on supplier' TFP and its underlying mechanism. We calculated TFP by the OP and LP methods, dividing GTI indicators into three levels:: SGTI, NGTI, and OGTI. Our empirical results show that 1) customer's GTI contributes to supplier's TFP, and supplier's LTO including ESG and RDI can strengthen this beneficial link; 2) customers’ NGTI represents a significant differentiation in comparison with SGTI, where RDI weakens the positive relationship between customer's NGTI and supplier's TFP; 3) heterogeneity analysis demonstrates that the spillovers of customer's GTI on supplier's TFP are more pronounced among SOEs, HTEs, and non-HPEs. Furthermore, 2SLS and GMM regressions by instrumental variables in the robustness test fully support the above conclusions. In view of the upcoming ‘Industry 5.0′ era, we assessed the important path for China to achieve the high quality development with a combined perspective of SSC and LTO. Based on these results, this study proposes the following relevant practical implications:
- (1)
Policymakers should implement targeted pollution reduction policies for the synergistic growth of green TFP (Li & Wu, 2017). As customer's GTI can affect suppliers’ TFP through knowledge spillovers, suppliers should actively optimise the innovation model to broaden knowledge and information resources from the external market. Meanwhile, suppliers share knowledge and expertise with their partners when customers adopt green technology. Moreover, transfer of green technologies can assist suppliers in upgrading their production processes and enhancing overall productivity. For example, suppliers can facilitate green TFP by establishing external connections with customers for successful GTI activities or high innovation vitality. Additionally, market-based cooperation along SSC should be further strengthened by LTO to promote the synergistic potential of GTI and achieve green TFP growth.
- (2)
Only a few granted patents perform practical functions in society, and a small fraction account for the bulk of the value created (Acemoglu et al., 2022). The current GTI strategy is still fragmented because of the presence of several patents with different standards, such as the NGTI. Compared with SGTI, NGTI represents a notable difference in promoting TFP, where our results demonstrate that RDI weakens the positive relationship between customer's NGTI and supplier's TFP. The establishment of normative eco-technology standards is fundamentally significant for realising LTO and SSC. Thereby the difference in enterprises' TFP development should be reduced by SGTI motivation, and the “benign cycle” model could be realised based on the knowledge spillovers along SSC with better SGTI performance. Moreover, the design and implementation of green credit policies should focus on promoting the SGTI motivation. For example, financial subsidies and relevant audit departments can develop a scientific green performance evaluation system using standardised quantitative indicators. Specific measures involve increasing the weight of functional LTO indicators in GTI reviews and integrating RDI and ESG information disclosure into a comprehensive scoring system for financial subsidies. Other green financial policies should also shift from government-guided resource allocation to a market-oriented mechanism for GTI incentives, actively guiding the market demand for green products and avoiding green technologies without market demand.
- (3)
Green policies should reflect diverse industrial characteristics (Chen et al., 2022). The central government should implement a series of carbon tax policies, including remanufacturing discount and a lower penalty for SOEs, HTEs, and non-HPEs. Policymakers can provide more financial support, increase the greenness of taxation, and encourage green production based on industrial characteristics. It should also improve GTI input through subsidies and tax reductions that are targeted to support GTI activities, especially for environment-related industries in China. In the new context of ‘Industry 5.0′, SOEs, HTEs, and non-HPEs should prioritise organisational LTO and sustainable strategies and actively adopt a long-term strategy that can balance the economy, society, and environment for SSC.
As a limitation of this study, our sample comprises China's listed companies. Future studies should explore the knowledge spillovers of non-listed companies (i.e. unicorn or green companies). In addition to the spillover effects, other impact mechanisms of customers' GTI that affect suppliers TFP need to be fully identified. The essence of these business strategies involve SCI and LTO stewardship while developing green practices. Based on the current trends in supply chain globalisation and environmental protection, further investigation is required regarding the cross-cultural validity of SSC in cultures other than Western countries or OECD members. ‘Industry 5.0′ is not a new technological revolution, but a value-driven initiative that drives technological transformation to improve human well-being and the natural environment. For future prospects, it addresses the importance of integrating customers 'GTI, suppliers' TFP, and resilience strategy in SCI from the combining perspective of the SSC and LTO in the upcoming ‘Industry 5.0′ era.
CRediT authorship contribution statementLifeng Chen: Data curation, Funding acquisition, Methodology, Writing – review & editing. Qitaisong Shen: Conceptualization, Project administration, Resources. Xiaolan Yu: Software, Writing – original draft. Xiaohui Chen: Formal analysis, Validation.