


Innovation can be a source of competitive advantage for companies, either through the improvement of methods and techniques capable of generating new products or services, or perfecting existing ones. Along these lines, it is particularly important to measure innovation and discuss the results associated therewith. The aim of this research is to address each of the main indicators of organizational innovation, separately discussing the advantages and disadvantages inherent to their deployment. The results entail a substantial theoretical advancement by improving measurement systems from various perspectives: products and processes, manufacturing and services, as well as input indicators, intermediaries and outputs. However, difficulties and limitations are still apparent, including the sort of distorting biases potentially affecting researcher estimates. Furthermore, multidimensional indicators provide a broader and more precise view of the innovation phenomenon at companies, because they are more comprehensive in the understanding of such phenomenon per se, unlike the one-dimensional choice, which carries constraints for discussing the real effects in the organizational context, especially in the case of services.
The study on innovation is directly linked to two areas close to science: management and economics. The first one seeks to understand the internal dimensions of innovation, (i.e., its generation within organizational structures) while the second one seeks to understand the effects of its evolution within companies (Kemp, Folkeringa, De Jong, & Wubben, 2003). The time factor is important, because an adaptive learning culture nurtures long-term company innovation, especially in dynamic competitive environments (Kotter & Heskett, 1992).
The key argument here is that innovation can bring business-related advantages, both internal and external, especially through more dynamic and efficient production processes, the generation of new products and services, or improvements in the existing ones. The absence of appropriate monitoring systems for innovation resources may restrict a suitable project analysis, which may imply non-optimal allocation (Durst, Mention, & Poutanen, 2015). Therefore, monitoring innovative performance is relevant on several fronts: for managers to develop medium- and long-term company strategies at companies; for investors to make decisions effectively increasing the resources invested; for public policymakers in terms of tax incentivation; for research-promotion agencies to establish funding-targeted criteria; as well as for public and private educational institutions to jointly conduct technology-development projects (Borins, 1998, Damanpour, Walker, & Avellaneda, 2009).
There is also a need to distinguish the appropriate measures for manufacturing and service companies respectively, since the very design of innovation may result in distorted estimates. Service companies may present a sort of hidden or invisible innovation, hampering the traditional method of manufacturing indicators (Djellal & Gallouj, 2010; Gallouj & Savona, 2009; Morrar, 2014; Snyder, Witell, & Gustafsson, 2016). According to Smith (2004), this is where a conceptual problem lies: by definition, innovation means novelty, something qualitatively new, created through learning processes and knowledge. Per se, commensurability requires qualitative similarities to allow for quantitative comparison, a fact that may appear less obvious in the services segment. Therefore, the innovation process itself is not trivial, and may display high complexity (Gunday, Ulusoy, Kilic, & Alpkan, 2011; Kim, 2013; Prajogo, 2006).
Nevertheless, Durst et al. (2015) report that assessing the degree of homogeneity among innovation typologies in terms of sub-sectors and company size may not be the best way to measure innovation in services. Company-size based nnovational differences are also reported by Kemp et al. (2003), and Kleinknecht and Mohnen (2002), since the ability to innovate increases according to the organization's size. Consequently, smaller firms are less likely to innovate, but by carrying out innovation, the sales-related effect tends to be more significant in larger organizations. In the light of the aforementioned, the challenge proposed by the existing literature is therefore to adjust the indicators to different innovation typologies, i.e., to adequately measure the innovation phenomenon while allowing for comparability, either in terms of time, industry, or even region.
The goal of our research is built upon three cornerstones: identifying the most relevant elements of the theoretical approach to innovation; listing and classifying the indicators most frequently used to measure organizational innovation; as well as discussing the positive and negative aspects associated therewith; and lastly, assessing the ideal context for adequate measure implementation, and a potential adherence to address different company profiles, either by industry, by company size, or over the course of time. In order to fulfill such steps, our proposed methodology consists of reviewing studies that discuss innovation from an organizational and measurement-criteria perspective, targeting both theoretical and applied research.
The rationale of such research actually lies in the question whether the thus-far discussed indicators may suffice to account for the innovation phenomenon at companies, and satisfactorily measure the type of innovation intended. Secondly, it also aims at discussing whether indicator choice can generate some kind of bias in the estimates, or lead to the extraction of sector-relevant evidence. In other words, whether choice can carry some determining characteristic, potentially distorting estimates. Thirdly, it aims at evaluating whether one-dimensional indicators may be sufficient in order to measure the innovation phenomenon at companies.
So far, the conclusions thereof indicate that the one-dimensional use of an innovation indicator is restrictive to understand the innovative process. For example, Boone, Lokshin, Guenter, and Belderbos (2019) argue that patents offer consistency and objectiveness because examiners may validate new inventions on their utility, an important point to measure innovation. In contrast, Jin, García, and Salomon (2019) discuss that, while patents may be ideal to some industries, the new-product indicator might be more appropriate to others.
The use of input, intermediate and output indicators tends to bring better analytical capacity, regardless of the target industry. In this line, a single-dimension analysis may generate measurement bias in organizational innovation when empirical work is concerned, especially upon industry or sector comparison, since each has a specific dynamics, thus the innovative effect is neither adequately observed nor captured.
The same distortion can be observed in terms of company size. The definition of an indicator that is essentially captured in large companies can generate an inaccurate understanding of organizational innovation in multiple-sized samples. This perception should be evaluated by the researcher in order to best work on the use of available indicators.
Our research findings are consistent with some elements of a work by Dziallas and Blind (2019). Here, the authors seek to identify 82 indicators relevant to account for organizational innovation through a systematic review process, and subsequently report that the existence of a limited number of indicators at the early stages of this process, as well as differences between types of innovation. This research is substantially conclusive in discussing the advantages and disadvantages of a set of 26 innovation indicators, as well as considering their application in terms of industry type, company size and time frame. Such features highlight the contribution made both by such study and our own work to the application of indicators by innovative managers and policymakers in the means of capturing this effect more specifically in the company context.
This article is divided into three sections, plus an introduction and the final considerations. The first section discusses company-innovation related concepts and definitions. The second one identifies the main innovation indicators for organizations, assessing their advantages and disadvantages. The third one discusses the most appropriate perspectives for indicator deployment.
ConceptualizationAlthough innovation is a widely debated notion, it is important to point out that the arguments listed here are oriented towards the organizational environment. Additionally, only a few of the theoretical aspects are briefly identified to support the understanding of innovation indicators, yet the presence of other studies is considered to broaden the debate and contribute to different perspectives.
For Damanpour et al. (2009), company innovation may be the result of new ideas being applied to products, services, processes (operational or administrative), or even to the market. The scope of innovation, therefore, may vary to accommodate either individuals, the organization as a whole, its sector, or the industry in its entirety. In a related work, Schumpeter (1961) presents widely employed concepts such as invention and innovation. On its part, invention is understood as an idea about something new, or either an organizational improvement, while innovation is seen as a result of invention, i.e., the realization of the initially proposed idea and its commercial implementation. Since innovation is subsequent to invention, both can be connected to products, services, or processes. However, not all inventions translate into innovation, therefore reaching the market (Ernst, 2001; Freeman & Soete, 1997; Giuri, Mariani, & Brusoni, 2007; Hagedoorn & Cloodt, 2003).
Hence, innovation can constitute something new or modified (improved), and stem from a product or service; processes; organizational and marketing practices; or external-stakeholder relations (OECD, 2015). The main goal here is to achieve efficiency and create business value (either in financial or competitive terms) for customers, employees, owners, partners, and consumers, stemming from a combination of the many types of innovation operating on several fronts of the organizational structure; and influencing adaptive-change capacity in the market of operation (Damanpour et al., 2009; Ostrom, Bitner, & Brown, 2010).
The act of innovation should be conducted continuously and consistently by companies in their decision-making (Prajogo, 2006; Subramanian & Nilakanta, 1996). Knowledge production and sharing may bring the organization a wide range of operational benefits through learning processes (Bates & Khasawneh, 2005). Kemp et al. (2003) insist in that the evolution of innovation may diverge between small and medium enterprises, since resource constraints and greater vulnerability –whether internal or external– in a business environment may influence decision-making. Additionally, Arundel and Hollanders (2008) suggest that indicators should be able to sustain value over time, as well as to contribute to medium- and long-term policies.
Conceptually, it should be specified that different approaches exist within the innovation theoretical framework. Classifications are diverse, which to some extent hampers indicator comparison. One of the more traditional approaches refers to radical innovation as something actually new, while the changes usually associated with incremental innovation are defined as an improvement over previously-existing elements, i.e., a continuous process over the course of time (Freeman, 1987; Kleinknecht, Montfort, & Brouwer, 2002). Kingsland (2007) adds that incremental innovation is usually associated with a lower risk and, for this reason, relatively easier to implement than radical innovation.
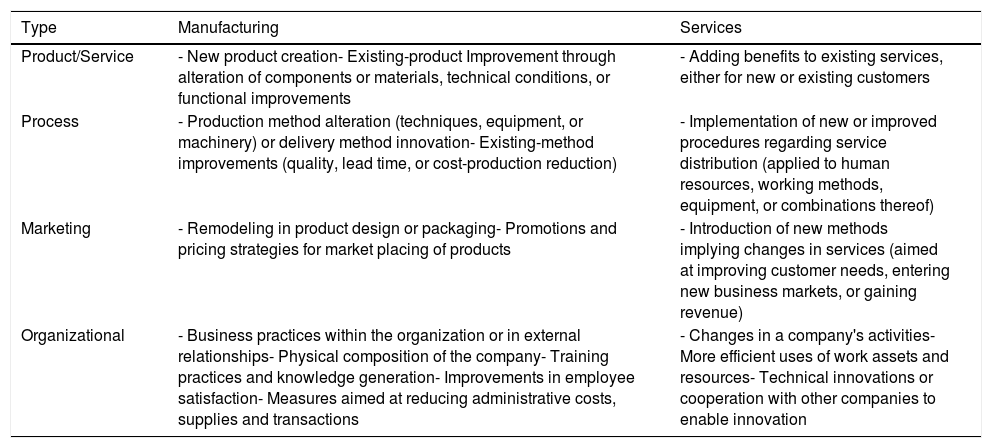
Another widely diffused classification is segmented into four perspectives: (a) product/service innovation; (b) process innovation; (c) marketing innovation; and (d) organizational innovation (Table 1). These seek to clarify possible ways of generating innovation both internally and externally.
Types of innovation by industry.
| Type | Manufacturing | Services |
|---|---|---|
| Product/Service | - New product creation- Existing-product Improvement through alteration of components or materials, technical conditions, or functional improvements | - Adding benefits to existing services, either for new or existing customers |
| Process | - Production method alteration (techniques, equipment, or machinery) or delivery method innovation- Existing-method improvements (quality, lead time, or cost-production reduction) | - Implementation of new or improved procedures regarding service distribution (applied to human resources, working methods, equipment, or combinations thereof) |
| Marketing | - Remodeling in product design or packaging- Promotions and pricing strategies for market placing of products | - Introduction of new methods implying changes in services (aimed at improving customer needs, entering new business markets, or gaining revenue) |
| Organizational | - Business practices within the organization or in external relationships- Physical composition of the company- Training practices and knowledge generation- Improvements in employee satisfaction- Measures aimed at reducing administrative costs, supplies and transactions | - Changes in a company's activities- More efficient uses of work assets and resources- Technical innovations or cooperation with other companies to enable innovation |
Table compiled based on studies by: OECD (2005); Gunday et al. (2011), and Klosiewicz-Górecka (2015).
Therefore, not only is the understanding of innovation as such diverse, but also its potential classifications – although similar across industries –, illustrating each industry's divergent conceptions thereof. Kemp et al. (2003) discuss the difference between innovation in products/services and processes, since they understand product innovation to be stimulated by technological competition in terms of the industry's potential innovators; the pursuit of knowledge; the effect of the R&D overflow on the industry; innovation-related experiences as such; the diversification potential of innovation; the use of laboratory research; and the intensity of capital. Such dimensions appear to be decisive in terms of processes; knowledge sources; research consortium constitution; economic competition; capital ownership (domestic or foreign); economic stability; and organizational size.
Any of the aforementioned classifications allow for the possibility of both radical or incremental categorization, since they may stem either from something new, or improvements on the already-existing. In the case of products, modifications relate specifically to product features or service execution. For processes, adaptations are in place for the techniques, or even the equipment, involved in the production process. For marketing strategy, planning is essential for the improvement of prices, products, marketplace conditions, promotion or distribution logistics channel. Finally, the organizational aspect includes any practices conducted within the organization’s internal environment, such as training, or even external relations with business partners (Bloch, 2005).
Once the basic concepts have been listed, pertinent arguments may classified accordingly with the different types of industry. The causes for innovation may differ between manufacturing and services industries, present though it may be in both. While manufacturing depends on the accumulation of capabilities, agility in best practices is preponderant in the services segment (Kanerva, Hollanders, & Arundel, 2006). Another difference lies in between the perspectives of product and process innovation, such difference being clearer, and stricter in services. There is a much greater customer proximity in service companies, which translates into a more accurate perception of the quality served, while a considerable difficulty in the perception between these two types of innovation is also acknowledged (Prajogo, 2006; Zeithaml, Parasuraman, & Berry, 1990).
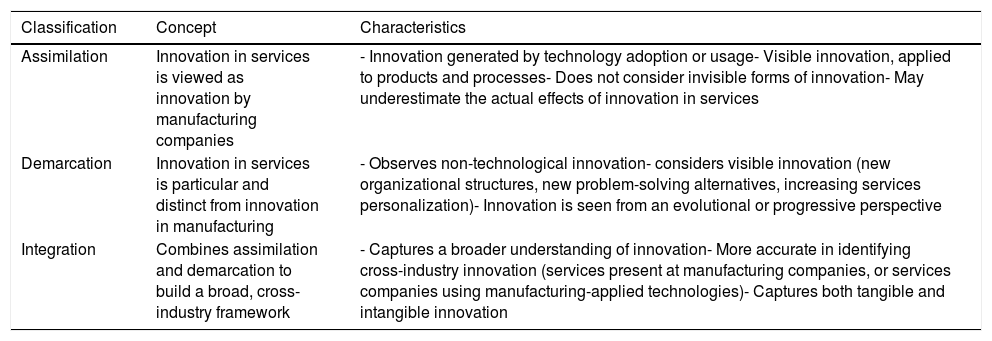
Services have their own characteristics, which means that this perception hinders conceptual understanding, consequently discouraging the establishment of valid indicators. Three different approaches are often examined in the existing theoretical contributions for services innovation: assimilation (subordination), demarcation (autonomy), and integration (synthesis), as described in Table 2.
Classifications of specific innovations for services.
| Classification | Concept | Characteristics |
|---|---|---|
| Assimilation | Innovation in services is viewed as innovation by manufacturing companies | - Innovation generated by technology adoption or usage- Visible innovation, applied to products and processes- Does not consider invisible forms of innovation- May underestimate the actual effects of innovation in services |
| Demarcation | Innovation in services is particular and distinct from innovation in manufacturing | - Observes non-technological innovation- considers visible innovation (new organizational structures, new problem-solving alternatives, increasing services personalization)- Innovation is seen from an evolutional or progressive perspective |
| Integration | Combines assimilation and demarcation to build a broad, cross-industry framework | - Captures a broader understanding of innovation- More accurate in identifying cross-industry innovation (services present at manufacturing companies, or services companies using manufacturing-applied technologies)- Captures both tangible and intangible innovation |
Table compiled on the grounds of the following studies: Morrar (2014); Pavitt (1984); Gallouj and Savona (2009); Sundbo and Gallouj (2000); Djellal and Gallouj (2001); Drejer (2004); Gallouj and Weinstein (1997); Hertog (2006).
The particularities of services represent a characteristic of their very nature – intangibility. Human resources and knowledge are fundamental elements in these organizations, because innovation requires creativity, knowledge, skills and entrepreneurship as a means to achieve the end. The high risk factor through uncertainties is also a characteristic, which may be at a degree above the manufacturing sector, and innovations may take place in a more subtle way, with gradual variations in something that already exists (Damanpour et al., 2009; Klosiewicz-Górecka, 2015; Prajogo, 2006).
With an increasingly rapid economic dynamics, where the time required either for product development and introduction or existing-product improvement is increasingly short, convergence occurs between manufacturing activities and service industries (Prajogo, 2006). In several companies the integration of services in their main manufacturing activities is quite apparent, as well as the outsourcing of services activities in the industries themselves, which conveys the idea of some stages of services production process progressively acquiring an industrial nature (Kanerva et al., 2006; Morrar, 2014). Durst et al. (2015) illustrate this case through manufacturing companies selling services supplementary to their products, which amounts to a certain degree of services innovation, while their essential manufacturing dedication remains. Therefore, one may observe whether such convergence is applicable to the measurement of innovative aspects within organizations.
Innovation indicatorsOne of the important points on innovation concerns the use of appropriate indicators for its measurement. Some indicators seek to evaluate how inputs generate outputs, while others are linked to the outcomes themselves. Input indicators may undergo some sort of manipulation by the company, while output indicators tend to be uncontrollable and unpredictable (Phan, 2013; Rose, Shipp, Lal, & Stone, 2009).
Inputs illustrate the scope, context, and structure of innovation (Phan, 2013). However, they may still undergo a process of transformation, called throughputs, where inputs become intermediaries and may finally transform into outputs (Janger, Schubert, Andries, & Rammer, 2017), or even outcomes. As an example, a company investsting in R&D may obtain as a result a registered patent. Subsequently, such patent generates a new product, leading to the registration of incremental revenue figures (Hagedoorn & Cloodt, 2003). A patent, according to Beneito (2006), consists of the grant of exclusive rights by a competent authority for a particular invention, whereby the applicant requests protection for a certain time period, translating into competitor impossibility to make commercial use of it.
The existing empirical literature lists a wide range of indicators used to measure innovation, citing patents, published patents, R&D investment, and new product launches, among others. Regardless of the choice, there are significant limitations and differences in the aspect to be measured, thus it is important to properly identify its features for an appropriate use in empirical research.
Regarding input indicators, Beneito (2006) defines knowledge production as their point of departure. Such function may be achieved, for instance, through R&D investment or expenditure. Here, there is a difference in the fact that expenditure amounts to the resources allocated to creative work in order to increase the knowledge inventory, which will consequently be subject to new applications (OECD, 2012). From an accounting perspective, investments are may be structurally oriented, targeting elements such as machinery, equipment, and buildings, but can also be associated with employee training. From an organization's financial perspective, major differences affect the equity framework, since expenses are considered P/L accounts and therefore decrease net revenue, while investment determines the resources allocated in intangible assets and comprise assets. For example, a successful investment, such as a new branded product, may be allocated not to the P/L account, but to the organization's balance sheet. Along these lines, it is possible to place R&D expenditures in accounts typically inappropriate a priori (e.g., marketing activities), in order to generate information for investors or shareholders (Chen, Gavious, & Lev, 2015; Hunter, Webster, & Wyatt, 2012; Lhuillery, Raffo, & Hamdan-Livramento, 2016).
Among input indicators, the resources invested either with R&D, or with the company's number of R&D-specialized employees are prominent. Their relevance for our purpose is substantial, since they reflect the company's innovative efforts. In some cases, this process of R&D inputs may not be planned, given some companies' lack of a specific R&D department. Therefore, there is potential for the occasional or even informal conduction of R&D activities (Lhuillery et al., 2016; OECD, 2015).
According to this, it is also possible to contend that these input indicators can be applied in both manufacturing and service firms. The volume of R&D expenditure has grown for the services segment, but still remains relatively below the manufacturing one. This does not necessarily imply that R&D investments are lower in the services ecosystem, but rather that they tend to be less formal, and therefore difficult to track down (Kanerva et al., 2006; Miles, 2004). Along the same lines, Salter and Tether (2006) argue that, compared to manufacturing, the lower R&D or patent volumes scored in the services sector are marginal.
Kleinknecht et al. (2002) argue that R&D expenditures can come from holding companies, although similar activities may be conducted in the group’s firms, so that the low R&D-intensity ones may take advantage of information from others belonging to the same conglomerate. They also increase the chances for a 'Singapore effect', where multinational affiliates make use of the R&D information of either the group’s parent or sister companies, even those located in other countries. From this argument by the authors, one can infer the possibility that a holding company acting in a specific sector may profit from innovation-related information within its company network even if it has originated from other economic activities. This may entail another difficulty for works of an empirical nature. Indeed, the authors argue that the very definition and interpretation of the term 'R&D' may be problematic for measurement purposes, since questionnaires or inquiries may lead to complex or long questions, potentially generating respondent discouragement or even lack of understanding.
Intermediate indicators are especially intended to protect property rights. Beneito (2006) points out that patents are aimed at protecting new products or processes, while industrial designs, trademarks, and copyrights also constitute property rights, yet of a different nature. On the other hand, Handke (2011) insists on the lack of evidence provided by the existing studies on 'copyrights versus patents', mainly explained by the difficulty in measuring intellectual-property protection and innovation, as well as the legal aspects related. Additionally, the relevance of identifying commercial innovation is underscored.
In many countries, patents follow the International Patent Classification (IPT), developed since 1968 in order to standardize patent documentation through a set of uniform standards. In this way, data search has been increasingly facilitated, simplifying the assessment of technological advances in many areas (WIPO, 2017). IPT provides a relevant set of patent-oriented criteria, together with the USPTO (United States Patent and Trademark Office) in the USA, the EPO (European Patent Office) in Europe, and the INPI (National Institute of Industrial Property) in Brazil, among many others.
The IPI classification facilitates document identification through the consideration of large areas (sections), appropriately constituting each field of knowledge. Next, class, sub-class, group, and sub-group are defined. Therefore, a hierarchy is imposed on the organization of technical knowledge, which may be subject to more than one classification. Through this system, it is possible to identify adequately and specifically the nature delimited for the patent (WIPO, 2017). However, in order to standardize systems and harmonize patent classifications between the United States and Europe, in 2010 the USPTO and the EPO created the Cooperative Patent Classification (CPC), in order to align purposes and reference frameworks between patent agencies, while defining a structure similar to the IPC model, but with a considerably more detailed hierarchical system displaying higher complexity, international updating, and comparability (CPC, 2017).
Patent databases can be particularly useful for research projects seeking to understand the cross-country impact of innovation (62 members associated with the IPC) and over time (NBER has compiled data between 1963 and 1999; USPTO, since 1790, full-text display available since 1976; and the EPO data are available since 1875).
Several authors classify patent indicators as output indicators, especially when the concept of intermediate indicator is not considered. Morris (2008) points out that output indicators should generate economic results in terms of innovation-related activity (inputs). On such grounds, it may be stated that a patent does not necessarily generate economic profit, in the same way that innovative activities do not necessarily result from specific financial resource allocations, innovation-oriented though they may be. As Beneito states (2006), organizations often fail to consider patents as indicators of the innovation outcome, given their impossibility to cover of both imitative and incremental innovation, Taking this into account, the classification followed by this research is supported by Janger et al. (2017), and Kleinknecht (1996), in their support for intermediate innovation.
Another characteristic of patents concerns inventions and innovations. Since inventions represent ideas, they sometimes remain non-patented, either because of their failure to meet the patentability criteria set out by competent agencies, or because of the procedural costs. However, patents may occasionally not be exploited for economic profit, in which case, the organization will deploy a strategical use thereof (Cohen, Nelson, & Walsh, 1996; Giuri et al., 2007; Lhuillery et al., 2016).
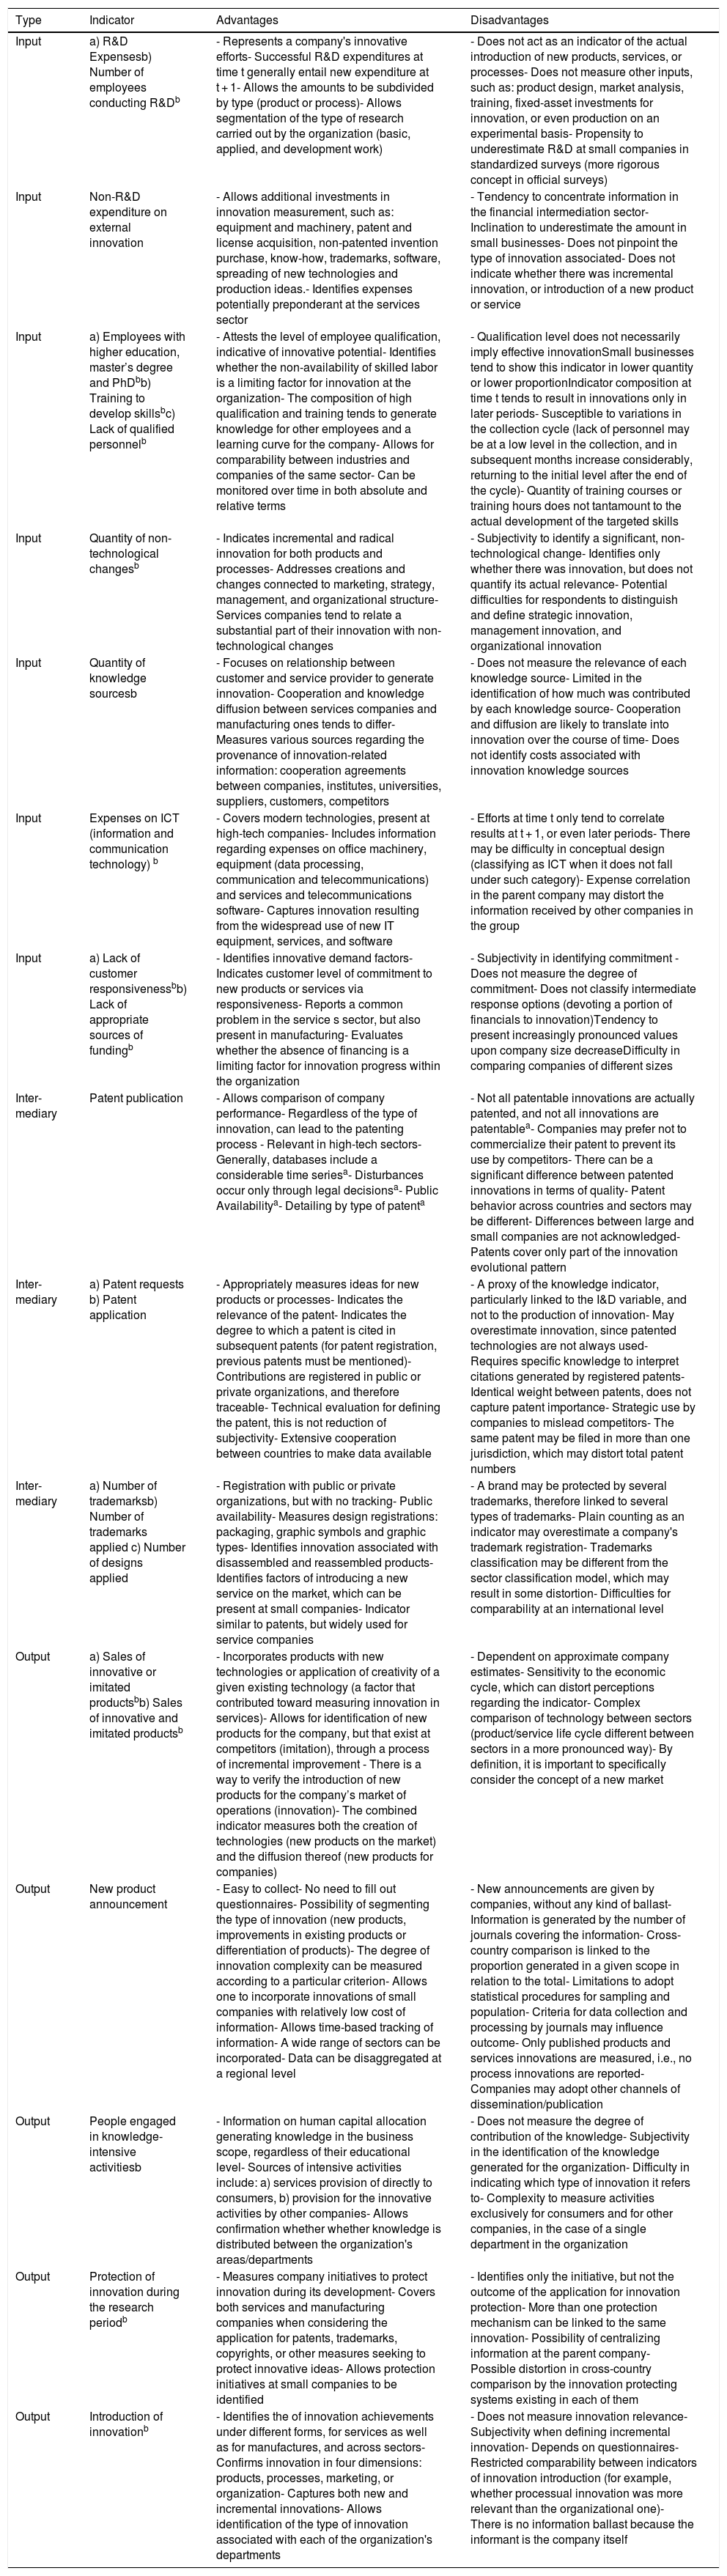
Many options exist in order to measure an organization's innovation. In this sense, Table 3 shows some indicators of input-, throughout-, and output- indicators mentioned in the related literature. A total of twenty-six, belonging to the three categories have been discussed with the aim of considering both positive and negative aspects. It should be emphasized that a wide range of alternatives may found outside scholarly work. Indeed, variations or proportions of these indicators are also present in several non-academic surveys.
Innovation indicators.
| Type | Indicator | Advantages | Disadvantages |
|---|---|---|---|
| Input | a) R&D Expensesb) Number of employees conducting R&Db | - Represents a company's innovative efforts- Successful R&D expenditures at time t generally entail new expenditure at t + 1- Allows the amounts to be subdivided by type (product or process)- Allows segmentation of the type of research carried out by the organization (basic, applied, and development work) | - Does not act as an indicator of the actual introduction of new products, services, or processes- Does not measure other inputs, such as: product design, market analysis, training, fixed-asset investments for innovation, or even production on an experimental basis- Propensity to underestimate R&D at small companies in standardized surveys (more rigorous concept in official surveys) |
| Input | Non-R&D expenditure on external innovation | - Allows additional investments in innovation measurement, such as: equipment and machinery, patent and license acquisition, non-patented invention purchase, know-how, trademarks, software, spreading of new technologies and production ideas.- Identifies expenses potentially preponderant at the services sector | - Tendency to concentrate information in the financial intermediation sector- Inclination to underestimate the amount in small businesses- Does not pinpoint the type of innovation associated- Does not indicate whether there was incremental innovation, or introduction of a new product or service |
| Input | a) Employees with higher education, master’s degree and PhDbb) Training to develop skillsbc) Lack of qualified personnelb | - Attests the level of employee qualification, indicative of innovative potential- Identifies whether the non-availability of skilled labor is a limiting factor for innovation at the organization- The composition of high qualification and training tends to generate knowledge for other employees and a learning curve for the company- Allows for comparability between industries and companies of the same sector- Can be monitored over time in both absolute and relative terms | - Qualification level does not necessarily imply effective innovationSmall businesses tend to show this indicator in lower quantity or lower proportionIndicator composition at time t tends to result in innovations only in later periods- Susceptible to variations in the collection cycle (lack of personnel may be at a low level in the collection, and in subsequent months increase considerably, returning to the initial level after the end of the cycle)- Quantity of training courses or training hours does not tantamount to the actual development of the targeted skills |
| Input | Quantity of non-technological changesb | - Indicates incremental and radical innovation for both products and processes- Addresses creations and changes connected to marketing, strategy, management, and organizational structure- Services companies tend to relate a substantial part of their innovation with non-technological changes | - Subjectivity to identify a significant, non-technological change- Identifies only whether there was innovation, but does not quantify its actual relevance- Potential difficulties for respondents to distinguish and define strategic innovation, management innovation, and organizational innovation |
| Input | Quantity of knowledge sourcesb | - Focuses on relationship between customer and service provider to generate innovation- Cooperation and knowledge diffusion between services companies and manufacturing ones tends to differ- Measures various sources regarding the provenance of innovation-related information: cooperation agreements between companies, institutes, universities, suppliers, customers, competitors | - Does not measure the relevance of each knowledge source- Limited in the identification of how much was contributed by each knowledge source- Cooperation and diffusion are likely to translate into innovation over the course of time- Does not identify costs associated with innovation knowledge sources |
| Input | Expenses on ICT (information and communication technology) b | - Covers modern technologies, present at high-tech companies- Includes information regarding expenses on office machinery, equipment (data processing, communication and telecommunications) and services and telecommunications software- Captures innovation resulting from the widespread use of new IT equipment, services, and software | - Efforts at time t only tend to correlate results at t + 1, or even later periods- There may be difficulty in conceptual design (classifying as ICT when it does not fall under such category)- Expense correlation in the parent company may distort the information received by other companies in the group |
| Input | a) Lack of customer responsivenessbb) Lack of appropriate sources of fundingb | - Identifies innovative demand factors- Indicates customer level of commitment to new products or services via responsiveness- Reports a common problem in the service s sector, but also present in manufacturing- Evaluates whether the absence of financing is a limiting factor for innovation progress within the organization | - Subjectivity in identifying commitment - Does not measure the degree of commitment- Does not classify intermediate response options (devoting a portion of financials to innovation)Tendency to present increasingly pronounced values upon company size decreaseDifficulty in comparing companies of different sizes |
| Inter-mediary | Patent publication | - Allows comparison of company performance- Regardless of the type of innovation, can lead to the patenting process - Relevant in high-tech sectors- Generally, databases include a considerable time seriesa- Disturbances occur only through legal decisionsa- Public Availabilitya- Detailing by type of patenta | - Not all patentable innovations are actually patented, and not all innovations are patentablea- Companies may prefer not to commercialize their patent to prevent its use by competitors- There can be a significant difference between patented innovations in terms of quality- Patent behavior across countries and sectors may be different- Differences between large and small companies are not acknowledged- Patents cover only part of the innovation evolutional pattern |
| Inter-mediary | a) Patent requests b) Patent application | - Appropriately measures ideas for new products or processes- Indicates the relevance of the patent- Indicates the degree to which a patent is cited in subsequent patents (for patent registration, previous patents must be mentioned)- Contributions are registered in public or private organizations, and therefore traceable- Technical evaluation for defining the patent, this is not reduction of subjectivity- Extensive cooperation between countries to make data available | - A proxy of the knowledge indicator, particularly linked to the I&D variable, and not to the production of innovation- May overestimate innovation, since patented technologies are not always used- Requires specific knowledge to interpret citations generated by registered patents- Identical weight between patents, does not capture patent importance- Strategic use by companies to mislead competitors- The same patent may be filed in more than one jurisdiction, which may distort total patent numbers |
| Inter-mediary | a) Number of trademarksb) Number of trademarks applied c) Number of designs applied | - Registration with public or private organizations, but with no tracking- Public availability- Measures design registrations: packaging, graphic symbols and graphic types- Identifies innovation associated with disassembled and reassembled products- Identifies factors of introducing a new service on the market, which can be present at small companies- Indicator similar to patents, but widely used for service companies | - A brand may be protected by several trademarks, therefore linked to several types of trademarks- Plain counting as an indicator may overestimate a company's trademark registration- Trademarks classification may be different from the sector classification model, which may result in some distortion- Difficulties for comparability at an international level |
| Output | a) Sales of innovative or imitated productsbb) Sales of innovative and imitated productsb | - Incorporates products with new technologies or application of creativity of a given existing technology (a factor that contributed toward measuring innovation in services)- Allows for identification of new products for the company, but that exist at competitors (imitation), through a process of incremental improvement - There is a way to verify the introduction of new products for the company’s market of operations (innovation)- The combined indicator measures both the creation of technologies (new products on the market) and the diffusion thereof (new products for companies) | - Dependent on approximate company estimates- Sensitivity to the economic cycle, which can distort perceptions regarding the indicator- Complex comparison of technology between sectors (product/service life cycle different between sectors in a more pronounced way)- By definition, it is important to specifically consider the concept of a new market |
| Output | New product announcement | - Easy to collect- No need to fill out questionnaires- Possibility of segmenting the type of innovation (new products, improvements in existing products or differentiation of products)- The degree of innovation complexity can be measured according to a particular criterion- Allows one to incorporate innovations of small companies with relatively low cost of information- Allows time-based tracking of information- A wide range of sectors can be incorporated- Data can be disaggregated at a regional level | - New announcements are given by companies, without any kind of ballast- Information is generated by the number of journals covering the information- Cross-country comparison is linked to the proportion generated in a given scope in relation to the total- Limitations to adopt statistical procedures for sampling and population- Criteria for data collection and processing by journals may influence outcome- Only published products and services innovations are measured, i.e., no process innovations are reported- Companies may adopt other channels of dissemination/publication |
| Output | People engaged in knowledge-intensive activitiesb | - Information on human capital allocation generating knowledge in the business scope, regardless of their educational level- Sources of intensive activities include: a) services provision of directly to consumers, b) provision for the innovative activities by other companies- Allows confirmation whether whether knowledge is distributed between the organization's areas/departments | - Does not measure the degree of contribution of the knowledge- Subjectivity in the identification of the knowledge generated for the organization- Difficulty in indicating which type of innovation it refers to- Complexity to measure activities exclusively for consumers and for other companies, in the case of a single department in the organization |
| Output | Protection of innovation during the research periodb | - Measures company initiatives to protect innovation during its development- Covers both services and manufacturing companies when considering the application for patents, trademarks, copyrights, or other measures seeking to protect innovative ideas- Allows protection initiatives at small companies to be identified | - Identifies only the initiative, but not the outcome of the application for innovation protection- More than one protection mechanism can be linked to the same innovation- Possibility of centralizing information at the parent company- Possible distortion in cross-country comparison by the innovation protecting systems existing in each of them |
| Output | Introduction of innovationb | - Identifies the of innovation achievements under different forms, for services as well as for manufactures, and across sectors- Confirms innovation in four dimensions: products, processes, marketing, or organization- Captures both new and incremental innovations- Allows identification of the type of innovation associated with each of the organization's departments | - Does not measure innovation relevance- Subjectivity when defining incremental innovation- Depends on questionnaires- Restricted comparability between indicators of innovation introduction (for example, whether processual innovation was more relevant than the organizational one)- There is no information ballast because the informant is the company itself |
Table compiled with the aid of the following works: Archibugi (1992); Arundel and Kabla (1998); Beneito (2006); Blind et al. (2003); Brouwer and Kleinknecht (1996); European Commission (2017); Griliches (1998); Griliches and Pakes (1980); Hagedoorn and Cloodt (2003); Hipp and Grupp (2005); Hollanders and Janz (2013); Janger et al. (2017); Kanerva et al. (2006); Kemp et al. (2003); Kleinknecht (1993); Kleinknecht et al. (2002); Mansfield (1986); Mendonça, Pereira, and Godinho (2004)); Michel and Bettels (2001); Narin and Olivastro (1988); Raffo and Lhuillery (2008); Nelson and Winter (1982); OECD (2015); Velling (2002).
Innovational results may be either visible (new-product development, or existing-product improvement), or invisible (processual improvements for increasing efficiency). However, output indicators tend to point out to product rather than process innovation (Kemp et al., 2003). In the services segment, process innovations are understandably difficult to dissociate from the service generated, which makes measurement more complex (De Jong, Bruins, Dolfsma, & Meijaard, 2003). Output indicators may thus supplement input ones, offering a replicable measurement system for innovation outcomes, of consequently reliable sources (it does not depend on company disclosure), and returning easily quantifiable, diachronically comparable values (Link, 1995). However, this last observation prioritizes applicability to manufactures, since some service indicators do not share this characterization.
The outputs for service companies therefore show particularities stemming from a wide range of other characteristics, such as: immateriality/intangibility; simultaneity; perishability; heterogeneity; interactivity; and co-production.
The points addressed in the table can be summarized in some aspects: (a) Input indicators represent the company's innovation efforts, that is, they comprise the available information on expenses, human capital allocation, or innovative initiatives; (b) On their part, intermediate indicators share features such as public availability of information, and the highest level of detail regarding innovation types; (c) output indicators can measure different aspects of the innovative outcome, that is, they determine the degree of innovation generated, and often the department linked to the outcome. A combination of the three types of innovation is appropriate insofar as one set of indicators captures different factors from the others, and their combination involves a broader perspective of organizational innovation.
However, combining the three indicator perspectives over a relatively long time period amounts to a challenge. Indicators depending on questionnaires tend to be temporally more restrictive, although broader in their organizational innovation bias. In fact, the choice of only one type, whether an indicator of input, intermediate or output, appears as insufficient and may entail underestimation of innovation in the organization.
Immateriality/intangibility refers to items that cannot be apprehended by the physical senses. Simultaneity concerns the act of concurrently producing and consuming the service, i.e., no segmentation exists between means of production and consumption. Perishability ensures that services are used as offered, i.e., there is no possibility of storage, return, sale or even subsequent use. Heterogeneity refers to a potential variability in the quality parameters of the services, since they are transmitted from people to people (Aurich, Mannweiler, & Schweitzer, 2010). Interactivity is the relationship between consumers and suppliers, which can translate into different modalities, especially the information exchanges regarding the issue in question, as well as the compilation of consumer-approved guidelines and recommendations (Djellal & Gallouj, 2016; Miles, 2010). Co-production is related to interactivity, as illustrated by the scenario in which suppliers and customers interact and cooperate to generate the best outcome (Miles, 2010).
The list of indicators comprises: ad-hoc innovation (new solutions to existing problems, such as technological platforms); marketing innovation (constitution of alliances, brand strengthening, partner relations); and organizational innovation (organizational methods co-producer customers, new services combinations, or managerial control standardization) (Gallouj, 2002; Miles, 2004; Morrar, 2014).
Regardless of the sort of indicator, another important consideration concerns information confidentiality (Kleinknecht et al., 2002). Because of its strategic, it is rarely conducted in detail, which hinders a better understanding of the phenomenon. Regarding questionnaires, examples of typical difficulties are errors during the completing process; the provision of incorrect information (verifying the data is impossible); or the respondent's subjectivity, especially in closed-end questions with scale levels.
Regarding the choice of a single indicator to measure innovation, Hagedoorn and Cloodt (2003) argue that several studies opt for a specific one, even considering the limitations this may entail. Along the same lines, Arundel and Hollanders (2005), and Kim (2013), specify that indicator choices may not adequately represent company innovation, even if restricted to a specific sector or country, as well as cross-country comparisons. Phan (2013) ponders another relevant argument about the use of input indicators only, since the increase thereof does not necessarily imply outputs, that i.e., expenditures will not necessarily produce outcomes in terms of output.
If the choice of a single indicator can be a limiting factor to assess the real effect of business innovation, it is also possible to distinguish advantages and disadvantages in the case of multidimensional indicators. Among the positive aspects, one may highlight the mitigation of distortions resulting from the use of a single indicator, which results in a broader understanding of the concept of innovation. Moreover, it identifies the contribution associated to each of the indicators comprised by the multidimensional variable. However, among the negative aspects are the structural complexity and potential limitations in terms of data comparability with other databases (Amara, Landry, & Doloreux, 2009; Hagedoorn & Cloodt, 2003).
Under this framework, the construction of specific measurements with two or more indicators seems feasible, through consideration of the sample features, the particularities of each country and industry, among other factors. Nevertheless, this construction may limit our understanding of the phenomenon itself. In other words, studies may present cases so particular that any generalizations regarding the method for innovation measurement or diachronic data collection seem difficult.
DiscussionPhan (2013) assures that most of the existing research in our field of interest involves a combination of input and output indicators, focusing on specific areas, i.e., segments, such as high technology or services, among others. Morrar (2014) also argues that, until recently, the services industry was seen as a segment of non-innovative nature, or innovative only regarding technology use, as a result of its conceptual approach to assimilation. Despite the importance of the services sector for worldwide economy, there is a certain limitation in the existing studies seeking to understand innovation in services. Measurement of industrial innovation is therefore more consolidated in economic literature than the one regarding services innovation (De Jong & Vermeulen, 2003). From a sectoral perspective, scholarly work acknowledges differences between the activities performed by manufacturing and services companies, which also requires particularities in the treatment of cross-sector innovation (Miles, 2001). However, the essential approach to innovation is the industrial segment, with a focus on both process and product innovation, resulting in a primary understanding of manufacturing within services companies (Morrar, 2014).
Regarding manufacturing companie, there is a natural, evolving tendency in terms of innovation, whereas service companies do not necessarily display such characteristic, so that the logic of innovation can be considerably different (Damanpour et al., 2009). Accordingly, a comparison exclusively involving indicators of the flow between the services and manufacturing industries may lead to distortions, since inventory innovation at manufacturing companies tends to be an important innovative component. Discussions at a sectoral level are particularly relevant for indicator choice, since, according to some authors, a large part of the outcomes generated by innovation are not patentable – a scenario implying distortions, particularly in the services industry (Arundel & Kabla, 1998; Janger et al., 2017). This stems from the fact that patents are more suitable for industries, while registered trademarks are more frequent among services companies, because of their differing features. Technical and scientific knowledge, a long-period process, is a prerequisite for patent development, whereas trademark introduction does not require as much knowledge of this nature; it may be faster for market insertion and does not necessarily involve patenting (Kanerva et al., 2006).
On the other hand, patents may also exhibit significantly different propensities across different industries or sectors, especially those positioned in high-tech segments. Hence, these sectors tend to include a considerable number of patents in relation to the others, and measuring difficulties may hamper sectoral analysis, possibly generating bias in empirical evidence (Janger et al., 2017).
Similarly, in the case of R&D expenditure, this being the only indicator involved, the real effect of innovation may be distorted. Since this indicator comprises a scarce portion of the total innovation expenditure, fixed-asset investments by organizations tend to score significant values for this variable, characterized by product innovation. Such criterion favors the industrial segment over the services one, underestimating its effect on the latter (Brouwer & Kleinknecht, 1997; Kleinknecht et al., 2002).
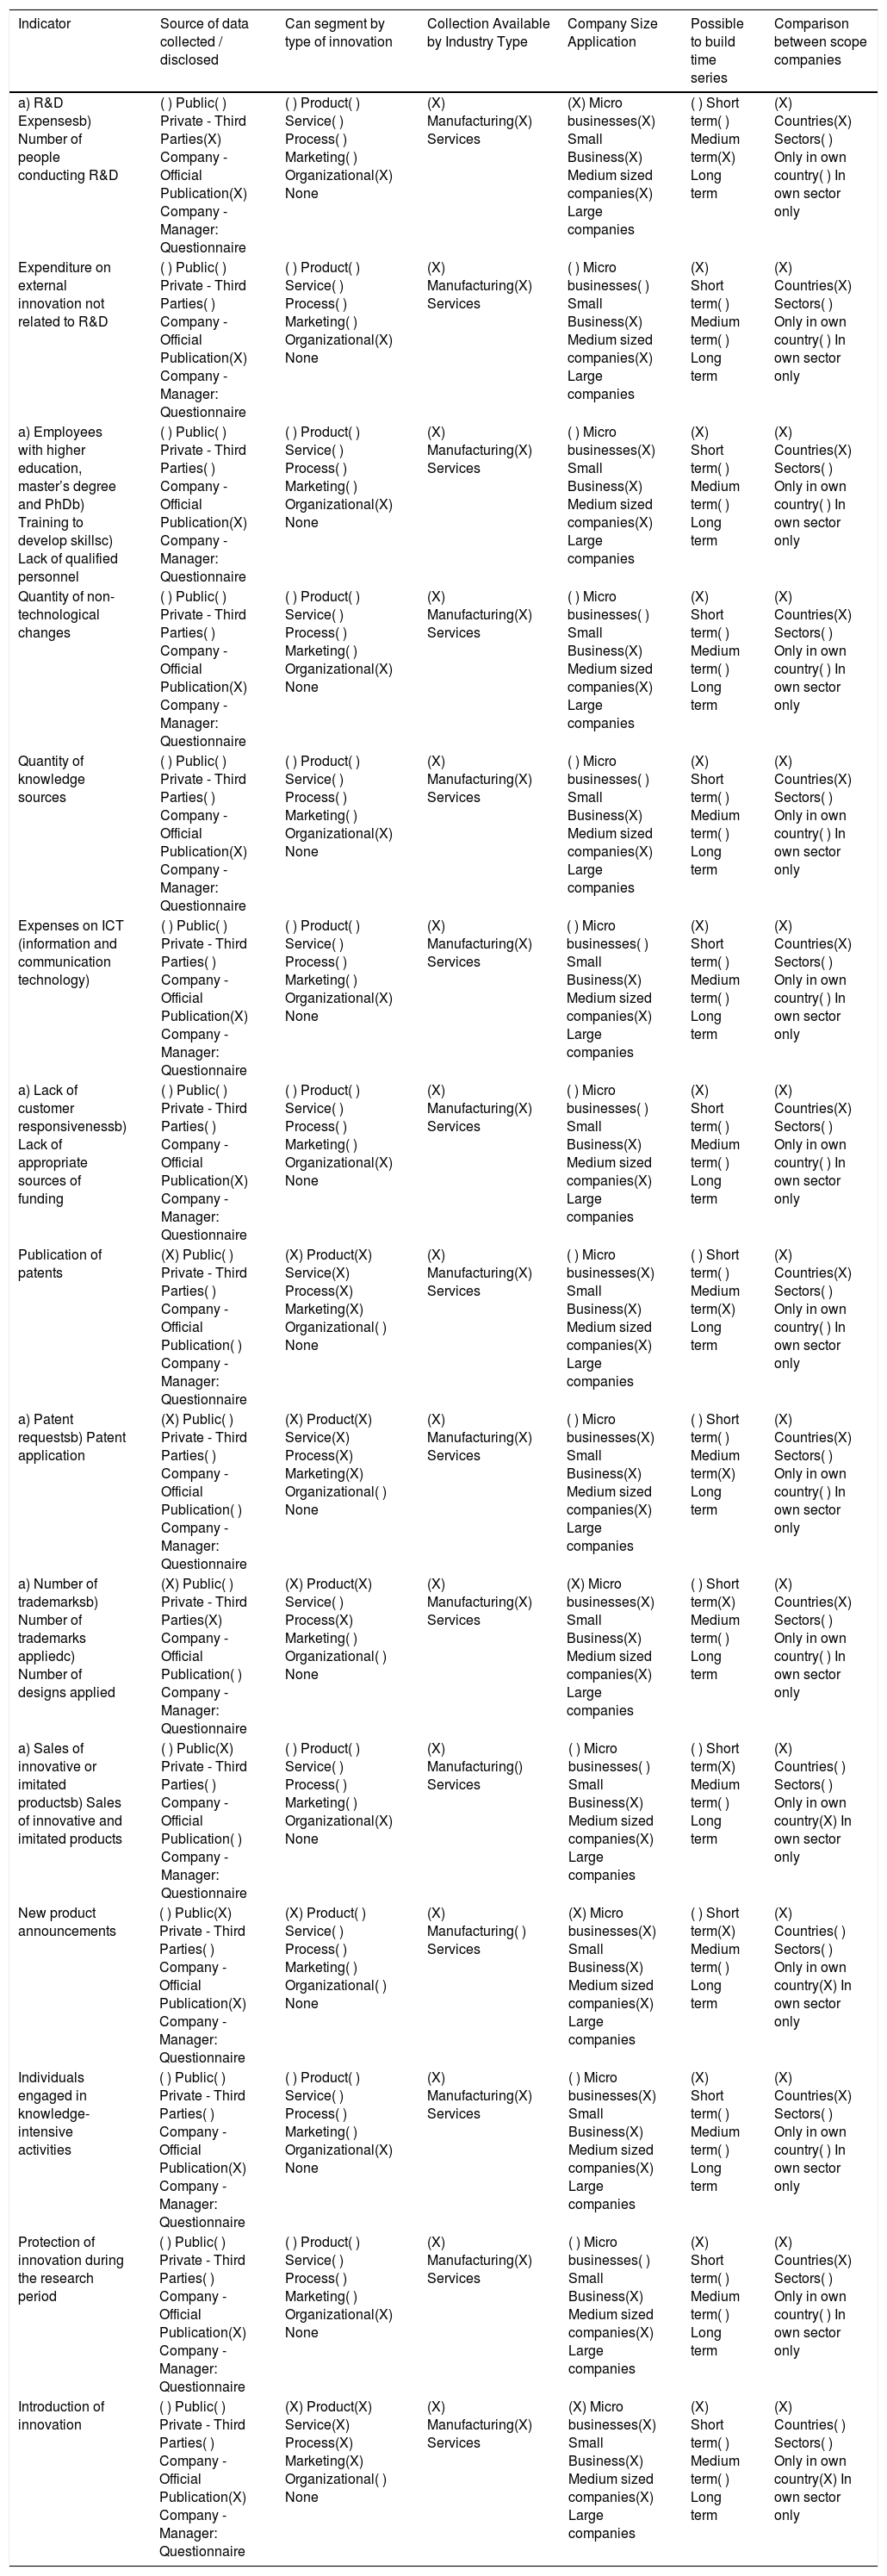
Table 4 lists the present constraints for some groups of organizational innovation indicators, and ponders favorable factors for their comparative use.
Constraints for groups of indicators.
| Indicator | Source of data collected / disclosed | Can segment by type of innovation | Collection Available by Industry Type | Company Size Application | Possible to build time series | Comparison between scope companies | ||||
|---|---|---|---|---|---|---|---|---|---|---|
| a) R&D Expensesb) Number of people conducting R&D | ( ) Public( ) Private - Third Parties(X) Company - Official Publication(X) Company - Manager: Questionnaire | ( ) Product( ) Service( ) Process( ) Marketing( ) Organizational(X) None | (X) Manufacturing(X) Services | (X) Micro businesses(X) Small Business(X) Medium sized companies(X) Large companies | ( ) Short term( ) Medium term(X) Long term | (X) Countries(X) Sectors( ) Only in own country( ) In own sector only | ||||
| Expenditure on external innovation not related to R&D | ( ) Public( ) Private - Third Parties( ) Company - Official Publication(X) Company - Manager: Questionnaire | ( ) Product( ) Service( ) Process( ) Marketing( ) Organizational(X) None | (X) Manufacturing(X) Services | ( ) Micro businesses( ) Small Business(X) Medium sized companies(X) Large companies | (X) Short term( ) Medium term( ) Long term | (X) Countries(X) Sectors( ) Only in own country( ) In own sector only | ||||
| a) Employees with higher education, master’s degree and PhDb) Training to develop skillsc) Lack of qualified personnel | ( ) Public( ) Private - Third Parties( ) Company - Official Publication(X) Company - Manager: Questionnaire | ( ) Product( ) Service( ) Process( ) Marketing( ) Organizational(X) None | (X) Manufacturing(X) Services | ( ) Micro businesses(X) Small Business(X) Medium sized companies(X) Large companies | (X) Short term( ) Medium term( ) Long term | (X) Countries(X) Sectors( ) Only in own country( ) In own sector only | ||||
| Quantity of non-technological changes | ( ) Public( ) Private - Third Parties( ) Company - Official Publication(X) Company - Manager: Questionnaire | ( ) Product( ) Service( ) Process( ) Marketing( ) Organizational(X) None | (X) Manufacturing(X) Services | ( ) Micro businesses( ) Small Business(X) Medium sized companies(X) Large companies | (X) Short term( ) Medium term( ) Long term | (X) Countries(X) Sectors( ) Only in own country( ) In own sector only | ||||
| Quantity of knowledge sources | ( ) Public( ) Private - Third Parties( ) Company - Official Publication(X) Company - Manager: Questionnaire | ( ) Product( ) Service( ) Process( ) Marketing( ) Organizational(X) None | (X) Manufacturing(X) Services | ( ) Micro businesses( ) Small Business(X) Medium sized companies(X) Large companies | (X) Short term( ) Medium term( ) Long term | (X) Countries(X) Sectors( ) Only in own country( ) In own sector only | ||||
| Expenses on ICT (information and communication technology) | ( ) Public( ) Private - Third Parties( ) Company - Official Publication(X) Company - Manager: Questionnaire | ( ) Product( ) Service( ) Process( ) Marketing( ) Organizational(X) None | (X) Manufacturing(X) Services | ( ) Micro businesses( ) Small Business(X) Medium sized companies(X) Large companies | (X) Short term( ) Medium term( ) Long term | (X) Countries(X) Sectors( ) Only in own country( ) In own sector only | ||||
| a) Lack of customer responsivenessb) Lack of appropriate sources of funding | ( ) Public( ) Private - Third Parties( ) Company - Official Publication(X) Company - Manager: Questionnaire | ( ) Product( ) Service( ) Process( ) Marketing( ) Organizational(X) None | (X) Manufacturing(X) Services | ( ) Micro businesses( ) Small Business(X) Medium sized companies(X) Large companies | (X) Short term( ) Medium term( ) Long term | (X) Countries(X) Sectors( ) Only in own country( ) In own sector only | ||||
| Publication of patents | (X) Public( ) Private - Third Parties( ) Company - Official Publication( ) Company - Manager: Questionnaire | (X) Product(X) Service(X) Process(X) Marketing(X) Organizational( ) None | (X) Manufacturing(X) Services | ( ) Micro businesses(X) Small Business(X) Medium sized companies(X) Large companies | ( ) Short term( ) Medium term(X) Long term | (X) Countries(X) Sectors( ) Only in own country( ) In own sector only | ||||
| a) Patent requestsb) Patent application | (X) Public( ) Private - Third Parties( ) Company - Official Publication( ) Company - Manager: Questionnaire | (X) Product(X) Service(X) Process(X) Marketing(X) Organizational( ) None | (X) Manufacturing(X) Services | ( ) Micro businesses(X) Small Business(X) Medium sized companies(X) Large companies | ( ) Short term( ) Medium term(X) Long term | (X) Countries(X) Sectors( ) Only in own country( ) In own sector only | ||||
| a) Number of trademarksb) Number of trademarks appliedc) Number of designs applied | (X) Public( ) Private - Third Parties(X) Company - Official Publication( ) Company - Manager: Questionnaire | (X) Product(X) Service( ) Process(X) Marketing( ) Organizational( ) None | (X) Manufacturing(X) Services | (X) Micro businesses(X) Small Business(X) Medium sized companies(X) Large companies | ( ) Short term(X) Medium term( ) Long term | (X) Countries(X) Sectors( ) Only in own country( ) In own sector only | ||||
| a) Sales of innovative or imitated productsb) Sales of innovative and imitated products | ( ) Public(X) Private - Third Parties( ) Company - Official Publication( ) Company - Manager: Questionnaire | ( ) Product( ) Service( ) Process( ) Marketing( ) Organizational(X) None | (X) Manufacturing() Services | ( ) Micro businesses( ) Small Business(X) Medium sized companies(X) Large companies | ( ) Short term(X) Medium term( ) Long term | (X) Countries( ) Sectors( ) Only in own country(X) In own sector only | ||||
| New product announcements | ( ) Public(X) Private - Third Parties( ) Company - Official Publication(X) Company - Manager: Questionnaire | (X) Product( ) Service( ) Process( ) Marketing( ) Organizational( ) None | (X) Manufacturing( ) Services | (X) Micro businesses(X) Small Business(X) Medium sized companies(X) Large companies | ( ) Short term(X) Medium term( ) Long term | (X) Countries( ) Sectors( ) Only in own country(X) In own sector only | ||||
| Individuals engaged in knowledge-intensive activities | ( ) Public( ) Private - Third Parties( ) Company - Official Publication(X) Company - Manager: Questionnaire | ( ) Product( ) Service( ) Process( ) Marketing( ) Organizational(X) None | (X) Manufacturing(X) Services | ( ) Micro businesses(X) Small Business(X) Medium sized companies(X) Large companies | (X) Short term( ) Medium term( ) Long term | (X) Countries(X) Sectors( ) Only in own country( ) In own sector only | ||||
| Protection of innovation during the research period | ( ) Public( ) Private - Third Parties( ) Company - Official Publication(X) Company - Manager: Questionnaire | ( ) Product( ) Service( ) Process( ) Marketing( ) Organizational(X) None | (X) Manufacturing(X) Services | ( ) Micro businesses( ) Small Business(X) Medium sized companies(X) Large companies | (X) Short term( ) Medium term( ) Long term | (X) Countries(X) Sectors( ) Only in own country( ) In own sector only | ||||
| Introduction of innovation | ( ) Public( ) Private - Third Parties( ) Company - Official Publication(X) Company - Manager: Questionnaire | (X) Product(X) Service(X) Process(X) Marketing(X) Organizational( ) None | (X) Manufacturing(X) Services | (X) Micro businesses(X) Small Business(X) Medium sized companies(X) Large companies | (X) Short term( ) Medium term( ) Long term | (X) Countries( ) Sectors( ) Only in own country(X) In own sector only | ||||
Note 1: Company size refers to the amount of individuals employed in an organization. According to the official Eurostat classification, they have been classified as follows: a) micro enterprises, up to ten people; b) small companies, with between ten and 49 employees; c) medium-sized companies, between 50 and 249 employees; d) large companies, above 250 employees.
Note 2: In this case, a period between one and three years has been considered short-term; between three and seven years, medium-term; and over seven years, long-term.
As can be observed in our table, an extremely small number of indicators rely on the general public to obtain their data, occasionally of official nature, collected by the means of special tracking systems, and subject to third-party verification (consultants, accounting firms, or others). Indicators with these characteristics are useful because they have an effective information verification ballast. Indeed, if collected through manager-distributed questionnaires, the informational outcome may contain some bias given the lack of an appropriate verification process. On the other hand, questionnaire-based indicators turn out to be broader in scope since they measure either organizational innovation or its potential for realization in a more specific way.
Most indicators are constrained by an underlying perception of the innovation typology targeted. Such condition is restrictive because typologies allow companies to deploy specific investment strategies and conduct follow-up on the investments made. Their identification in both intermediate and output indicators tends to be simpler since they constitute the actual outcome.
As for the type of industry, most indicators can be applied to both manufacturing and services. However, information turns out to be more readily available to manufacturing companies than to services ones, since their patent publication data and R&D disbursements, for instance, provide fairly useful information in that sense. This phenomenon may partly be due to the greater difficulty experienced by services companies in collecting information. Indeed, in contrast with manufacturing, is the speed at which innovation dynamics operates in services discourages services companies from keeping track of each step in the innovative process. Finally, the inferior indicator values scored at the services segment may also be clarifying in this respect.
For structural reasons, smaller-size companies also find increasing difficulty in measuring innovation indicators, as can be seen both in terms of patent figures and technological-change tracking. Although appropriate indicators might be devised for this purpose, their lack of representativeness may be discouraging when confronted with the related costs. On the other hand, medium and large companies are able to build a superior number of indicators, and thus collect more data from innovation investment returns.
Most indicators are available only for a short period, expected to fall below the five-year threshold. Although this does not make it impossible to achieve indicators comprising broader time periods, they generally remain unavailable over time for comparative purposes to a substantial amount of companies. In this case, the data regarding patent publication and R&D disbursements are generally available for longer periods and broader companies. The relevancy of the time factor lies in that innovation advances are progressive in nature.
Most of the indicators listed above allow researchers to draw comparisons on the grounds of cross-country and cross-sector company data. This feature is crucial in that it facilitates the assessment of company innovation performance both within and across different sectors, which contributes to the monitoring of public financing and subsidy policies. Cross-country comparison is equally important in determining potential connections between the evolution of technology and specific factors such as local regulations and laws, institutional or even economic conditions.
Therefore, the indicators' univariate application may be restrictive, since innovation itself is broad and may features from the industry or sector where it takes place, as well as from company features like size. For example, measuring innovation at a fintech differs significantly from conducting the same procedure on a food company, and choosing a single indicator may be restrictive for analysis.
In order to mitigate bias potential and increase the effectiveness of organizational innovation, laying out a set of indicators is highly recommended. However, indicator pertinence strongly depends on the researcher's purpose; the availability of data; the period under analysis; and the method employed for empirical research. The resulting process may be relatively complex, which nevertheless translates into increasing exhaustivity, as it seeks to fill the existing gaps in terms of innovation investment and its outcome.
On the other hand, questionnaire-based indicators (inputs and outputs) generally prove to be adequate tools to identify various innovation typologies, especially the incremental and tacit ones. However, this entails an increasing complexity for indicator development and aggregation, its application constrained to longer periods (usually targeting conjunctural phenomena).
Another challenge is the measurement of output indicators in services companies. With their regular activity, companies in this segment continuously subject their organizational systems to alterations of intangible nature, understandably different from those experienced in the industrial sector, where tangible goods are produced (Gallouj, 1998; Morrar, 2014). Thus, if manufacturing organizations encounter a considerable degree of difficulty in measuring part of the productivity with intangible assets, services companies are subject to a superior degree of complexity, given their proneness towards design, marketing, or organizational investments over formal R&D ones. Crucial differences stem from the increasingly volatile, heterogeneous, and more accentuated innovation characterizing services firms (Melvin, 1995; OECD, 2005).
Since indicators measure different aspects of innovation, it is important for researchers to bear in mind the types information actually subject to retrieval. Hence, R&D expenses are fairly illustrative of a company’s innovative efforts; patents stand for the levels reached in innovative production; patent citations, on their part, are indicative of an innovative product's the quality; while product announcements objectively signal the level of product innovation (Kleinknecht et al., 2002). Therefore, when possible, all input, throughput, and output indicators speak particularly clearly for the effectiveness of firm innovation.
Concerning technological progress, Morrar (2014) states its crucial relevance for manufactures, while other aspects are underscored as quintessential for services firms, including non-technological effects. Therefore, the importance of adopting multi-dimensional indicators may be discussed in the means of covering innovation-related effects from various viewpoints. Several input indicators have been actually proposed so far, but the amount of available studies linking input and output is still limited, hindering an in-depth analysis of innovation impact (Gold, 1973, Phan, 2013). Studies combining input and output indicators can definitely provide a better understanding of innovation.
However, even though the most recent approach to indicator sets – synthesis – seems to account for a large part of companies' innovative phenomena, deploying such a wide range of indicators may imply increasing collection-related costs; constraints for cross-company application of a single set of indicators; or even extended-period availability. Therefore, researchers' strategies are fundamental in order to obtain the best results considering the restrictions encountered, either through limiting the scope of each indicator, or devising effective indicator choice procedures.
Data surveys regarding R&D investment should take into consideration that it tend to represent a modest fraction of the company’s innovative spending, therefore lead ing researchers to assume that impact display will limited if this indicator is the sole criterion applied. Additionally, services R&D may differ from the manufacturing one, both quantitatively and qualitatively, since the human factor has been proven essential in services demanding highly developed skills from their employees (Gadrey, 1996; Gallouj, 2002; Kanerva et al., 2006; Meisenheimer, 1998; OECD, 2001). Another affecting the R&D expenditure indicator more intensely in the services segment than in manufacturing firms is financial restriction (OECD, 2005). Hence, the combination of R&D with a proportional limitations in terms of financial sources may overcome this problem.
For comparisons between companies of different sizes or in different industries, the use of proportional data is recommended, since resource capacities are much higher in large companies. Similarly, R&D intensity may be determined by the specific features of some industries, such as the pharmaceutical industry, vehicle assemblers, and personal hygiene/health. Nevertheless, this indicator is recommended for chronologic analyses, aimed at registering the effects of the learning process, although it may be advisable to combine it with some output indicator in the means of accounting for allocated resource deployment. Similarly, when combined with another output indicator, it may also be valid for cross-country comparison since it implies standardization (same-currency conversion of amounts).
The existing research making use of patent data has succeeded in identifying several aspects favoring a systematic tracing of firm innovative evolution. If we are to validate the hypothesis that innovation resource allocation takes time to generate returns for companies, as well as the dissemination of returns on a temporal basis, time must then be considered key to capturing such dynamics, especially when the outcome of a given innovative process is only perceivable in later periods. Considering this is an intermediate indicator, adding a delivery indicator as an assessment criterion for innovation-effort outcomes appears to be pertinent.
On the other hand, patent registrations tend to be lower at service companies than in the manufacturing sector, trademark registration being a privileged method of registration in the services segment (Blind, Edler, Schmoch, & Hipp, 2003; Hipp & Grupp, 2005; Kanerva et al., 2006). For registered trademark databases and designs, the data available are still relatively small. Cross-country or even cross-region comparison is thus feasible thanks to a standardization process on the grounds of some specific classification criteria for patent registration. From a sectoral perspective, systematic activity registration may be fairly useful, though limited for analytical purposes depending on the features of the data available, (Arundel & Kabla, 1998), and Beneito (2006). In other words, smaller companies generally do not carry out patent registrations, so there tends to be a concentration at medium and large companies, which in turn comprises most of the high-tech companies or monopolies/oligopolies in our sample. Innovation typologies may constitute another limiting factor for sampling purposes, since product registrations tend to prevail, indicating a trend towards industry-generated data.
If the research is intended to make use of product advertisement information, the use of an output indicator is in place, while input indicator deployment is seen as pertinent to verify both the outcome generated by such innovative effort, and its nature either incremental or radical. A time-based trajectory may be built up from this information, yet this requires a certain amount of data treatment by the researcher for database preparation, as well as industry or sectoral characterization. In the services sector, such characterization may be more restrictive for some companies.
The main difficulties encountered here lie in the necessary monitoring of several journals for data collection, subject as it must be to modifications in journal criteria. Additionally, companies might not report such information, leading to sample size restrictions. Data access may also be more constrained in certain countries, especially for smaller companies.
The main purpose of this research being an in-depth study of inputs and outputs, especially for services companies, the practice of questionnaires is considered most adequate here, yet particularly complex. This is due to the difficulty encountered in measuring inputs and outputs, including innovation typology variations across sectors, on the grounds of their specificity and profuseness (Tether, 2003). For example, innovation by technical-assistance firms specializing in mobile telephones may differ from that by tourism firms, yet both belong to the services segment. Consequently, questionnaires may be the most appropriate method to identify different types of innovative activities (product, process, design, marketing), since it is open to previous treatment by the researcher, which is in contrast with the rigidity of other indicators. On the other hand, small and medium-sized firms turn out to be the obvious target, mainly due to data access restrictions by large companies. In studies avoiding specific sector targeting, the acknowledge potential for service-company concentration is higher, since companies in this segment require a lower amount of resources for their activities.
The main difficulties lie, firstly, in to the measurement of the evolving patterns displayed by innovation (usually, data comprise either a specific point in the researcher's timeline, or a fairly short period); secondly, in sectoral identification (a wider sector coverage requires questionnaire adjustments through appropriate indicators); and finally, lack of cross-market and cross-country comparability with similar-profile companies. Also regarding questionnaire layout, Wengel and Lay (2000) discuss the importance of avoiding binary questions regarding organizational innovation. The argument is that it may be important to identify not only such innovation, but also its potential alterations and generated impact. Such aspect must be appropriately addressed by the researcher.
The concepts, definitions, and measures presented and discussed here represent a marginal part of our survey regarding innovation in organizations. By principle, each theoretical element is portrayed in at least one measurement profile within the indicator list, which fulfills one of main goals proposed by this research.
However, other classifications or indicators not listed in this paper may be also of interest, since measurement variations undergo frequent revisions in order to better account for the targeted phenomena. Therefore, they should be revisited whenever possible. Regardless of indicator choice, the researcher will always encounter some type of limitation.
Quantitative and qualitative indicators entail both advantages and disadvantages. Lhuillery et al. (2016) argue that the qualitative indicators provided by different companies through questionnaires may portray similar scenarios, while not actually implying significant differences in terms of innovation. If companies report innovation in their respective production processes, then their individual productivity may substantially differ from that of others, even when both have opted for the same innovative procedure according to our indicators.
Therefore, it is particularly useful to take two aspects into account. First, measuring innovation is already a difficult task in itself, and creating a single indicator containing elements of both input and output factors is even more complex (Sundbo, 2017). The researcher’s challenge is precisely to satisfy to the utmost the parameters of his or her research in the field of innovation, while avoiding distortion on the perception of innovative phenomena. The second involves the fact that indicator use, rather than actual data, can lead to difficulties in estimating the effects of innovation (Lööf, Heshmati, Asplund, & Naas, 2001). This suggests that binary formulations may easily limit the effect of innovation, beyond the the individual's potential subjectivity.
Consequently, it seems highly recommendable to observe the nature of the measurement strategy chosen to clarify the type of innovation under study, and the extent to which it responds to the proposed objective. Indicator choice may already carry an initial bias in terms of disadvantages, which, though only in some cases, may be circumvented by incorporating complementary indicators. Both underestimating and overestimating innovation effects on an organization may create distortions reflecting the level of investments, expenditure, and financing. Hence, avoiding this scenario whenever possible is fundamental in order to avoid misleading financial and strategic decisions. Whenever possible, statistical criteria may be validly adopted to better understand the relationships involved and thus isolate possible effects, whether industrial or temporal. Regarding input, throughput, and output indicators, a wide range of available typologies underscores their appropriateness to account for a more general perception of innovation at organizations, which implies a preference for multidimensional measures over uni-dimensional bases given their higher measurement complexity.
In terms of the limitations acknowledged in the course of this research, any future discussions may find it useful to conduct a systematic review of the available literature providing empirical evidence on organizational innovation across different contexts and periods. This should lead to a clearer understanding of the potential bias encountered in surveys as a result of indicator choice, while facilitating a more adequate and coherent judgement of the constraints affecting our results. Moreover, such review should encourage the identification of uni-dimensional or multidimensional indicators choice prevalence, as well as the extent of potential result generalization on the grounds of innovation typology, or even industry and sector.
Another crucial point concerns organizational innovation as such. This paper has presented and discussed arguments for 26 relevant indicators already found in the existing literature, but others could be analyzed in future research.
Lastly, we believe to have open a fruitful discussion on the potential appropriateness of the aforementioned indicators in order to measure innovation at organizations. Additionally, a debate has been brought up on the extent to which data collection, treatment, and availability may hinder a proper understanding of innovation.
Final considerationsThe goal of our research has been the identification and discussion of the pros and cons entailed by the application of organizational innovation indicators, as well as of an effective deployment system in terms of sector, company size and time constraints. Although our overall objective is believed to have been achieved, a set of final considerations appears to be in place for this final section.
Indeed, devising innovation indicators for companies is not trivial. Indeed, from a conceptual standpoint, different approaches have been identified in the related literature, as well as specific definitions regarding both manufacturing and services organizations. Among them, the particular approach seeking to involve innovation premises in services-oriented manufacturing, while adding certain elements specific to this segment, enjoys today wide recognition in Academia. In this way, those studies aimed at measuring innovation both from an input and output perspective (throughputs) are thus far the most accurate in their approximation to real innovation outcomes. However, a broader periods for data consideration are mandatory to truly verify the effects of innovation over time as a learning process, as well as the possibility of drawing cross-sector, or even cross-region and cross-country comparisons.
The existing scholarly work doubtlessly displays considerable efforts to account for the evolution experienced by innovation measuring systems at companies. Indeed, some of those measurements have succeeded in identifying most of the companies' innovative dimensions, which may lead to their application for validating all innovation-related investments. However, some difficulties persist both in the indicators' technical nature and in the detection of certain innovation types in companies with highly intangible activities, due to today's new market dynamics. Advances in indicators for the services area are widely known through recent studies, but the difficulty of building a consolidated and standardized database of business information, such as patent databases, remains a challenge.
In sectoral terms, especially in services, difficulties are still very present. The use of case-sensitive indicators may generate the best measuring results for each sector, yet it hinders progress from a more general, comparative scope. Devising standardized indicators coupled with adequate statistical techniques may be an alternative to isolate the effects of innovation for such cases. Similarly, some form of statistical treatment can be conducted for companies of various sizes, whereby a broad set of innovation aspects can be measured, and the effects isolated, thereby identifying whether innovation is more representative for the outcome of small, medium or large companies.
It is worth noting the presence of a growing group of research studies aimed at measuring innovation at small companies, as a result of the advances made by scholarly works on indicator devising. However, many of these studies become particular cases, fitting their outcomes to the context of the specific set of companies in their sample. It is relevant to encourage research projects of this nature not only to measure the specific effects of innovation, but also, in a broader context, to analyze their sustained evolution.
Moving on to other issues, if we are to discuss the contribution of innovation funding in a broader way, including smaller companies, then it is pertinent to evaluate how fundamental innovation may be for medium- and long-term business organizational strategies, and whether it is conditioned not by the particular changes brought about by specific governmental incentives, or by the economic environment of the period in question.
The main limitations of the research lie in the choice of 26 relevant indicators from the existing works on organizational innovation, since several others exist. In future research, an interesting discussion may feature the relevant aspects of other groups of indicators. A Systematic review of empirical evidence using indicators of organizational innovation can also bring a better understanding of the constraints of these applied works, and discuss potential improvements, especially regarding the underestimation of innovation as primarily affecting one sector over another.
We are grateful to the Mackenzie Research Fund - MackPesquisa, linked to Presbiterian Mackenzie University, for granting resources for research development, as well as CAPES (Coordination for the Improvement of Higher-Level Personnel in Brazil) for encouraging research activities.