


An in-depth understanding of the relationship between innovation factor allocation, the institutional environment, and high-quality economic development can help us better comprehend how better productivity promotes high-quality, regionally coordinate, and balanced economic development. Using panel data of 30 provincial-level regions in China from 2011 to 2019, we explore the effect of innovation factor allocation on high-quality economic development and the moderating effects of different institutional environments. First, we construct a comprehensive indicator system for innovation factor allocation and a new model to calculate the weights of various indicators of innovation factors. Second, we apply TOPSIS and grey correlation to measure the level of innovation factor allocation, and construct a modified gravity model to generate a directed weighted spatial association network of this allocation as a spatial weight matrix. Finally, we use the spatial Durbin model to empirically test the spatial effects of innovation factor allocation on high-quality economic development under different institutional environments. We find that: First, innovation factor allocation significantly positively affects the high-quality development of the local economy, while it has negative spatial spillover effects on neighboring areas. The impact of different types of institutional environments on high-quality economic development exhibits an inverted “U” shape. China's institutional environment has not crossed the critical threshold of this “U" shaped relationship. Thus, different types of institutional environments can still effectively strengthen the role of innovation factor allocation in promoting high-quality economic development. In particular, the strengthening effect of online government is the strongest and its negative impact is the weakest. Overall, this study is of great significance for optimizing innovation factor allocation in various regions and promoting high-quality economic development.
From the outbreak of COVID-19 to the post-pandemic period, the deep integration of new-generation information technologies, such as artificial intelligence, big data, and the Internet, with the traditional economy have pushed China's economy into a new era of development. Simultaneously, we have also seen the impact of data on the digital economy and how the profound expansion of the set of production factors has significantly affected the transformation of China's productivity and production relations (Tao & Xu, 2021; Xu & Zhao, 2021a). Today, China's economy has entered a new era of high-quality development. However, problems of unbalanced and inadequate development remain primarily due to the structural imbalance in innovation factor allocation (Fan et al., 2021). Therefore, optimizing their allocation and maximizing their potential are the keys to achieving China's high-quality economic development. The 2023 “Global Innovation Index Report” shows that China ranked 12th globally in 2023 in innovation. However, it only ranked 61st on the sub-index of “institutional environment”,2which is far from the level of the other six sub-indices. New changes in the development stage, combined with the new impacts of technology and the industrial revolution, inevitably create strong demand for institutional innovation. Therefore, exploring the impact of innovation factor allocation on the high-quality development of the Chinese economy in a socialist market environment will undoubtedly provide insights to better stimulate the potential of innovation factors, promote their free flow and agglomeration, and promote the formation of a new pattern of high-quality economic development that is regionally coordinated and balanced.
Literature review and hypotheses developmentImpact of innovation factor allocation on high-quality economic developmentResearch on the impact of innovation factor allocation on high-quality economic development mainly focuses on two aspects. The first is the role of the optimal allocation of innovation factors in promoting high-quality economic development. Economic growth theory has posited that factors are the source of economic growth (Solow, 1956; Romer, 1986). Importantly, the connotation of optimizing factor allocation has gradually deepened and expanded from ordinary labor and capital (Wang & Yang, 2020) to technological and knowledge (Mcgrattan & Prescott, 2009; Innocenti et al., 2020; Peng & Tao, 2022; Xu et al., 2022; Yu et al., 2023), and now, includes data factors (Cong et al., 2021; Florez & Blind, 2020; Jones & Tonetti, 2020; Farboodi & Veldkamp, 2021; Cai & Ma, 2021). Schumpeter (1934) emphasized that technological innovation is the driving force of economic growth and believed that enterprise innovation activities lead to the flow of factors from low- to high-productivity enterprises, thereby improving the overall productivity level of the industry by eliminating inefficient enterprises (Acemoglu & Cao, 2015). Müller et al. (2018) used a common panel model and found that big data can improve the innovation performance of enterprises. Especially, they applied mathematical models to explore the impact of data on economic development (Cong et al., 2021; Florez & Blind, 2020; Jones & Tonetti, 2020; Farboodi & Veldkamp, 2021). The general belief is that factor mismatch will lead to the loss of economic efficiency and total factor productivity, thereby affecting high-quality development. Early research constructed mismatch framework from the perspectives of labor and capital (Hsieh & Klenow, 2009; Aoki, 2012; Restuccia & Rogerson, 2013; Brandt et al., 2013; Zhang et al., 2023), while others gradually incorporated other factors such as energy (Chen & Chen, 2017; Lu et al., 2022; Yang & Tian, 2023). Of course, there are other views. Cai and Ma (2021) believed that bit data can be a new production factor in the digital economy. While its low cost and sharing characteristics can help improve enterprise productivity, leakage and other issues can negatively affect economic growth.
Impact of the institutional environment on high-quality economic developmentMost research findings suggest that optimizing the institutional environment can significantly promote high-quality economic development; however, it must be adapted to a certain economic development environment (Liu et al., 2019; Ma et al., 2021; Liu et al., 2022). Some studies argue that strengthening the institutional environment can optimize the regional business environment and attract enterprises from other regions to enter the local market, thus further affecting the high-quality development of the economy (Du et al., 2012; Cai et al., 2019; Bhasin & Garg, 2020; Zhang & Kim, 2022). Liu et al. (2019) used a common panel model, and found that the “two-wheel-driven” system of technological and institutional innovation affects high-quality development by positively affecting total factor productivity. Liu et al. (2021) applied dynamic spatial Dubin model to analyze the effect of China's environmental regulations on high-quality economic development. Some studies have examined the relationship between innovation factors, the institutional environment, and economic development, but have paid less attention to spatial effects (Avom et al., 2020; Ahmed et al., 2021; Chen et al., 2021; Yang et al., 2022).
Measurement of innovation factor allocationThe measurement of innovation factor allocation is mainly reflected in the different measurement subjects, perspectives, and methods. Tao and Xu (2021) and Xu and Zhao (2021a)measured innovation factor allocation at the regional level in China, finding uneven allocation among regions. The measurement perspective reflects whether a single is or multiple factors are used. Meanwhile, the measurement methods differ in whether they utilize indicator synthesis or efficiency measurement methods. The indicator synthesis method mainly includes the entropy weight, TOPSIS, principal component analysis, and projection pursuit methods. Efficiency measurement includes nonparametric methods, represented by data envelopment analysis, and parametric methods, represented by random frontiers (Cruz-Cázares et al., 2013). Innovation factor allocation is mainly computed using indicator synthesis methods, such as analytic hierarchy process, entropy weight method, TOPSIS method, principal component analysis method, and vertical and horizontal grading methods (Liu et al., 2019; Tao & Xu, 2021).
Reviewing the literature on high-quality economic development and innovation factor allocation reveals that the indicator synthesis method is the usual method. However, most studies only consider the unilateral input of innovation factors, ignoring the fact that high-quality economic development at the current stage can serve as a reference for measuring the importance of innovation factors. Most studies support the spatial correlation of innovation factor allocation, but mainly adopt a traditional spatial econometric perspective based on a single innovation factor. There are few studies on high-quality economic development from the perspective of a comprehensive system using the entire network of innovation factors. Even fewer studies examine the impact of innovation factor allocation on high-quality economic development considering the institutional environment and comparing the moderating effects of different types of institutional environments.
Filling these research gaps, this work makes the following contributions: First, we construct a more robust and comprehensive indicator system for innovation factor allocation, as well as a new model to calculate the weights of various indicators of innovation factors. The study incorporates innovation factor allocation and high-quality economic development into a unified framework, and builds a “multi-input-multi-output” random forest regression tree model to measure China's innovation factor allocation index. Thus, we provide a way to the measure innovation factor allocation. Second, we construct a modified gravity model to generate a directed weight spatial association network of innovation factor allocation and use it as the spatial weight matrix. Thus, we extend the existing method of constructing the spatial weight matrix beyond traditional spatial metrology. Third, the spatial effects of innovation factor allocation on high-quality economic development under the adjustment of different institutional environments are studied, thereby enriching research on the impact of innovation factor allocation on high-quality economic development.
The remainder of this work is organized as follows: Section 2 presents the theoretical analysis on innovation factor allocation and institutional environment on high-quality economic development, as well as the research hypotheses. Section 3 outlines the research design, including the random forest regression tree model with multi-input-multi-output, selection of econometric models, and variable selection. Section 4 reports the results, further analysis, and robustness tests. Section 5 presents the conclusions of this study.
Theoretical analysisEconomic growth theory considers production factors to be a source of power for economic growth. In the traditional economic growth stage, traditional production factors such as simple labor and general capital are essential factors that play a major role in economic production. Meanwhile, in the high-quality economic development stage, the driving force of growth has changed from factor- to innovation-driven economic growth (Tao & Peng, 2018). Here, stimulating the potential of innovation factors is crucial. However, to fully leverage the innovation-driven effect, the “soft innovation” of institutional innovation, and “hard innovation” of scientific and technological innovation must be combined, while the supporting role of institutional innovation is also crucial (Liu et al., 2019). Therefore, the institutional environment, as the essential basis for innovation factors to realize their potential, can regulate their impact on high-quality economic development in China.
The impact of innovation factor allocation on high-quality economic developmentDue to the spatial mobility of innovation factors, the impact on high-quality economic development has spatial spillover effects, which is mainly reflected through knowledge spillover, dynamic optimization, and “gravitational interaction” effects (see Fig. 1).

The moderate flow of innovation factors within a region is conducive to knowledge spillovers (Almeida & Kogut, 1999), which can help underdeveloped regions catch up in economic growth and innovation (Cassar & Nicolini, 2008). With a large number of intermediate products and some final products in the economy, the intermediate output can be used for the production of final products and employed in the innovation production of the enterprise (Venables, 1996). Knowledge spillovers are formed when knowledge from a particular region is brought to surrounding regions during the flow of innovation factors between regions. The flow of human innovation factors between enterprises spreads the advanced knowledge and technology carried by human capital to the local area. This helps in performing R&D, and key breakthroughs of new products, technologies, and processes through investments in capital and technological innovation factors, thereby improving the technical level of local enterprises (Guo et al., 2023; Fan et al., 2021). Digital finance helps realize the digitization of assets through blockchain use, promotes the opening and sharing of financial resources among different entities, alleviates information asymmetry, and promotes regional innovation-driven development through direct incentive effects. Simultaneously, its permeability and inclusiveness are conducive to the exchange and cooperation of innovation entities in the innovation network. In addition, the development of digital finance can effectively break down administrative barriers (Sun & Tang, 2022), drive the flow of human, capital, and technological innovation factors between regions, and promote regional innovation-driven development through indirect incentive effects.
Effects of dynamically optimized allocation: consolidating the foundation of innovation resource endowments in areas with innovation factorsInnovation production is the process of recombining innovation factors (Schumpeter, 1934). Under the influence of market mechanisms, innovation factors flow from areas with low marginal revenue to those with high marginal revenue. On the one hand, for the areas receiving innovation factors, their inflow has consolidated the endowment of local innovation resources to a certain extent and strengthened the factor base of innovation production (Fan et al., 2021; Yu et al., 2023). On the other hand, factors are used in industries with high allocation efficiency. Thus, some idle factors can be fully and effectively used, and promote the progress of innovation production technology, thereby promoting the innovation-driven development of the economy (Yang et al., 2022).
The “gravitational interaction” of innovation factors: weakening the innovation resource endowment in areas with weaker “gravity”A moderate increase in the level of local innovation factor allocation promotes the innovation factor agglomeration in the region to a certain extent, promotes the expansion of the region's internal production capacity, reduces production costs in the long run through the internal economies of scale effect, and improves the efficiency of innovation factor allocation to promote technological progress (Guo et al., 2023). Owing to the mobility characteristics of innovation factors, the improvement in allocation efficiency and cost reduction of innovation factors in this region will attract the inflow of some innovation factors from surrounding areas (Bai & Jiang, 2015; Fan et al., 2023). This will affect the level of innovation factor allocation in surrounding areas and even have a certain degree of negative impact on their high-quality economic development (Gambardella & Giarratana, 2010; Chen et al., 2024).
Based on this discussion, we propose our first hypothesis as follows.
H1: Innovation factor allocation has a spatial spillover effect on the high-quality development of the economy. Specifically, it has positive promoting effects on the high-quality development of the local economy and negative spillover effects on the high-quality development of neighboring economies.
The impact of the institutional environment on high-quality economic developmentInstitutions can provide incentives and constraints for high-quality economic development, and reduce costs of high-quality economic development (Peng & Tao, 2022; Zou & Ren, 2024). On the one hand, institutions can use incentives and constraints to promote a certain social incentive structure (Liu et al., 2021; Huang et al., 2023). This affects productivity development and economic efficiency (Xin & Park, 2024), and thus, high-quality economic development. If the orientation of incentives and constraint mechanisms formed by the institutional environment induce the economic system to generally prefer productive economic activities, the resulting technological progress and productivity improvement would move towards high-quality economic development. Thus, improving the institutional environment suitable for innovation factor allocation can effectively promote high-quality economic development (Yang et al., 2020). Conversely, it can also have adverse effects. On the other hand, large-scale and frequent economic activities and complex social relationships are involved in the process of high-quality economic development. The failure to effectively coordinate economic interests in any link may affect the speed and quality of high-quality economic development, leading to higher development costs (Cole et al., 2009; Gründler & Potrafke, 2019). A coordinated institutional environment in the current stage of development can coordinate the interests of economies at different scales and levels and reduce the costs of high-quality economic development (Lee et al., 2016). Based on this, we propose our second hypothesis as follows.
H2: The institutional environment has an inverted U-shaped effect on high-quality economic development; that is, when the institutional environment is at a lower level, optimizing it can promote high-quality economic development. However, when the institutional environment develops to a certain extent, continuing to improve it will negatively impact high-quality economic development.
The synergy between the institutional environment and innovation factors on high-quality economic developmentHigh-quality economic development driven by innovation factors is primarily reflected at the technical level. Improvements in innovation levels can improve the efficiency and reduce the cost of institutional innovation. Therefore, innovation factors and institutional innovation have strong synergistic and interactive relationships in innovation ecosystems. Their “two-wheel driven” positively affects total factor productivity (Liu et al., 2019), thereby attracting the flow of innovation factors. The free flow of innovation factors carrying a large amount of knowledge between regions drives the exchange and cooperation between innovation subjects in different regions (Almeida & Kogut, 1999; Zou & Ren, 2024; Huang et al., 2023), accelerates the spillover and sharing of innovation knowledge between regions (Li & Wu, 2023), enhances the quality of innovation factors (Tao et al., 2023), and promotes high-quality economic development. Based on this, we propose our third hypothesis as follows.
H3: The synergistic effect of innovation factor allocation and the institutional environment on high-quality economic development has a “two-wheel driven” effect.
Research designA random forest regression tree model with multi-input-multi-outputThe extant literature uses an indicator synthesis method for measurement, which mainly determines the weight of indicators based on the existing characteristics of the data. Differing from this approach, this study focuses on innovation factor allocation, as innovation factors serve as production factors. The importance of various indicators of innovation factors in production influences the outcome of economic development. We use the random forest method to determine the importance level of various indicators, proxied by their weight in the comprehensive indicator system (Trevor et al., 2016).
Random forest is a supervised learning, first proposed by Breiman (2001), which mainly uses ensemble thinking and the bagging method to integrate decision trees. Unlike most studies that only use a single variable as a supervised label (Credit, 2022; Mizumoto, 2023), this study selects five dimensions of high-quality economic development as output variables. Therefore, the i observation data are denoted as(yi1,yi2,⋯,yi5,ei1,ei2,⋯,ei,35), where yij(j=1,2,⋯,5) represents the five indicators of high-quality economic development and eik(k=1,2,⋯,35) represents the 35 indicator values of the innovation factor allocation system. This is a multi-input-multi-output random forest regression tree model.
The solution method for using the random forest model for estimation is as follows: ① We use bootstrapping to randomly sample the standardized data, construct a random training set of Binnovation factors, and use the minimum residual sum of squares method to train the Bcorresponding innovation factors decision trees. ② When constructing a decision tree for each innovation factor, minnovation factors are randomly selected and only their splitting point is selected. Each time, the innovation factor q that causes the most significant decrease in the mean sum of the squared residuals rof the five output variables is used as the splitting node. Therefore, the contribution value of the innovation factor q is the magnitude of the decrease in r. The average value of the decrease in rfor each innovation factor q in each decision tree is calculate and used as the importance level of the innovation factor q in that decision tree. ③ Then, we train a random training set of B innovation factors and calculate the average importance level of innovation factor qin each decision tree as the final weight.
The economic meaning of random forest regression tree in this article is that the innovation factor located at the top of the regression tree is more important for the high-quality development of China's economy during the research period. Therefore, importance is used as the weight of each innovation factor indicator to synthesize the allocation level of innovation factors in each region.
Econometric model settingTo explore the spatial spillover effects of the impact of China's innovation factor allocation on high-quality economic development, referring to Bai and Jiang (2015) and Yu et al. (2023), the following spatial Durbin model (SDM) is used:
where i represents an individual, t represents time, ρ is the spatial autoregressive (SAR) coefficient, hqed represents high-quality economic development, elem represents innovation factor allocation, X is a set of control variables, μ represents the provincial effect, and ε represents random error terms.
To further examine the institutional environment, and the joint impact of the institutional environment and innovation factor allocation on high-quality economic development in China, the institutional environment and interaction variables between the two are added to construct the following model:
where inst and inst2 represent the institutional environment and its square term, respectively; inst‾‾andelem‾‾ represent the institutional environment and innovation factor allocation after mean centering, respectively; and the other variables are the same as those in Model 1.
The spatial weighting matrix represents the interrelated network structure matrix between the regions. Owing to the flow of innovation factors between regions and innovation spillover effects, the economic behavior of regions has a spatial correlation. Following Bai and Jiang (2015), we use the spatial correlation strength matrix of innovation factor allocation, W, as a spatial weighting matrix. It is constructed using the modified gravitational model. As the research period of this study is from 2009 to 2019, the mean value of the spatial correlation strength of innovation factor allocation throughout the research period s selected as the spatial weighting matrix W.
The spatial correlation strength is computed as follows:
where Rijrepresents the spatial correlation strength, and Kijrepresents the spherical distance between the capital cities of the provinces.Variable selectionExplained variable: high-quality economic development (hqed)
Referring to Tao and Xu (2021), Xu and Zhao (2021a), Liu et al. (2021) and Yang and Tang (2023), and from the perspective of innovation benefits, high-quality economic development in China is measured based on the development concepts of innovation, coordination, greenness, openness, and sharing. The degree of output driven by innovation (or innovation-driven) is measured by per capita new product sales revenue (y1), coordinated development is measured by the rationalization of industrial structure (y2, Theil index, TL = Σ (c/Y) * ln [(Yi/Y)/ (Li/L)], Yi, Li is the output of the three industries and the number of employees in the three industries), green environmental protection is measured by sulfur dioxide emission intensity (y3, sulfur dioxide emissions/GDP), and open cooperation is measured by foreign capital dependence (y4, foreign direct investment/GDP), and achievement sharing is measured by per capita consumption expenditure (y5).
Core explanatory variables: innovation factor allocation (elem)First, we construct an innovation factor indicator system by referring to Tao and Xu (2021) and Xu and Zhao (2021a). The innovation factors are subdivided into human, capital, technology, and information innovation factors (see
Table 1). Human innovation factors refer to the labor force with high education, strong skills, or specialization in production, research, and development, which are the most essential factors in innovation activities. Capital innovation factors are funds specifically used for high-end links in the value chain. Technology innovation factors refer to the experience, skills, knowledge, and other resources to promote technological innovation condensed in technological innovation production, which are mainly used in the middle end of the innovation chain to promote product development and production of innovative products. Information innovation factors refer to all the sharing, timeliness, and dynamics needed in innovation production activities. External resources mainly exist in the form of information resources. Second, the weight of each indicator of innovation factors under the constraints of high-quality economic development is measured by constructing a multi-input-multi-output random forest regression tree model. Third, TOPSIS and grey correlation degree are used to measure the comprehensive index of innovation factor allocation.
Index system of innovation factor allocation.
| Subsystem | Subdivision system | Specific measurement indicators |
|---|---|---|
| Human innovation factors | Human input | (x1) Full-time equivalent of R&D personnel in high-tech industries; (x2) full-time equivalent of R&D personnel in colleges and universities; (x3) full-time equivalent of R&D personnel in R&D institutions; (x4) industrial robot inventory |
| Human health | (x5) Number of beds in medical and health institutions; (x6) number of health technicians; (x7) fiscal medical and health expenditure | |
| Human organization | (x8) The number of high-tech enterprises; (x9) the number of R&D institutions; (x10) the number of colleges and universities; (x11) the number of technology business incubators | |
| Capital innovation factors1 | Government | (x12) Government spending on science and technology |
| Colleges and universities | (x13) R&D expenditures of colleges and universities | |
| R&D institutions | (x14) R&D institution R&D expenditures | |
| Enterprise | (x15) Expenditures on R&D of high-tech industries; (x16) financing amount of technology-based listed companies | |
| Technological innovation factors | Technology resources | (x17) The number of new products development projects in high-tech industries; (x18) the number of authorized invention patents; (x19) the number of scientific papers, topics and scientific works |
| Technology development | (x20) Expenditures for the development of new products in high-tech industries; (x21) the amount of foreign technology import contracts; (x22) expenditures for purchasing domestic technologies in high-tech industries | |
| Technology transfer | (x23) Expenditures for digestion and absorption; (x24) expenditures for technical transformation | |
| Technology promotion | (x25) Attention to digital technology2; (x26) degree of marketization of technological achievements | |
| Information innovation factors | Information generation | (x27) Number of Internet pages; (x28) number of Internet domain names; (x29) number of Internet broadband access ports |
| Use of information | (x30) Number of mobile Internet users; (x31) Internet penetration rate; (x32) home computer ownership; (x33) weighted average broadband download rate during busy and idle time | |
| Information sharing | (x34) Number of mobile phone base stations; (x35) mobile Internet access traffic |
R&D expenditures of universities, R&D institutions, and high-tech industries are internal expenditures excluding government funds.
According to the digital technology mentioned in the “Digital Economy Development White Paper”, 20 keywords were selected, and the daily search data of mobile and PC netizens were obtained. Before 2011, this data only had PC data, as the development of mobile Internet before 2011 was lagging and its impact is relatively small. Meanwhile, to ensure the integrity of the data year, this study selected the overall Baidu index.
The institutional environment refers to the policy system and market environment that can provide the basis for innovation activities and stimulate the potential of innovation factors (Liu et al., 2019; Chen et al., 2024). To comprehensively consider the support of the institutional environment, following Liu et al. (2019) and Sun and Tang (2022), we consider five perspectives: ① Online government (online). Online government reflects the government's ability to serve citizens through information technology (government websites, etc.), measured by the online government index. ② Government service satisfaction (gov). This, comprising convenience and concise evaluation of government administrative approval procedures, is used to test the government's ability to provide a convenient administrative and regulatory environment to facilitate enterprises, measured by the index of reduction in government intervention in enterprises. ③ Degree of development of the non-state-owned economy (non). This represents a sound market environment, diversification, and inclusiveness. ④ Digital inclusive finance (fin). The development of digital inclusive finance provides fertile ground for extensive innovation and promotes the improvement of innovation efficiency. It is measured by the digital inclusive finance index. ⑤Proportion of market allocated economic resources (mark). As the main system of resource allocation, the market directly affects the transformation of production methods in the process of resource allocation. It is measured by the proportion of market-allocated economic resources.
Control variablesSome variables can affect high-quality economic development. On the one hand, improving the level of infrastructure construction and convenient transportation conditions can promote the flow of talent (Bernard et al., 2019). On the other hand, improving the industrial structure can promote economic development (Carree & Thurik, 1999; Peneder, 2003), while energy consumption also has a threshold effect on green economic efficiency (Li et al., 2020). Hence, following Li and Wu (2023), this study selects the logarithmic forms of the following control variables: the industrial structure (struc), measured by the ratio of the sum of the output values of the secondary and tertiary sectors to the output value of the primary sector of the economy; energy consumption intensity (ener), measured by the energy consumption per unit of GDP; infrastructure construction (road), characterized by the per capita urban road area; and transportation development (trans), measured by the operating mileage of railways in each province.
Data sourceThis study uses panel data of 30 provinces in mainland China (excluding Tibet, as data on this region are missing) from 2009 to 2019. Data on innovation factors are obtained from the “China Statistical Yearbook,” “China Science and Technology Statistics Yearbook,” “China Torch Statistics Yearbook,” the website of the National Bureau of Statistics, China Internet Development Statistics Report, and China Broadband Speed Report. Data on various indicators of institutional environments are sourced from the China Information Society Development Report and Wind database, whereas data on digital inclusive finance are sourced from the “Peking University Digital Inclusive Finance Index” report by the Peking University Digital Finance Research Center. The control variable data mainly come from the "China Energy Statistical Yearbook” and the website of the National Bureau of Statistics. The data on the number of robots and the financing amount of technology-based listed companies are matching data. Missing data are computed through interpolation, exponential smoothing, and national data ratio calculations.
The data on the number of robots are obtained by matching the 31 industries of China with the 13 industries of International Federation of Robotics (IFR) (Xu & Zhao, 2021b). These data mainly come from the IFR itself and provincial statistical yearbooks.
The financing amount of technology-based listed companies is obtained through manual matching of the preliminarily selected of all A-share listed companies by referring to Fang and Guo (2005). Specifically, in the preliminary selection, A-share listed companies are matched with high-tech enterprises in various provinces announced in the high-tech enterprise recognition network. Companies belonging to the network are directly selected as technology-based listed companies and no longer participate in the selection. Based on the selection criteria and screening procedures of Fang and Guo (2005), and in accordance with the “Industry Classification Guidelines for Listed Companies”, companies in the fields of wholesale and retail, finance and insurance, social services, transportation, real estate, and communication and culture are excluded for further screening. Next, after reviewing the annual reports of the remaining listed companies after the above steps, their main business products are compared with the high-tech products specified in “the Catalogue of Chinese High-tech Enterprises,” and enterprises whose main business products have not been recognized as high-tech products are excluded. Then, to reflect the status of high-tech enterprises and the benefits it brings to the enterprise, the following conditions are set: the main business should be higher than 50 %; the proportion of R&D personnel in the total number of employees exceeds 15 % (to ensure the integrity of the research object, this proportion is set at 5 % in Qinghai); and no abnormal financial data are found (excluding ST enterprises). This entire process yields 2094 A-share listed companies.
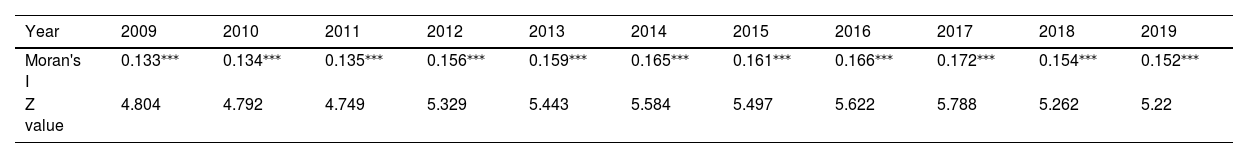
Empirical resultsAnselin ((1988)) believed that there was correlation among most of the spatial data, and the economic development of a region was not only related to itself but also affected by the spatial spillover effect of neighboring aeras. Following Liu et al. (2021) and Li and Wu (2023), this study uses Moran's I index to measure the spatial correlation of high-quality economic development. The results are shown in Table 2. We find a significant spatial autocorrelation at the 1 % levels and Moran's I index exceeds 0, indicating a strong positive spatial correlation in high-quality economic development.
Moran's I for spatial autocorrelation test of high-quality economic development.
Note: *, **, and *** represent the significance levels of 10%, 5%, and 1% respectively.
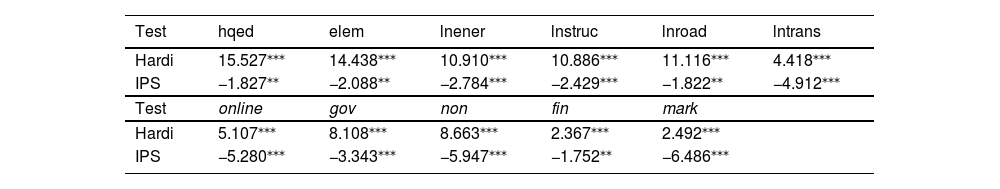
To avoid “pseudo regression”, Hadri and IPS methods for panel data are used to test the stability of each variable before SDM model estimation. The results are listed in Table 3. Clearly, all variables pass the stationarity test at least at the 5 % significance level.
Stability test results of each variable.
Note: The values in the table are corresponding test statistics..
The LM and Hausman tests are used to determine the estimation form of the spatial econometric model (see Table 4). Based on the LM test results, and combined with the research objectives and spatial weight matrix selection, the SDM with spatial lag term is selected. According to the Hausman test results, the fixed effect model is suitable. According to the Wald test results, the SDM does not degenerate into the spatial error (SEM) and SAR models. Thus, the SDM is the optimal model in this study. Accordingly, we apply the SDM with spatial fixed effects.
Test results of spatial econometric model selection.
Note: The values in parentheses are p-values.
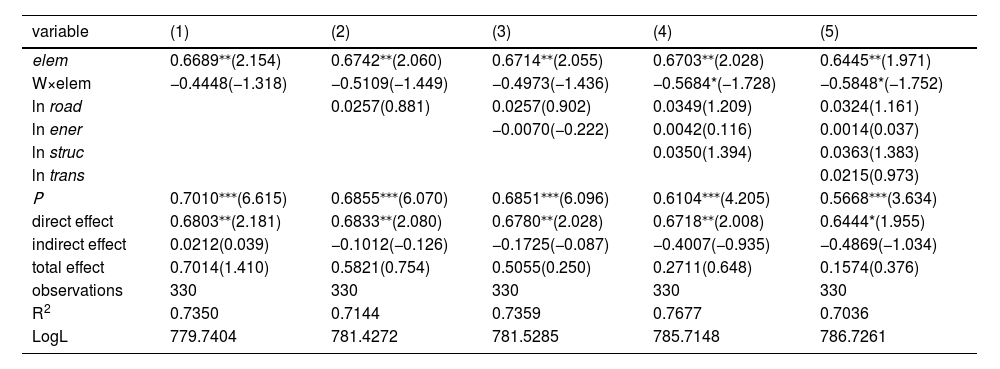
Table 5 reports the baseline results of the spatial fixed effects of model 1. Elhost (2014) pointed out that the spatial spillover effects measured by the SDM are global effects rather than local effects and the analysis of the global effects is prone to errors. Hence, this study computes both direct and indirect effects.
Benchmark regression results of spatial Durbin model.
Note: t values are in parentheses, *, **, and *** represent the significance levels of 10%,.
5%, and 1% respectively., LogL is log likelihood.
The SAR coefficient is significantly positive at the 1 % level, indicating significant spatial spillover effects in high-quality economic development. This result is consistent with the results of Cassar and Nicolini (2008), Liu et al. (2021) and Yang and Tian (2023). Thus, it is reasonable to study its spatial effects. Regardless of adding control variables, the effects of local innovation factor allocation on China's high-quality economic development are significantly positive at the 5 % level. Thus, improving innovation factor allocation can indeed promote high-quality economic development. The effects of the spatial lag of innovation factor allocation on high-quality economic development are negative, indicating that improving innovation factor allocation in adjacent areas will attract the outflow of local innovation factors, thereby inhibiting high-quality economic development (Chen et al., 2024). Thus, hypothesis H1 is supported.
Research has shown that due to the presence of interactive information between neighboring regions, using only regression coefficients to interpret spatial estimation results can lead to bias (Lesage & Pace, 2009), this article further analyzes the direct and indirect effects (Liu et al., 2021). Regarding direct and indirect effects, the improvement of innovation factor allocation can significantly promote the high-quality development of the local economy, but has a negative but insignificant impact on high-quality economic development of the adjacent areas. Regarding the total effect, the improvement of innovation factor allocation can promote high-quality economic development, but this effect has not been fully manifested. On the one hand, it may be due to the overall impact of multiple factors on high-quality economic development and the crowding-out effect (Cai & Ma, 2021; Chen et al., 2024). When other factors compete with the impact of innovation factors on high-quality economic development, it may muddle the overall effects. On the other hand, the improvement of innovation factor allocation also requires the concurrent development of various innovation factors (Hsieh & Klenow, 2009; Restuccia & Rogerson, 2013; Brandt et al., 2013). The improvement in the comprehensive allocation level of innovation factors caused by the improvement of certain factor allocation will instead result in factor mismatch and weaken the efficiency of innovation factor allocation (Restuccia & Rogerson, 2013; Zhang et al., 2023), thereby affecting high-quality economic development.
Robustness testThe robustness of the model results is tested by gradually adding control variables. The coefficient of the core explanatory variable, innovation factors, has the same sign and significance level, except for the difference in size, indicating the robustness of the baseline regression results.
The impact of the institutional environmentThe institutional environment of a region is an important factor for measuring the quality of the regional government. The deterioration of the institutional environment will affect the business environment, create unfair competition, and finally negatively impacts local enterprises and economic development (Cole et al., 2009; Gründler & Potrafke, 2019; Liu et al., 2021; Chen et al., 2024). To explore the differences in the impact of different types of institutional environments and their synergy with innovation factors on high-quality economic development, this study estimates the results using SDM with spatial fixed effects based on model 2.
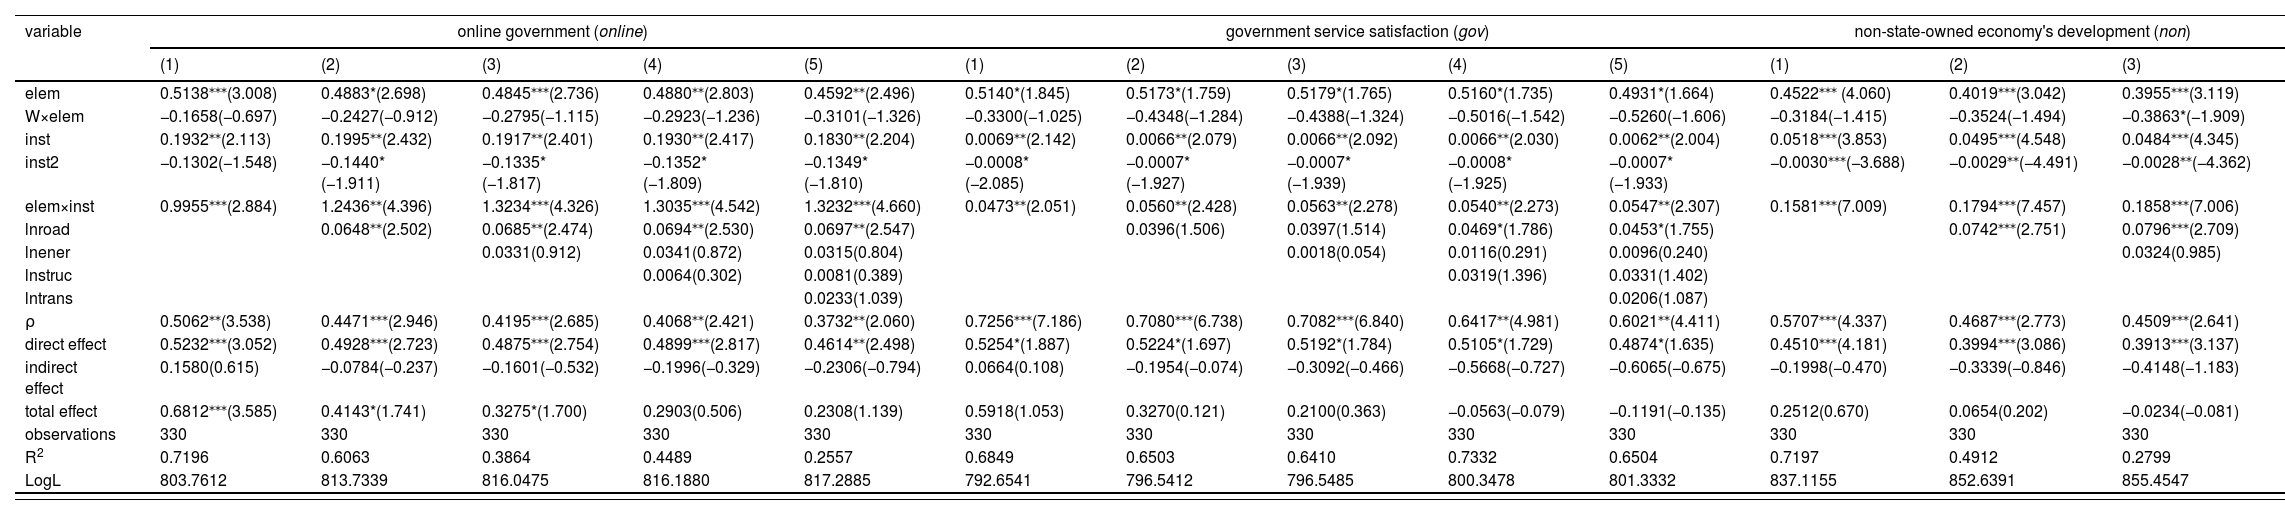
Table 6 reports the estimation results of stepwise regression for different types of institutional environments. The SAR coefficients are significantly positive regardless of adding control variables. This demonstrates that high-quality economic development has significant spatial spillover effects. The result is also consistent with the results of Cassar and Nicolini (2008) and Liu et al. (2021); Under different types of institutional environments, the impact of innovation factor allocation on high-quality development of the local economy is significantly positive, demonstrating the robustness of the conclusions. We know that factors especially capital tends to flow into coastal port cities or special economic zones that are open to the outside world (Head & Ries, 1996), and owing to the agglomeration and crowding-out effects of innovation factors (Yu et al., 2023; Chen et al., 2024). Notably, the improvement in innovation factor allocation in neighboring areas negatively affects the high-quality development of the local economy, but this impact is not significant under the three institutional environments of online government, government service satisfaction, and proportion of market allocated economic resources.
SDM estimation results of stepwise regression in different types of institutional environments.
Note: t values are in parentheses, *, **, and *** represent the significance levels of 10%, 5%, and 1% respectively.
The results in Table 6 reveal that the coefficients of online government, government service satisfaction, degree of development of the non-state-owned economy, and proportion of market allocated economic resources in the first-order term are significantly positive, whereas the coefficients of their square terms are significantly negative. The results are consistent with Wu (2013). Thus, improving these factors can effectively promote high-quality economic development, but only up to the critical values as they have inverted “U” shaped relationships with high-quality economic development. The coefficient of the first order term of the digital inclusive finance index is positive, while the coefficient of the square term is negative but not significant. Thus, although digital inclusive finance may currently promote high-quality economic development, inferring the persistence of this effect is challenging. Clearly, none of the five types of institutional environmental indices have crossed the critical values,3 indicating that effectively improving each type of institutional environment can promote high-quality economic development at the current stage. The results will intensify market segmentation in different regions of China (Lee et al., 2016; Bian et al., 2019; Liu et al. 2021; Yang & Tian, 2023). Thus, hypothesis H2 is supported.
Comparing the impact of innovation factor allocation on the high-quality development of the local economy under the influence of five different institutional environments, we find that innovation factor allocation under the influence of the proportion of market allocated economic resources has the strongest but insignificant effect on the high-quality development of the local economy, followed by digital financial inclusion (see Table 6). Financial benefits, government service satisfaction, online government, and degree of development of the non-state-owned economy have significant impacts. The negative spillover effect of innovation factor allocation is the largest but not significant under the influence of government service satisfaction, followed by the proportion of market allocated economic resources, digital financial inclusion, non-state-owned economy's development, and online government. Next, the interaction coefficient of online government index and innovation factor allocation is the largest, followed by non-state-owned economy's development and the proportion of market-allocated economic resources (not significant), government service satisfaction, and digital financial inclusion. Overall, the innovation factor allocation under the influence of the online government has the strongest and most significant role in promoting high-quality economic development, while its negative spillover effect is the weakest. This indicates that improving the government's ability to serve people's livelihoods can maximize the role of innovation factor allocation in promoting high-quality economic development. The results of the regulatory effect of institutional environment are consistent with Lee et al. (2016) and Liu et al. (2021). Thus, hypothesis H3 is supported.
Regarding direct and indirect effects (see Table 6), under the influence of different institutional environments, improving innovation factor allocation significantly promotes the high-quality development of the local economy, while resulting in negative spatial spillover effects on the high-quality development of the surrounding areas. While the overall effect of improved innovation factor allocation on high-quality economic development is positive, this effect is heterogeneous and not significant. Innovation factors indeed serve as the driving force for high-quality economic development. Their higher allocation can effectively promote high-quality economic development. However, innovation factors have agglomeration characteristics, crowding effects, competition effects, and scale effects, among others, and are limited. Furthermore, improvements in local innovation factor allocation may lead to the outflow of innovation factors from neighboring regions, inhibiting their high-quality economic development. The effective utilization of innovative factors results from the combined effect of these multiple factors, which is insignificant in this case.
ConclusionsAs the main input factor for innovative production, innovation factors play an important role in high-quality economic development. Furthermore, the institutional environment, as the market environment, can stimulate the potential of innovation factors while playing a regulatory role in unleashing their potential (Lee et al., 2016; Yang et al., 2020; Liu et al., 2021; Yang & Tian, 2023). Although the studies have incorporated innovation factors and the institutional environment into a unified framework to explore their impact on high-quality economic development, few have explored the regulatory effects of multiple institutional environments (Li & Wu, 2023). This study constructs an indicator system for innovation factor allocation and high-quality economic development under the guidance of the “Three Major Changes” and “Five Development Concepts” First, we integrate innovation factor allocation and high-quality economic development into a unified framework and construct a multi-input-multi-output random forest regression tree model to calculate the weights of various indicators of innovation factors. Second, the TOPSIS and grey correlation methods are used to measure the level of innovation factor allocation in various provinces of China from 2009 to 2019. Based on this, a modified gravity model is used to construct a spatial correlation network for innovation factor allocation. Finally, a directed weighted network is used as the spatial weight matrix to explore the spatial effects of innovation factor allocation on high-quality economic development under different types of institutional environments. Our work and its insights can help governments at all levels in optimizing innovation factor allocation, and provide a theoretical and empirical basis for formulating better policies for high-quality economic development.
The conclusions are as follows: Improving innovation factor allocation can significantly promote the high-quality development of the local economy, but has negative spatial spillover effects on the high-quality development of neighboring economies. The impacts of the different types of institutional environments on high-quality economic development exhibit an inverted “U” shape. The institutional environments, including online government, government service satisfaction, non-state-owned economy's development, digital financial inclusion, and proportion of market allocated economic resources, have not crossed the threshold values and can continue to promote high-quality economic development. Meanwhile, the institutional environment's effective collaboration with innovation factor allocation can further stimulate the latter's potential and strengthen the positive impact of innovation factor allocation on high-quality economic development. In particular, the positive effects of online government are the strongest, while its negative impacts are the weakest. Our results remain stable after robustness analyses using gradually adding control variables.
Policy implicationsFirst, the government should consider optimizing innovation factor allocation and consolidating the endowment of innovation resources. Leveraging the key roles of human innovation factors in the innovation ecosystem, policy makers should attach importance to human health investment, establish a sound medical and health security mechanism, and improve the quality of health of the population. Further, they should actively promote the construction of human resource organizations and improve the sharing mechanism for talent mobility. Moreover, policymakers should optimize the investment structure of science and technology funds, appropriately increase investment in basic research, and focus on the transformation and promotion of scientific and technological achievements to enhance the competitiveness and innovation strength of industry. Next, tapping into the potential of information innovation factors and stimulating their powerful potential is important. On the one hand, it is necessary to strengthen the capabilities of information collection, transmission, and processing; deepen the big data development strategy; focus on building a supply chain of information innovation factors; broaden their application scope; and promote their collaborative configuration through their collaborative penetration characteristics. On the other hand, it is necessary to improve the quality of information usage, deeply explore the potential value behind information, and fully leverage the sharing characteristics of information innovation elements.
Second, the government should improve the socialist market economy system and fully leverage its advanced roles. The vigorous development of the non-state-owned economy, expanding its share in the socialist market economy, actively promoting online government services, improving the efficiency of government service enterprises, developing digital inclusive finance, unblocking financing channels for small and medium-sized enterprises, and improving the relationship between the government and the market, among other things, can strengthen the potential of innovation factors and promote high-quality economic development. In particular, enhancing the ability of online government to serve the people can have the largest impacts in promoting high-quality economic development.
Third, policy makers should promote the efficient flow of innovation factors, thereby promoting balanced regional development. In particular, efforts should be made to optimize the spatial correlation network of innovation factor allocation; strengthen communication and connections between regions, especially in provinces located at the edge of the network; actively expand communication channels; strengthen innovation exchanges with economically developed provinces; establish long-term stable cooperative relationships; strengthen talent introduction efforts; and drive the efficient inflow of other innovation factors by introducing talent, especially information innovation factors, which may help the central and western regions in “surpassing the bend.”
Limitations and future research directionsFirst, this study only discusses the impact of the different types of institutional environments on enhancing innovation factor allocation, and thus, high-quality economic development. Another area worthy of exploration is the underlying mechanisms. Second, this study only considers the impact of innovation factor allocation and the institutional environment on high-quality economic development at the innovation factor allocation level. However, this influence is part of a relatively complex process. Scholars should explore how the methods and structures of innovation factor allocation affect high-quality economic development.
This work was supported by Jiangxi Province University Humanities and Social Sciences Research Project [No. JJ23115], the National Natural Science Foundation of China [Nos. 71973055, 72163008, 12361096], the National Social Science Foundation of China [No. 20BTJ008], the Ministry of Education of Humanities and Social Science project [No. 21YJA790069], the research project of Nanchang Institute of Technology [No. 2022kyqd046].
Postal address: College of Science, Nanchang Institute of Technology, Nanchang City, Jiangxi Province, China (Post Code: 330,029)
The data are sourced from the 2023 Global Innovation Index report.
The mean online government index value is smaller than the critical value (0.5627<0.6783). Similar relationships are observed for government service satisfaction (3.4229<4.4286), degree of development of the non-state-owned economy (7.3698<8.6897), digital financial inclusion index (171.5147<446.4286), and proportion of market allocated economic resources by the market (7.5711<10.0556).
articles