


The development of science and technology has been increasingly linked with the implementation of science and technology innovation (STI) policies with important strategic significance for promoting national and regional innovation. In actual implementation, many types of STI policies are often combined for a joint effect; however, existing studies tend to focus on the effect of a single policy. The system simulation method can break through the limitations of traditional methods in model assumptions and establish a model that is as close to reality as possible. Notably, it is unusual to use the system simulation method to investigate STI policies. Using a system simulation model, this study conducts a detailed analysis to examine the complex causal relationships of STI systems and study the impact and mechanism of STI policy from a systematic perspective. This study quantifies various STI policies, establishing a simulation model to reflect the dynamic behavior of the regional STI policy system. The empirical results demonstrate that when a single type of policy is examined, the STI supply policy has the most significant impact on promoting STI and economic development. When various STI policies are combined, the combination of supply and demand policies has the greatest promotional effect on STI and economic development, whereas the combination of demand and environmental policies has the least promotional effect on STI and economic development. The results also show that the combined effect of various STI policies is not based on the simple addition of the effects of various policies, as there is an apparent synergy phenomenon in the combined STI effects. This study contributes to the existing literature and provides practical insights for policymakers and policy enthusiasts to understand the relationships between STI supply, demand, and environmental policies to advance policy effectiveness and promote sustainable development.
Regional policies are made to solve regional problems, such as existing imbalances in regional development. These policies are developed to promote development and coordination according to regional comparative advantages (McCann et al., 2021). The influence of regional policy on regional development strategy cannot be ignored.
The implementation of regional policies has a significant impact on local and surrounding economic activities, industrial layout, and employment, and such policies widely exist in the world (Kline & Moretti, 2013; Zhu & Zhao, 2021). Following the formulation and implementation of regional policy, policymakers contend with determining whether it is reasonable and effective, which is measured by analyzing its impact. Examining the impact of specific regional policies is a popular research topic. Existing studies are mainly conducted from a qualitative perspective (Becker et al., 2018; Di Cataldo & Monastiriotis, 2020; Fratesi & Perucca, 2019; Kiese, 2019; Krivosheev & Troitskiy, 2019; Surianto et al., 2019), but some quantitatively analyze the correlation between regional policies and regional development (Avdiushchenko & Zajac, 2019; Cengiz et al., 2019; Gulal & Ayaita, 2020; Yawson et al., 2020).
Given the wide range of regional policies, there are separate policies for primary, secondary, and tertiary industries. For example, there are different policies for secondary industries, such as electronic information, biotechnology, energy, and chemicals. Furthermore, different industries have policies with the same intent, such as science and technology innovation (STI), foreign trade and export, and promoting domestic demand. Therefore, to make the research and data selection, academic perspective, practical problem analysis, and policy effect evaluation of this study directional and targeted, and smooth the research logic, this study focuses on regional STI policy.
In the contemporary knowledge economy, the factors that determine regional development have transitioned from traditional resources and labor advantages to STI capability benefits (Lee & Trimi, 2018). STI has an increasingly significant influence on improving regional competitiveness and reshaping regional development patterns by advancing natural resource utilization efficiency, optimizing the industrial structure, and improving overall labor productivity (Walsh et al., 2020). Regarding the research methods used in the field of STI policy assessment, qualitative approaches include theoretical analysis; comparative analysis; case study analysis; expert evaluation; self-assessment; the target acquisition model; strengths, weaknesses, opportunities, and threats analysis; and grounded analysis method. Quantitative methods include econometrics, cost-effectiveness analysis, and policy indicator methods (Fernández-Esquinas et al., 2021; Roig-Tierno et al., 2017). Previous research methods assume that the policy environment remains stable and unchangeable, representing an oversimplification of the real policy system. These methods are only applicable for simple STI policy analyzes and are incapable of fully examining numerous complex and uncertain problems in the modern STI policy system (Ercan et al., 2016; Xie et al., 2018). System simulation breaks through the limitations of traditional methods in model assumptions and has unique advantages for analyzing the complexities and other characteristics of the real policy system (Kelton et al., 2014; Law, 2014; Schweiger et al., 2020).
This study uses a system simulation method to examine the impact and mechanism of STI policy from a systematic perspective. Specifically, we quantify various types of STI policies to establish a model using system dynamics (SD) to reflect the dynamic behavior of the regional STI policy system. We then conduct simulation experiments to analyze the combined effects of STI policies to gain insights regarding similar systems and related issues more deeply and comprehensively. SD is one of the system simulation methods.
This study offers three relevant contributions. First, previous research on the policy effect of STI usually (excessively) simplifies the real policy system and often deviates from reality, reducing the accuracy of research and analyzes. This study constructs an SD model that is as close as possible to the real policy system, making an important contribution to expanding, enriching, and improving the research on regional economics, policy science, system science, and overall interdisciplinary integration. Second, a majority of the existing studies focus on a single policy, but there are often multiple types of mutual combinations with a common effect in the actual implementation of policies. Research on a single policy neglects this interaction and connection among policies and cannot obtain accurate results. This study examines the relationship between STI supply, demand, and environmental policies, enriching and improving upon previous research approaches. Third, this study fully considers the complexity and other challenges in the STI policy system, positioning relevant analyzes and solutions in a real complex environment from a systematic perspective, making the research results more scientific and reasonable. The proposed framework can provide a scientific basis for policymakers, improve the accuracy of policy analysis and decision-making, and promote STI and sustainable development.
The remainder of this study is structured as follows. Section 2 presents the theoretical background and literature review. Section 3 details the research method, introducing the SD approach, analyzing the system mechanism and the relationship among system factors, and constructing the proposed SD model. Section 4 presents the result and simulation analysis, Section 5 is a discussion of the study, and the Section 6 is a summary of the study.
Literature review, theoretical background, and research hypothesesLiterature reviewAs noted, most of the existing studies analyze the effect of a single policy input on STI from the perspective of economics. The following presents an overview of such studies. Hwang et al. (2021) analyze the impact of research and development (R&D) investment by constructing a computable general equilibrium model. Qi et al. (2020) examine the relationship between R&D investment and innovation capabilities. Boeing et al. (2022) analyze the impact of R&D subsidies on innovation and the economy as well as its impact on enterprises’ R&D investment. Montmartin et al. (2018) assess the impact of R&D policy, Akcigit et al. (2022) examine tax and R&D policies from the perspective of optimization, and Wan et al. (2022) empirically analyze the impact of preferential tax policies on China's high-tech industry. Wang and Kesan (2022) study the relationship between taxes and innovation. Zheng and Zhang (2021) investigate the innovation effect of tax reduction, asserting that tax reduction can significantly promote innovation. Chen and Yang (2019) contend that tax credits could promote enterprise R&D investment and innovation. Grilli et al. (2018) explore the impact of financing policies on innovation. Hottenrott and Richstein (2020)) examine the relationship between financing policy and enterprise innovation performance. After analyzing the impact of financing on innovation, Zhu et al. (2021) assert that the government should formulate targeted financing policies. Gmeiner and Gmeiner (2021) analyze the relationship between intellectual property protection, innovation, and economic growth. Zheng et al. (2021) empirically investigate the relationship between intellectual property protection and innovation, determining that intellectual property protection promotes innovation. Silva et al. (2018) contend that STI intermediary services help promote innovation. Cantu et al. (2015) analyze how knowledge intermediaries affected innovation.
Regional STI policy implementation is expected to have significant and extensive economic influence, making it impossible to test the policy repeatedly in the real world. As it is difficult to repeatedly conduct policy experiments to compare schemes, we examine STI policies using a system simulation. We are also able to conduct a number of acceleration, pressure, limited, and failure or mutation experiments that are not constrained by reality, with the potential to save human, material, financial, and temporal resources (Kelton et al., 2014; Law, 2014). Of course, system simulation also has limitations. Developing a simulation model usually requires considerable expenditure and time (Garraghan et al., 2016). In addition, system simulation can only obtain special or feasible solutions to the research problem but incapable of obtaining general or optimal solutions (Law, 2014). For various reasons, research on the impact of STI policy using system simulation must be strengthened. Limited studies include Ahrweiler (2017), who employs an agent-based simulation method to study STI policy; Wang et al. (2014), who apply a multi-agent-based simulation method to analyze the impact of preferential policies, demonstrating that preferential policies could promote innovation; and Walrave and Raven (2016), who propose a technological innovation system model using the SD method.
In summary, previous research continues to focus on the effect of single policies; however, with the increasing number of regional STI policies issued, the STI policy system has become increasingly complex, and interactions between policies from different departments with distinctive characteristics are gradually increasing. STI policies often address problems in the innovation system through policy combinations or require policy combinations. Consequently, many policies are combined to elicit a joint effect in actual STI policy implementation. Single investigations of one type of policy neglect the interaction and connection among policies, also failing to deeply explore the impact mechanism of STI policies on regional innovation capabilities. In addition, as noted, existing studies basically simplify the real policy system and rarely consider complexity and uncertainty, leading to insufficient models that fail to identify and analyze the key features of the problem.
Theoretical backgroundNeoclassical economics specifically analyzes the scientificity of government intervention in STI, asserting that there are three reasons for market failure: the attribute of knowledge as a public good, the non-exclusivity of innovation income, and the externalities of innovation. This approach assumes that the government must introduce corresponding policies to intervene in the basic research field to effectively address the problem of market failure (Che et al., 2022).
STI theory holds that innovation is a great driving force for the improvement of social productivity and industrial structure upgrade (Walsh et al., 2020; Zhou et al., 2022). With increasing scientific and technological knowledge and achievements, STI is continuously applied to production practice. Many subjects participate in this process, including the government, enterprises, research institutions, and public social organizations (Lipieta & Lipieta, 2022). STI continuously develops in a strong innovation atmosphere and constantly improves institutional systems. STI is not invariable; it is dynamic, and constantly keeps pace with the technology of the times, establishing capabilities for social and economic progress. STI theory also emphasizes the need for government policy support in different periods of STI (Romer, 1986).
Innovation system theory holds that STI confronts the challenges of market and system failure (Manjon & Merino, 2012). Therefore, innovation system theory includes the government and STI policies in the innovation mechanism, asserting that governments should continuously increase financial support for enterprises’ R&D and encourage enterprises to market research results.
Research hypothesesTwo assumptions are held in this study. First, the STI policy system is assumed to be closed without considering the impact of policies outside the STI policy system. This hypothesis focuses on the impact of STI policies, reasonably simplifying the research model without affecting the realization of the research purpose to avoid an overly wide system boundary or constructing an overly complex model. The second assumption is that the STI policy system is stable, without considering the impact of sudden changes in the macroenvironment. Therefore, this study uses existing STI policies as the research object to analyze the effects of these existing STI policies. Ten years of empirical data are used, implying that these STI policies have been implemented continuously and stably for over a decade; therefore, it is appropriate for this study not to consider the impact of sudden changes in the macroenvironment.
Research method: system dynamicsThe first consideration when applying the SD method is analyzing the nature of each factor in the system to construct a model characterizing the scientific and reasonable relationships between each factor and establish the corresponding simulation model, which can then be used for various research purposes. This study uses the SD approach that was first proposed by MIT professor Forrest in the 1950s. It is a powerful tool for modeling and analyzing complex systems that include interacting subsystems or factors jointly affecting the behavior of the entire system through dynamic causality. The approach is based on the system theory perspective, combining structural, functional, and historical methods, and absorbs the essence of cybernetics and information theory by integrating natural science and computer simulation technology (Sterman, 2000). SD has been widely used to evaluate different policies through simulation experiments aimed to improve system performance.
SD regards the system under study as an information feedback system, dividing it into subsystems and treating the research object as a whole. This study uses five steps in applying the SD method, as shown in Fig. 1. The first is analyzing the mechanism of the STI policy analysis system and defining the boundary of the policy system under study. The second step is to clarifying the logical or quantitative relationship between the factors in the system. The third is establishing the simulation model based on the above two steps. In this study, VENSIM software is used to build the model. The next step is using the simulation model to conduct various simulation analyzes, including examination of the simulation model and policy combination effect analysis. The final step is summarizing the research.
System mechanism analysis
From a systematic perspective, the STI policy system is a dynamic system associated with the government and the market. The system contains multiple structural factors that change over time and interact, affecting the entire system's behavior. One of the essential characteristics of system analysis is determining the causal relationships between the interaction factors, as a change in one factor can cause a change in others. Combining the causal relationships between factors forms a feedback loop (Forrester, 1961), which reveals the significant dynamic behavior of the entire system. The feedback loop demonstrates how the whole STI policy system changes when system conditions dynamically change and provides useful insights for decision-making and policy design.
There are generally two ways to classify STI policies. One is using the classification method proposed by Rothwell and Zegveld (1981) according to different levels of policy impact and dividing STI policies into supply, demand, and environmental categories. The other is to separate STI policies into mission- and diffusion-oriented categories according to different policy objectives, referencing Ergas (1987). Because this research endeavors to investigate the impact of STI policies, we use the Rothwell & Zegveld classification method to categorize STI policies and then conduct the next step in our research.
A mechanism analysis summary of the STI policy analysis system of this study is presented in Fig. 2. As previously noted and shown in Fig. 2, policymakers can formulate and implement STI policies from supply, demand, or environmental perspectives, exerting positive or negative impacts on STI. This will affect economic development, causing policymakers to adjust the existing STI policies according to the circumstances or to formulate and implement new policies of STIs.
Determining the relationships between system factors
As noted above, this study classifies STI policies according to supply, demand, and environmental policy approaches. From the perspective of STI policy, supply policy tools primarily refer to government support for STI-related elements, such as human resources training, science, and technology information support, infrastructure construction, capital investment, and public services to directly promote and guide STI. Demand policy tools refer to government procurement of products or services and strengthening or relaxing industry access control to stimulate market demand and promote STI. Finally, environmental policy tools refer to the government's influence on stakeholders in all aspects of STI by providing a favorable policy environment, which indirectly affects enterprises’ innovation and promotes the country's innovation and development. Environmental policy tools can be divided into financial support, tax incentives, goal planning, and strategic measures. Considering the factors of policy quantification and data availability, this study only includes the policies presented in Fig. 3. Accordingly, government R&D funds, talent training funds, the intensity of intellectual property protection, the perfection of intermediary service, loan rate, and enterprise income tax rate are used as quantitative indicators of corresponding policies. The references in the above literature review describe the relationships among these factors in detail.

The causality diagram presented in Fig. 4 is obtained by conceptualizing the graphic model in the STI policy analysis system to construct the SD model. The elements of the causality diagram are nodes and edges that represent variables and links among variables. Positive and negative links represent positive and negative relationships. A positive causal link indicates that two nodes move in the same direction with changes, wherein, if the value of the node at the beginning of the link decreases (increases), the value of the other node will decrease (increase). A negative causal link indicates that two nodes change in the opposite direction, indicating that if the node at the beginning of the link increases, the other node decreases, and vice versa.

In Fig. 4, the whole STI policy analysis system is composed of three subsystems. The first subsystem analyzes the STI supply policy subsystem, depicting the causal relationships between supply policy and output. In this subsystem, government R&D funds, talent training funds, STI output, and other system factors form a feedback loop that reflects the impact of STI supply policy on the entire STI policy system. The second subsystem analyzes the STI demand policy subsystem, depicting the causality between demand policies and output. In this subsystem, factors such as intellectual property protection, STI intermediary service, and STI output form a feedback loop that reflects how STI demand policy affects the entire STI policy system. The third subsystem analyzes the STI environmental policy subsystem, depicting the causal relationships between STI environmental policy and STI output. In this subsystem, enterprise profit, enterprise input, STI output, and other factors form a feedback loop, reflecting the impact of STI environmental policy on the entire STI policy system. These three subsystems are linked by STI, complementing one another and jointly promoting and guiding STI.
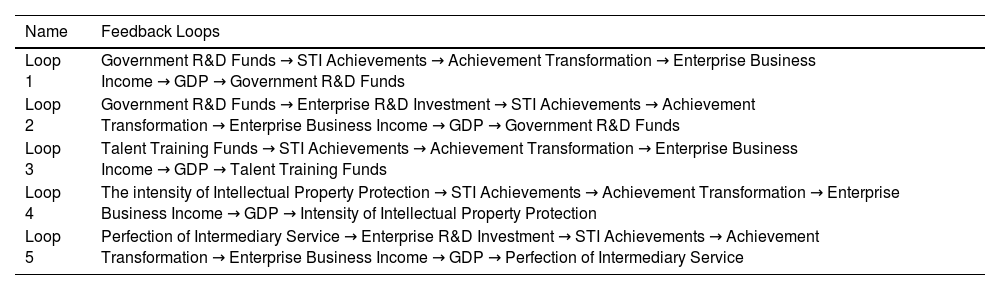
The specific feedback loop of the STI policy analysis system in this study is presented in Table 1. Loop 1 is positive, indicating that the government directly affects regional innovation through R&D investment. Loop 2 is positive, showing that the government influences enterprises’ capital investment in innovation activities through R&D investment and then affects regional innovation. Loop 3 is positive, revealing that the government improves the external talent environment of innovation activities through talent training policies which then affects regional innovation. Loop 4 is positive, indicating that the government strengthens intellectual property protection through intellectual property policies, provides a guarantee for innovation achievements, and promotes the motivation for enterprise R&D, which then affects regional innovation. Finally, loop 5 is positive, demonstrating that the government improves the service level of the STI intermediary, supports STI market transactions, and encourages enterprises’ capital investment in innovation activities, which then affects regional innovation.
Feedback loops in the STI policy analysis system.
According to SD modeling principles, we next transform the above STI policy analysis conceptual model to develop the causality diagram into a structural model using a stock-flow diagram to illustrate the logical relationships between system functions and factors. Simulation experiments can then be conducted using the SD simulation model to determine and verify the conceptual framework of the STI policy analysis system.
This study uses VENSIM software for simulation modeling and solution (Ventana Systems, Inc., 2023). The simulation model takes one year as the time unit, across a 12-year span from 2010 to 2021.
This study uses three steps to construct the STI policy analysis SD model. First, the variables in the simulation model are set. Second, because the whole STI policy analysis system in this study is composed of three subsystems (STI supply, STI demand, and STI environmental policy analysis subsystems), this study conducts detailed simulation modeling for each subsystem. Finally, the simulation models of the three subsystems are integrated to obtain the simulation model of the whole STI policy analysis system. The specific modeling process is presented in Fig. 5.
Variable setting and data source description
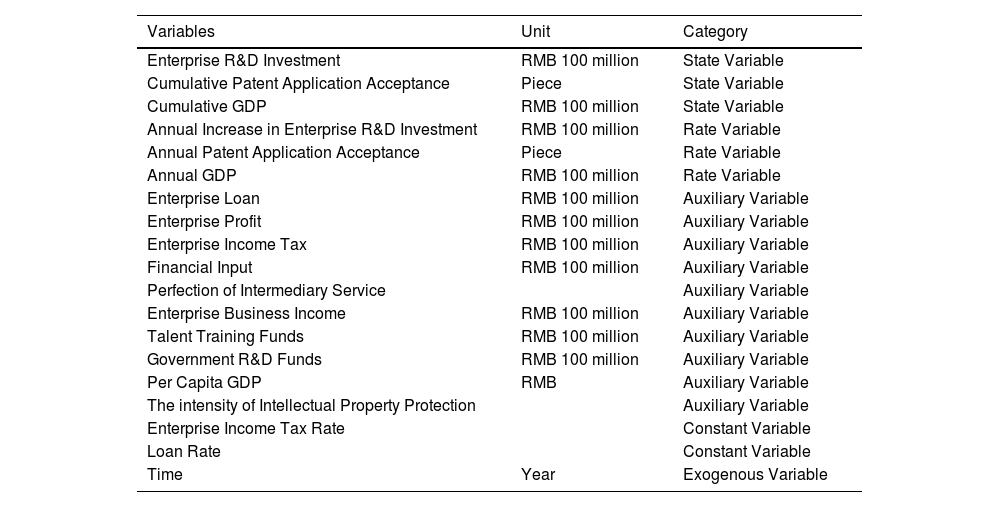
State, rate, auxiliary, constant, and exogenous variables are the main factors of SD that are involved in this study, as shown in Table 2.
Model variables.
Guangdong Province is a provincial administrative region of the People's Republic of China, and its capital is Guangzhou. It is the largest economic province in China, and is quickly becoming a strong province in STI. In this context, and considering the data availability and statistical caliber, this study takes Guangdong Province as the research object.
The model data used in this study are primarily from the Guangdong Statistical Yearbook, the China Statistical Yearbook, and 2010–2019 China Science and Technology Statistical Yearbooks. Financial input, talent training funds, government R&D funds, enterprise R&D investment, enterprise loans, per capita GDP, and GDP are all adjusted referencing the consumer price index (based on 2010). Enterprise business income, enterprise profit, and enterprise income tax are adjusted by the industrial producer price index (based on 2010).
Supply policy analysis subsystem model constructionThe STI supply policy subsystem illustrates how supply policy affects the whole STI policy system. Among them, capital investment policy has a direct effect on STI and also has an impact on STI by affecting enterprises’ R&D investment. In addition, talent training policy has a direct effect on STI. After the influence of supply, the policy is transmitted to STI, and STI achievements become a source of enterprise business income and ultimately a source of GDP and per capita GDP, as shown in Fig. 6.

In this study, the expressions of government R&D funds and talent training funds are presented in Eqs. (1) and (2), respectively.
where A1, B1, A2, and B2 are coefficients. After a detailed analysis of the expressions among variables using the SPSS regression analysis method, the values of A1, B1, A2, and B2 are 0.087907, −365.995233, 0.161634, and 185.08782, respectively.Demand policy analysis subsystem model construction

The STI demand policy subsystem describes how the demand policy affects the entire STI policy system. In demand policy, similar to talent training policy, intellectual property policy directly affects STI, while STI service policy affects STI by influencing enterprises’ R&D investment. As shown in Fig. 7, the transmission mechanism of demand policy on economic development is similar to that of supply policy.

In this study, the expressions of the perfection of intermediary service and intensity of intellectual property protection are presented in Eqs. (3) and (4), respectively.
where A3, B3, A4, and B4 are coefficients. After a detailed analysis of the expressions among variables using the SPSS regression analysis method, the values of A3, B3, A4, and B4 are 0.000069, 21.987792, 0.00001, and 4.752138, respectively.Environmental policy analysis subsystem model construction

The STI environmental policy subsystem describes how the environmental policy affects the entire STI policy system. In environmental STI policy, enterprise financing affects STI by influencing enterprise profit and encouraging enterprise R&D investment, while enterprise tax policy affects STI by influencing enterprise income tax and financial input, similar to supply policy.
The transmission mechanism of the impact of environmental policy on economic development is similar to supply and demand policies, all of which transform STI achievements into enterprise business income and become a source of GDP and per capita GDP, as shown in Fig. 8.

In this study, the expressions of Enterprise Loan and Enterprise Income Tax are Eqs. (5) and (6), respectively.
where A5, B5, A6, and B6 are the coefficients. After a detailed analysis of the expressions among variables using the SPSS regression analysis method, the values of A5, B5, A6, and B6 are 8936.188023, −17,917,288.112676, 0.703039, and −168.449646, respectively.Simulation model of STI policy analysis system

Thus far, this research has constructed simulation models for supply, demand, and environmental policy analysis subsystems. We will integrate the three subsystems to obtain the simulation model for the STI policy analysis system. After integrating the model, we can obtain the expressions of enterprise R&D, patent applications, GDP, and other variables. Among them, the expressions related to enterprise R&D, revenue, and profit are shown in Eqs. (7)–(10).
where P0 refers to enterprise R&D investment at the start time, with a value of 652.98 (based on 2009). A7, B7, C7, D7, E7, F7, A8, B8, C8, A9, and B9 are the coefficients. Following a detailed analysis of the expressions among variables using the SPSS regression analysis method, the values of A7, B7, C7, D7, E7, F7, A8, B8, C8, A9, and B9 are 0.021760, 0.046098, 15.764356, −0.237969, −130.098798, 260,106.366190, 0.086423, −0.327346, −1354.874977, 0.018559, and 90,350.940723, respectively.


The expressions related to patent applications are shown in Eqs. (11) and (12).
where Q0 refers to cumulative patent application acceptance at the start time, and its value is 125,673 (based on 2009). A10, B10, C10, D10, E10, and F10 are coefficients. Following a detailed analysis of the expressions among variables using the SPSS regression analysis method, the values of A10, B10, C10, D10, E10, and F10 are 1.069087, −548.715723, 91.145342, 14,608.276201, 49.05456 and 32,784.064777, respectively.

The expressions related to GDP are shown in Eqs. (13)–(15).
where R0 refers to the cumulative GDP at the start time, and its value is 39,482.56 (based on 2009). A11, B11, A12, and B12 are the coefficients. Following a detailed analysis of the expressions among variables using the SPSS regression analysis method, the values of A11, B11, A12, and B12 are 0.573937, −2640.51721, 0.055517, and 42,645.815378, respectively.


Finally, the expression of financial input are shown in Eq. (16).
where A13, B13, and C13 are the coefficients. Following a detailed analysis of the expressions among variables using the SPSS regression analysis method, the values of A13, B13, and C13 are 1.390604, 0.260756, and −7367.680131, respectively.Pros and cons of the suggested model
As previous research generally analyzes a single policy, neglecting the interactions and connections between policies, the model proposed in this study is based on a systematic approach to analyze policies. The proposed model considers the interactions and connections between policies and places the relevant analyzes and solutions in a real complex environment, rendering the research results more scientific and reasonable, which is the advantage of this model. However, this study only uses two typical and representative policies in the STI supply, demand, and environmental policies. In addition, this study does not consider policy uncertainty.
Simulation analysisThis section details the simulation analysis of the study, conducting the steps shown in Fig. 9. First, we verify the STI policy analysis system simulation model and determine whether the model performs the expected function and is consistent with the observation results of the actual system under the standard input to verify that the proposed model is accurate and effective. Second, according to the purpose of this study, a simulation experiment is designed to accommodate the STI policy scenario analysis. Finally, the combined effect of STI policies is examined using the scenario analysis method. The specific policy scenarios are detailed in Section 4.2 the simulation experiment design.
Simulation model verification
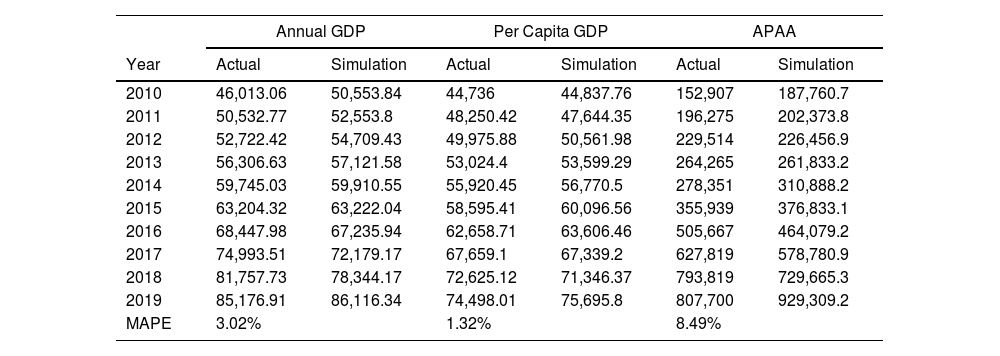
In this study, the output value of the simulation model is compared with actual annual GDP, annual patent application acceptance, and per capita GDP values to verify the model. Specifically, this study uses the mean absolute percentage error (MAPE) as an index to compare the output values of the simulation model with actual values to test the model. MAPE refers to average relative values of deviations between all output and actual values of an output variable, and its calculation formula is shown in Eqs. (17) or (18), where n represents the number of output values or actual values, yi represents the ith actual value, and si represents the ith output value.


The MAPE of the actual and output values of the simulation model using annual GDP, annual patent application acceptance (APAA), and per capita GDP is calculated using Eq. (17) and the results are shown in Table 3.
Simulation model test results based on Eq. (17).
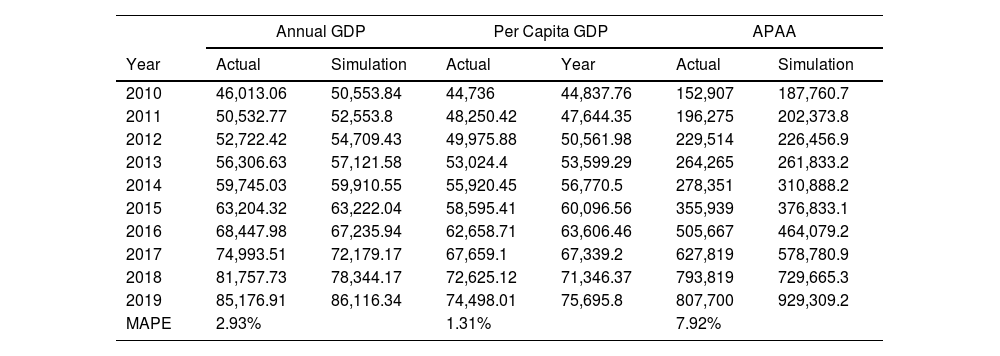
Table 4 presents the results obtained using Eq. (18) to calculate the MAPE between the simulation model's output values and the actual values of annual GDP, APAA, and per capita GDP.
Simulation model test results based on Eq. (18).
Tables 3 and 4 reveal that the MAPE values of annual GDP and per capita GDP are less than 5%, while the MAPE value of AAPA is less than 10%. According to the relevant statistical theory, when the significance level is 5%, the simulation values of annual GDP and per capita GDP meet the accuracy requirements. Furthermore, when the significance level is 10%, the simulation values of annual GDP, APAA, and per capita GDP meet the accuracy requirements. Therefore, the model of this study is a good fit and can perform the expected function.
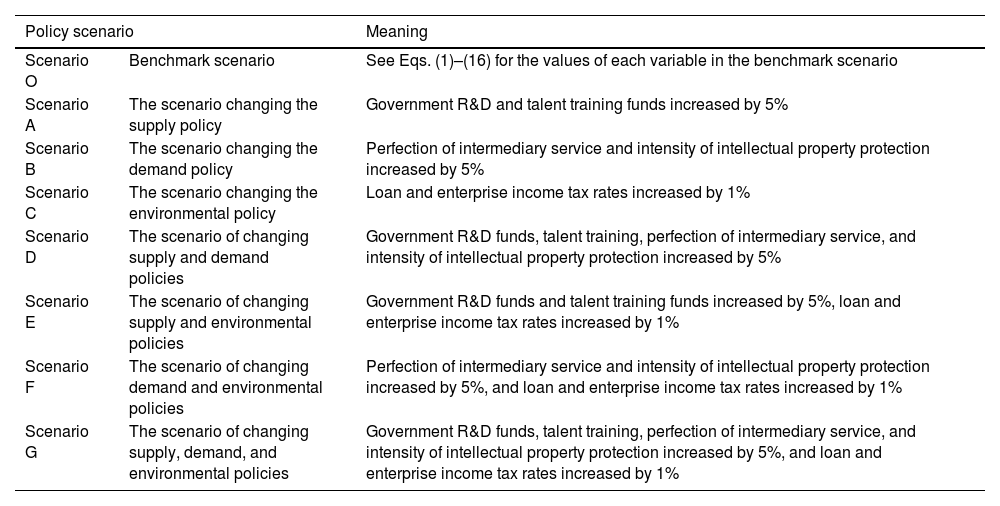
Simulation experiment designTo analyze the combined effect of STI policy, this study begins with STI supply, STI demand, and STI environmental policies, and then examines the combined effect of each kind of policy and the combination of various kinds of policies. Table 5 presents the seven policy scenarios designed for this study. First, three scenarios corresponding to supply, demand, and environmental policies are designed. Second, three scenarios corresponding to pairwise combinations of the three policies are designed. Finally, a single scenario corresponding to simultaneous change of the three kinds of policies is designed.
STI policy scenarios.
| Policy scenario | Meaning | |
|---|---|---|
| Scenario O | Benchmark scenario | See Eqs. (1)–(16) for the values of each variable in the benchmark scenario |
| Scenario A | The scenario changing the supply policy | Government R&D and talent training funds increased by 5% |
| Scenario B | The scenario changing the demand policy | Perfection of intermediary service and intensity of intellectual property protection increased by 5% |
| Scenario C | The scenario changing the environmental policy | Loan and enterprise income tax rates increased by 1% |
| Scenario D | The scenario of changing supply and demand policies | Government R&D funds, talent training, perfection of intermediary service, and intensity of intellectual property protection increased by 5% |
| Scenario E | The scenario of changing supply and environmental policies | Government R&D funds and talent training funds increased by 5%, loan and enterprise income tax rates increased by 1% |
| Scenario F | The scenario of changing demand and environmental policies | Perfection of intermediary service and intensity of intellectual property protection increased by 5%, and loan and enterprise income tax rates increased by 1% |
| Scenario G | The scenario of changing supply, demand, and environmental policies | Government R&D funds, talent training, perfection of intermediary service, and intensity of intellectual property protection increased by 5%, and loan and enterprise income tax rates increased by 1% |
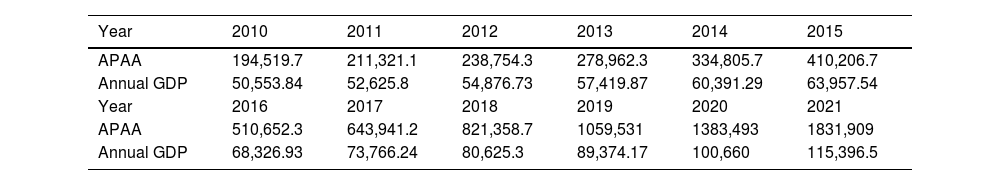
This study will next analyze the seven STI policy scenarios detailed above, analyzing the impact of various STI policy changes on APAA and annual GDP. As the results of the benchmark scenario are needed to analyze any policy scenario, these results are presented in Table 6 before the analysis of specific policy scenarios.
Benchmark scenario output.
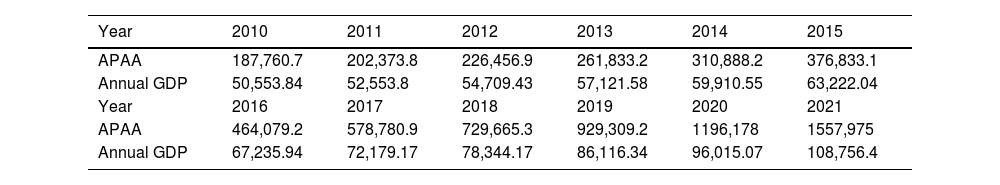
When the STI supply policy is changed, increasing government R&D and talent training funds by 5% on the basis of the benchmark, the simulation results show a positive impact on patent applications and GDP. Comparing Tables 6 and 7 reveals that the positive impact of STI supply policy on patent applications and GDP gradually increases over time, and the impact on patent applications is far greater than that of GDP. (See Fig. 10 for the degree of impact.)
Scenario A output.

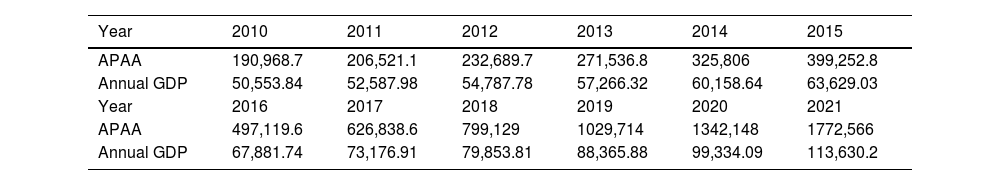
The results analyzing the STI demand policy show that demand policy has a positive impact on patent applications and GDP. Comparing Tables 6 and 8 reveals that the positive impact of STI demand policy on patent applications and GDP gradually increases over time, and the positive impact on patent applications tends to be stable. In terms of the degree of impact, the impact of STI demand policy on patent applications is greater than that of GDP, as shown in Fig. 11.
Scenario B output.

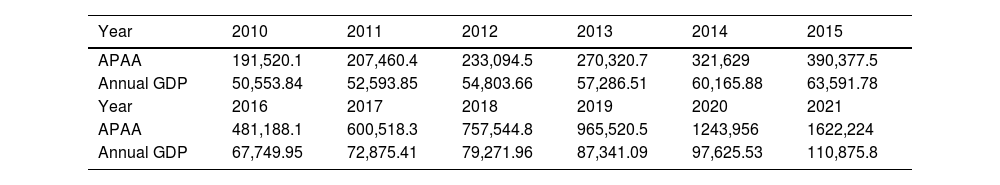
The results of the STI environmental policy analysis show a negative impact on patent applications and GDP. Comparing Tables 6 and 9 reveals that the negative impact of STI environmental policy on GDP increases gradually over time, while the negative impact on patent applications increases first and then decreases over time. Fig. 12 shows the impact of STI environmental policy on patent applications and GDP.
Scenario C output.

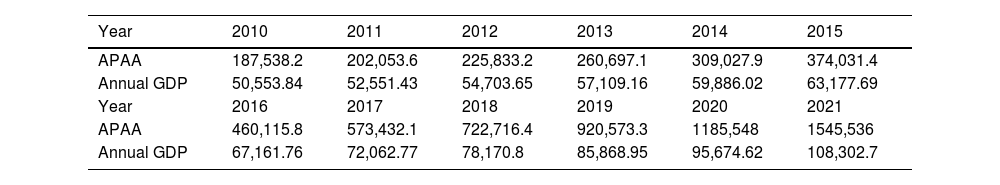
The results analyzing STI supply and demand policies show that this combination has a positive impact on patent applications and GDP. Comparing Tables 6 and 10 reveals that the positive impact of the combination of supply and demand policies on patent applications and GDP gradually increases over time, and the impact on patent applications is significantly greater than that of GDP. The specific impact degree is shown in Fig. 13.
Scenario D output.

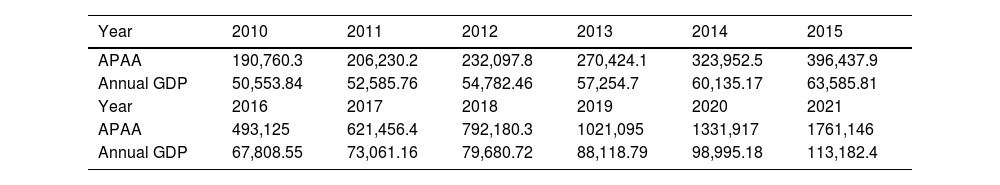
When the supply policy and environmental policy of STI are changed, the research finds that the combination of supply policy and environmental policy has a positive influence on patent applications and GDP. Comparing Tables 6 and 11 reveals that the positive impact of the combination of supply policy and environmental policy on patent applications and GDP increases with time. Among them, the impact of supply policy and environmental policy combination on patent applications is significantly greater than that of GDP, as shown in Fig. 14.
Scenario E output.

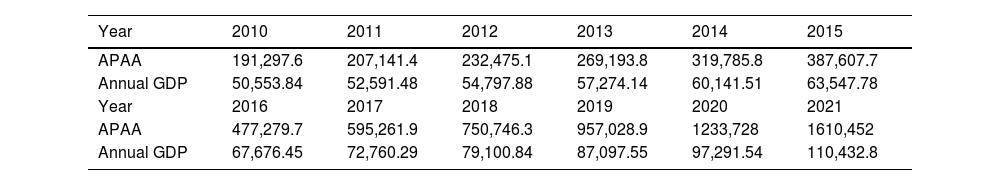
The study finds that the combination of STI demand and environmental policies has a positive impact on patent applications and GDP. Comparing Tables 6 and 12 reveals that the positive impact of the combination of STI demand and environmental policies on patent applications and GDP gradually increases over time, and the impact on patent application first increases, then stabilizes, and increases again. Specific to the degree of impact, the impact of the combination of demand and environmental policies on patent applications is significantly greater than that of GDP, as shown in Fig. 15.
Scenario F output.

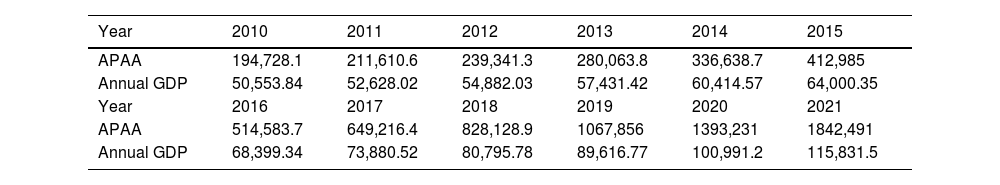
The results show that the combination of STI supply policy, demand policy, and environmental policy has a positive impact on patent applications and GDP. Comparing Tables 6 and 13 reveals that the positive impact of the combination of all three policies on patent applications and GDP gradually increases over time. In terms of the degree of impact, the impact of this combination of policies on patent applications is significantly greater than that of GDP, as shown in Fig. 16.
Scenario G output.

This study presents a system simulation framework to examine the relationship between STI supply, demand, and environmental policies from a systematic perspective. The combined effect between STI supply, demand, and environmental policies is analyzed in detail using a simulation experiment design. The method proposed in this study describes the causal relationships between the factors of the STI policy analysis system in detail and verifies the effectiveness of the method using data from the Guangdong Statistical Yearbook. This study uses the MAPE index to verify the proposed method, demonstrating show that the proposed method is effective and has the functions required to achieve the research purpose. Therefore, the research results are considered to be scientific and accurate.
This study analyzes STI supply, demand, and environmental policies, and the results demonstrate the direction in which different types of STI policies influence STI and economic development. Among them, STI environmental policy, which is composed of enterprise financing and tax policies appears to restrict STI and economic development, whereas STI supply policy, composed of a capital investment and talent training policies, and STI demand policy, composed of an intellectual property and intermediary service policies, will promote STI and economic development.
In addition, this study reveals the roles of different types of STI policies and combinations on STI and economic development. For various types of STI policies, under the same degree of policy changes, the promotional effect of the STI supply policy on STI and economic development is significantly greater than that of the STI demand policy. Furthermore, among all STI policy combinations, the combination of supply and demand policies has the greatest promotional effect on STI and economic development, while the combination of demand and environmental policies has the least promotion effect on STI and economic development. More specifically, the promotional effect of policy combination on STI and economic development is in the order of supply and demand policy combination > supply, demand, and environmental policy combination > supply and environmental policy combination > demand and environmental policy combination.
Comparing the combined effect of STI supply and demand policies with the effect of supply policy and the effect of demand policy reveals that the combined effect of STI supply and demand policies is greater than the sum of the effects of supply and demand policies. This phenomenon is also basically evident for other combined effects.
ConclusionIn the actual implementation of STI policies, multiple types of policies are often combined to exert a joint effect. Therefore, a single investigation of one type of policy neglects the interaction and connection among policies. In this regard, this study examines the relationship between STI supply, demand, and environmental policies from a systematic perspective, revealing the combined effect of various STI policies. The empirical results show that the combined effect of various STI policies is not the simple addition of the effects of various policies. Furthermore, a synergy phenomenon of the combined STI policy effects indicates that the interactions and connections between policies will be neglected if only a single policy type is investigated.
Although this study has presented some beneficial achievements, the following limitations need to be improved. First, this study only selects two typical and representative policies for each of the three policy types. Second, policy uncertainty is not considered. Third, this study only reflects on the economic and government sectors. In fact, policies also have an impact on the social sector, that is society, communities, NGOs (e.g. through education, employment effects). Therefore, in the future, we can conduct further research on the above areas that require improvement including more STI policies, the mechanism of STI policy uncertainty, and the impact on the social sector.
Data availability statementThe data used to support the findings of this study are included within the article.
CRediT authorship contribution statementMeirong Zhou: Conceptualization, Data curation, Funding acquisition, Writing – original draft, Methodology, Formal analysis, Visualization, Project administration. Wenhao Huang: Formal analysis, Methodology, Writing – review & editing, Supervision. Abbas Mardani: Conceptualization, Writing – review & editing.
This work has been supported by the China Postdoctoral Science Foundation under Grant 2021M693775.