


Industry is the main source of carbon emissions, and reducing emissions is closely linked to advancing carbon neutrality. Moreover, technological innovation is crucial for industrial low-carbon development. This study uses provincial panel data from China covering 2010 to 2023 and employs the Stochastic Non-smooth Envelopment of Data model to measure industrial carbon emissions efficiency. Combining listed companies’ green patent text data, we calculate related and unrelated green technological diversification to investigate the impact of related and unrelated green technological diversification on industrial carbon emissions efficiency using a panel quantile model. The study also explores the moderating role of technological specialisation, revealing that related and unrelated green technological diversification promote industrial carbon emissions efficiency at different quantile levels; however, the positive effect diminishes as quantile levels rise. Furthermore, related green technological diversification has a stronger impact than unrelated green technological diversification, and related and unrelated green technological diversification have a greater effect on accelerating industrial carbon emissions efficiency in non-coastal, low-income and low market share regions. Finally, technological specialisation has a stronger complementary impact on related green technological diversification than on unrelated green technological diversification in enhancing industrial carbon emissions efficiency. The conclusions of this study provide novel insights into advancing industrial green transformation.
Climate change poses serious, long-term challenges to human society (Liu & Feng, 2022a). Events attributed to global warming resulting in economic losses and casualties have become increasingly frequent in many countries. One of the primary factors contributing to global warming is increased carbon emissions. According to Carbon Monitor data, industrial production is the primary source of these emissions (Hu et al., 2024). As industrialisation advanced, China’s carbon emissions surged, making the nation the world’s largest carbon emitter (Friedlingstein et al., 2019). In recent years, China has prioritised the issue of climate change, implementing a series of carbon mitigation measures. China has also committed to reaching peak carbon emissions by 2030 and carbon neutrality by 2060; however, the nation is still in a phase of deepening economic development, and the demand for energy remains strong. Therefore, it is necessary and meaningful to use China as a case study to explore suitable and effective carbon mitigation strategies and share these approaches and experiences with other emerging countries. Carbon emissions efficiency reflects the effectiveness of carbon mitigation from input and output perspectives, which aligns with the practical need to balance economic development and carbon mitigation. Carbon emissions efficiency has often been measured using a single- or multi-factor index. The single-factor index has typically been constructed using metrics such as the ratio of carbon emissions to total energy consumption (Liu et al., 2022) and carbon emissions per unit of added value (Zhang et al., 2024a). Although the calculation of the single-factor index is straightforward, it does not account for other factors that influence carbon emissions efficiency. Compared with the single-factor index, a multi-factors index can provide a more accurate reflection of carbon emissions efficiency as it can account for multiple inputs and desirable and undesirable outputs.
The primary methods for assessing multi-factor carbon emissions efficiency is stochastic frontier analysis (SFA) and data envelopment analysis (DEA). For example, Zhang and Chen (2021) used the SFA model to evaluate overall carbon emissions efficiency. However, this model has limitations due to its specific functional form and it is only suitable for a single output (Dellnitz & Kleine, 2019). Among various DEA models, the slacks-based measure (SBM) is widely used for productivity assessments, particularly when dealing with undesirable outputs. Wen et al. (2022) used the SBM method to evaluate carbon emissions efficiency. Nevertheless, slacks in inputs and outputs can produce inaccuracies in the DEA model’s assessment of industrial carbon emissions efficiency, resulting in recent studies increasingly adopting modified DEA models. For instance, Xu et al. (2023) applied the Super-SBM model to assess carbon emissions efficiency in the construction sector, and Zhang et al. (2023) used a Super-SBM-DEA model to measure carbon emissions efficiency across 32 industrial sectors. Additionally, Zhang et al. (2024b) employed a three-stage SBM-DEA model to analyse the carbon emissions efficiency of land use in the Yangtze River Delta urban agglomeration from 2010 to 2021.
Carbon mitigation is crucial for advancing the sustainable growth of the global economy, and technological innovation has a vital role in reducing carbon emissions (Xie et al., 2021). As technological innovation involves significant risks and expenses, it requires substantial technological capabilities. One aspect of technological innovation is diversification, which refers to companies broadening innovation efforts across various technological domains (Breschi et al., 2003). Technological diversification can be categorised into related and unrelated types based on the connections between new and existing technologies (Kim et al., 2009). Related green technological diversification focuses on innovation in multiple specialised areas of a specific category, whereas unrelated green technological diversification spans different categories (He et al., 2017). Extensive research has demonstrated that green technological innovation significantly boosts energy efficiency (Yasmeen et al., 2023). The concept of relatedness is crucial in the green diversification process (Balland & Boschma, 2021). Green technologies often involve innovative combinations of previously unused technical elements, which increases their complexity and uncertainty compared with non-green technologies (Barbieri et al., 2020b). These technologies require cross-domain integration in which knowledge from various fields converges to drive groundbreaking innovations (Ding et al., 2022a). Although green technologies initially emerged in developed nations, the need for technological diversification is particularly pressing for developing countries (Perruchas et al., 2020).
Several studies have explored how technological diversification impacts regional economic growth. Balland et al. (2020) examined the relationship between technological diversification and urban economic activities. Barbieri et al. (2020b) determined that green technologies have significantly greater knowledge spillover effects than non-green technologies and geographic proximity is essential for creating and spreading complex knowledge. The effectiveness of green technology depends on various factors, including geography and technological development (Moreno & Ocampo-Corrales, 2022). Zheng and Ran (2021) used China’s patents to conduct an empirical analysis, finding that unrelated technological diversification has a greater impact on regional economic growth than related diversification. Rocchetta et al. (2022) analysed a sample of 268 European regions to demonstrate the nonlinear effects of technological diversification on regional productivity. However, the effects of related and unrelated green technological diversification on carbon mitigation in developing economies have not been examined. Current research has largely assessed technological diversity using entropy indices (Kim et al., 2016; Choi & Lee, 2021; Lin et al., 2023) and focusing on the quantity of technologies. In addition to technological diversification, technological specialisation is another key factor of technological innovation. Specialising in green technology promotes the clustering of innovative activities, increases green knowledge concentration and reduces the costs of converting tacit knowledge (Liao & Li, 2022). Furthermore, specialisation supports labour market growth focused on specific stages and significantly reduces the transaction costs related to green innovation processes (Perret, 2022). Many studies have demonstrated that technological specialisation significantly boosts economic activities nationwide. For example, Liao and Li, 2022 analysed the effects of green technology specialisation on green development, and Sergio et al. (2023) explored the significant spillover effects of specialisation in high-tech sectors on innovation performance in member countries of the Organisation for Economic Development and Co-operation. However, research on the impact of technological specialisation on carbon reduction has been limited. Current methods for assessing specialisation have primarily used location entropy and the Hovinda index (Liao & Li, 2022). Furthermore, it is crucial to explore effective integration of green technological diversification and technological specialisation.
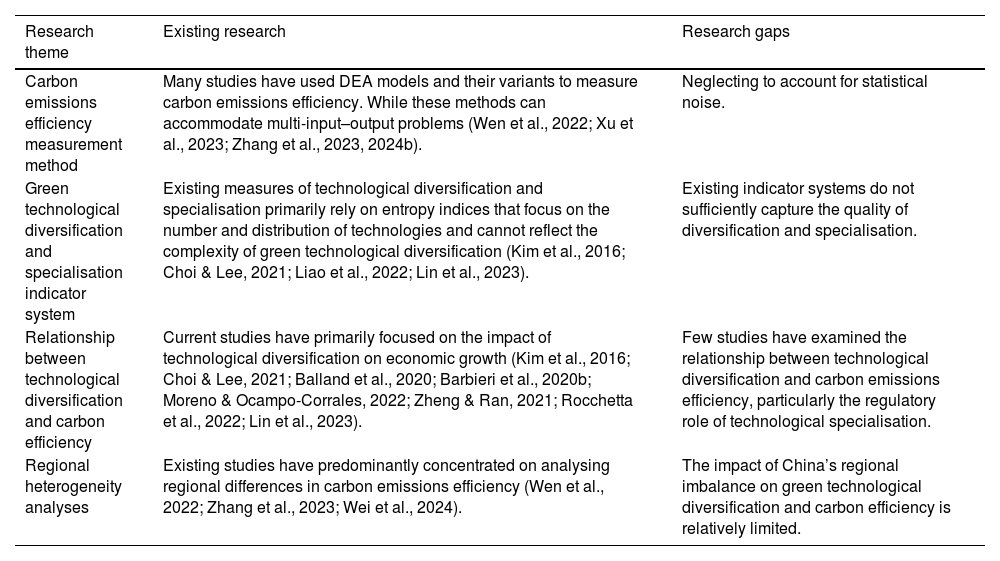
Previous research has offered valuable insights into the relationship between green technology diversification and specialisation in terms of carbon emissions; however, several notable research gaps remain. Table 1 summarises the existing research and research gaps. First, the current methodology for evaluating China’s carbon efficiency requires significant improvement. DEA is recognised as a deterministic and entirely non-parametric approach and is among the most frequently employed techniques for assessing carbon emissions efficiency (Wen et al., 2022; Xu et al., 2023; Zhang et al., 2023, 2024b). However, DEA cannot account for statistical noise, leading to the conclusion that any deviation from the efficiency frontier is solely due to inefficiency (Yen et al., 2023). Second, China lacks specific indicators for green technology diversification, and most recent research in this area have originated from European studies (Castellani et al., 2022; Montresor & Quatraro, 2020; Cicerone et al., 2023; Santoalha et al., 2021a, b; Barbieri et al., 2023). Existing metrics for technological diversification and specialisation has primarily used entropy indices (Kim et al., 2016; Choi & Lee, 2021; Liao & Li, 2022; Lin et al., 2023). However, these indices may not fully capture the intricacies of green technological diversification, and relying on a single index is insufficient to represent the nature of technological specialisation. Additionally, these methodologies focus on the quantity and distribution of technologies but neglect the quality of technology. Third, previous research on the impact of green technology diversification on carbon emissions have been inadequate, particularly in analysing regional disparities. The effectiveness of green technology diversification is significantly influenced by local technological infrastructure (Grashof & Basilico, 2024).
Previous research and research gaps.
| Research theme | Existing research | Research gaps |
|---|---|---|
| Carbon emissions efficiency measurement method | Many studies have used DEA models and their variants to measure carbon emissions efficiency. While these methods can accommodate multi-input–output problems (Wen et al., 2022; Xu et al., 2023; Zhang et al., 2023, 2024b). | Neglecting to account for statistical noise. |
| Green technological diversification and specialisation indicator system | Existing measures of technological diversification and specialisation primarily rely on entropy indices that focus on the number and distribution of technologies and cannot reflect the complexity of green technological diversification (Kim et al., 2016; Choi & Lee, 2021; Liao et al., 2022; Lin et al., 2023). | Existing indicator systems do not sufficiently capture the quality of diversification and specialisation. |
| Relationship between technological diversification and carbon efficiency | Current studies have primarily focused on the impact of technological diversification on economic growth (Kim et al., 2016; Choi & Lee, 2021; Balland et al., 2020; Barbieri et al., 2020b; Moreno & Ocampo-Corrales, 2022; Zheng & Ran, 2021; Rocchetta et al., 2022; Lin et al., 2023). | Few studies have examined the relationship between technological diversification and carbon emissions efficiency, particularly the regulatory role of technological specialisation. |
| Regional heterogeneity analyses | Existing studies have predominantly concentrated on analysing regional differences in carbon emissions efficiency (Wen et al., 2022; Zhang et al., 2023; Wei et al., 2024). | The impact of China’s regional imbalance on green technological diversification and carbon efficiency is relatively limited. |
To address these gaps, we employ the Stochastic Non-smooth Envelopment of Data (StoNED) model to measure carbon emissions efficiency, developing an index for green technological diversification using relative technological density and green patent text data. Moreover, the research explores the impact of green technological diversification on carbon emissions efficiency while also considering regional disparities. We also examine how technological specialisation moderates the relationship between green technological diversification and carbon emissions efficiency. These findings provide specific policy recommendations to support China’s carbon peak and neutrality goals.
The main contributions of this study are as follows. First, in contrast to previous studies that have only used DEA or SFA, we use the StoNED model integrating DEA and SFA to measure industrial carbon emissions efficiency. This model can directly incorporate undesirable outputs and offers a simpler calculation process. Application of the StoNED model for calculating industrial carbon emissions efficiency has been limited. Second, unlike previous studies that used the HI index based on the number of patents (Kang & Sohn, 2016), we use green patent text data and follow three steps to identify technological advantage, calculate technological density and classify types of technological diversification. Third, we investigate the relationship between green technological diversification and industrial carbon emissions efficiency, considering heterogeneous development across various regions. We also further analyse how technological specialisation amplifies the effect of green technological diversification on industrial carbon emissions efficiency.
The remainder of this paper is organised as follows. Section 2 presents our research hypotheses. Section 3 outlines the variables and the model used in the study. Section 4 presents the empirical results, and section 5 provides the discussion. Finally, section 6 draws the conclusions and provides the policy implications.
Research hypothesesWe next present the assumptions that clarify the relationship between green technological diversification and carbon emissions efficiency and the moderating role of technological specialisation. Fig. 1 illustrates our theoretical framework.

Granstrand and Sjölander (1990) initially introduced the concept of technological diversification to distinguish it from product diversification. Technology is considered to be a unique form of knowledge (Xie et al., 2021; Yen et al., 2023; Kang and Sohn, 2016; Harris, 2021; Pinheiro et al., 2025; Perret, 2022). Consequently, technological diversification is defined as the degree of knowledge diversification among firms within a region (Ceipek et al., 2019). This concept reflects the ongoing process of firms’ innovation and the integration of new technologies. Technological diversification changes enterprises’ technological portfolios and structure, which improves product quality and promotes new product development (Zheng & Ran, 2021). Firms engage in technological diversification to increase the likelihood of successful technological innovation and improve product efficiency (Breschi et al., 2003; Catalán et al., 2022). This strategy helps to eliminate technological lock-in and reduces inherent research and development (R&D) risks (Garcia-Vega M, 2006; Kim et al., 2016; Choi & Lee, 2021).
Green technological innovations simultaneously enhance natural resource efficiency and reduce carbon emissions (Barbieri et al., 2020b; Meng et al., 2022). Green technologies rely on integrating knowledge and expertise from various sources (Barbieri et al., 2020b; Li, Heimeriks & Alkemade, 2021; Moreno & Ocampo-Corrales, 2022) and depend on the convergence of diverse knowledge across different domains to generate breakthrough innovations (Ding et al., 2022a). Green technologies are typically more complex and novel than non-green technologies, resulting in higher costs and slower returns (Barbieri & Consoli, 2019; Ning & Guo, 2022). The reorganisation of various technological fields prevents technology from being locked into environmental pollution (Santoalha & Boschma, 2021a) and facilitates the emergence of new green technologies (Orsatti et al., 2020). Green technologies allow firms to improve products and services during technological diversification, lowering costs and enhancing carbon emissions efficiency. This evidence suggests that green innovation depends on firms’ ability to leverage the depth and breadth of technologically diverse knowledge (Ning & Guo, 2022).
The effects of green technological diversification on emissions reduction demonstrate path dependence (Hidalgo et al., 2018; Hidalgo, 2021; Ning & Guo, 2022). Related green technology diversification enhances carbon efficiency through several mechanisms. (i) Core green technologies lower the marginal costs of green innovation (Breschi et al., 2003; Kim et al., 2016; Barbieri & Consoli, 2019; Ning & Guo, 2022). Technological relatedness is a crucial driving force for technological diversification (Frenken & Boschma, 2007; Boschma, 2017; Yeung, 2021; Santoalha & Boschma, 2021a). (ii) Similarities and complementarities across green technologies can enhance knowledge dissemination efficiency within a region (Boschma, 2017). Firms are more likely to develop green technologies within familiar domains, can establish new comparative advantages (Yeung, 2021). In contrast, the emissions reduction effects of unrelated green technology diversification face two main constraints. First, while it is effective in overcoming technological lock-in Leten et al. (2007), cross-domain knowledge exploration typically requires longer development-to-commercialisation cycles for emerging green technologies (Hausmann & Hidalgo, 2011; Choi & Lee, 2021). Second, diversifying into unfamiliar technological areas entails additional costs for knowledge integration and organisational coordination (Seru, 2014), which may partially counteract short-term emissions reduction gains (Hausmann & Hidalgo, 2011). Unrelated green technology diversification can stimulate the development of breakthrough green technologies but its positive impact on carbon emissions efficiency is conditional and time-lagged (Dawley et al., 2019; MacKinnon et al., 2019; Harris, 2020; Frangenheim et al., 2020; Choi & Lee, 2021). Based on this analysis, we propose the following hypotheses:
H1a Related green technological diversification has a positive impact on carbon emissions efficiency.
H1b While unrelated green technological diversification also has a positive impact on carbon emissions efficiency, it is smaller than that of related technological diversification.
While climate change is a global concern, implementing localised innovative strategies is essential to effectively address this challenge (Perruchas et al., 2020; Liu et al., 2024). The diverse characteristics of different regions, stemming from a complex historical context, can make strategies difficult to replicate in other areas (Maskell & Malmberg, 1999). These characteristics encompass various factors such as the regional economy, geographical location and resource endowment. Furthermore, the frequency of technological innovation activities is closely linked to these regional factors (Du et al., 2019; Milindi & Inglesi-Lotz, 2022). Green technology professionals’ distribution across regions is uneven, and significant disparities exist in the technological capabilities needed to develop new green initiatives (Corradini, 2019; Barbieri & Consoli, 2019; Perruchas et al., 2020).
Green technologies that depend on complex knowledge are often localised (Dosi et al., 2017). The generation and spread of knowledge can be influenced by local socio-economic and cultural factors (Perruchas et al., 2020). Related green technological diversification is more reliant on the local technological foundations than unrelated diversification (Montresor & Quatraro, 2020; Santoalha & Boschma, 2021a) as regions prioritise technologies that align with existing capabilities.
First, high-income regions promote green technological diversification with robust human capital, varied knowledge bases and well-developed infrastructure (Du et al., 2014; Pinheiro et al., 2022). This diversification enhances economies of scale by promoting knowledge spillovers and technology accumulation. However, once technological diversification exceeds a certain threshold, its marginal benefits may begin to decline (Lin et al., 2023). Excessive technological diversification can lead to an overly complex knowledge system, increasing information costs and impeding knowledge diffusion (Perruchas et al., 2020). Second, coastal areas are characterised by sophisticated transportation infrastructure and a diverse knowledge–technology base (Grashof et al., 2024). Nevertheless, a high degree of technological agglomeration may reduce resource allocation efficiency. In these areas, the benefits of green technological diversification depend on innovation capabilities and the ability to absorb innovations, and its positive impact tends to decline when exceeding the optimal scale (Liu et al., 2021). Third, while market-oriented environments promote information spread, they can also introduce competition that hinders green technology development (Hua et al., 2022). In addition, technological risks such as fluctuating renewable energy prices and uncertain returns on investment, along with resource mismatches due to market segmentation, could impede the transition to a low-carbon economy (Athari and Kirikkaleli, 2024; Ding et al., 2022b; Li et al., 2023).
Therefore, whether regional heterogeneity is related green technological diversification or unrelated green technological diversification, we propose the following hypotheses:
H2a Green technological diversification has a greater impact on carbon emissions efficiency in low-income regions than high-income regions.
H2b The effect of green technological diversification on carbon emissions efficiency is stronger in non-coastal regions than coastal regions.
H2c Green technological diversification in low market regions has a greater influence on carbon emissions efficiency compared with highly market-oriented regions.
The study of specialisation can be traced back to Adam Smith’s propositions in his seminal work The Wealth of Nations (Smith, 1937). Subsequently, the concept of vertical specialisation was introduced into the field of international trade in the 1960s and 1970s (Hummels et al., 2001). Technological specialisation first emerged in firms’ technological decision-making (Granstrand & Oskarsson, 1994). Firms that adopt this strategy can enhance core competencies in familiar technological fields at lower costs (Breschi et al., 2003; Garcia-Vega, 2006; Liao & Li, 2022). Regions achieve specialisation in particular technological fields, which reduces firms’ R&D costs in related areas (Kim et al., 2016; Choi & Lee, 2021). Green technology specialisation fosters spatial clustering of specific innovation activities, and this clustering facilitates intensive knowledge sharing during the innovation phase and minimises the transaction costs associated with tacit knowledge transfer (Kemeny et al., 2022). Additionally, green technology specialisation promotes shared labour markets for specific innovation stages, which reduces employment costs and stabilises innovation activities (Perret, 2021). Green technology specialisation is rooted in common interests and long-term cultural accumulation, which encourages collaboration among firms, enhancing innovation efficiency (Liao & Li, 2022). Green technological diversification offers greater benefits for carbon emissions efficiency, which are more pronounced for specialised firms (Catalán et al., 2022).
However, technological diversification and specialisation are two distinct strategies that can guide firms’ technological innovation. Pursuing both strategies simultaneously can be particularly challenging for firms with limited resources (Chen & Guo, 2023a). Green technological diversification requires higher coordination and integration costs according to Ning and Guo (2022). Therefore, competitive firms may prefer to enter markets that are similar to their existing resource profiles to reduce the cost of technology transfer (Chiu et al., 2008; Kemeny et al., 2022). Firms can achieve economies of scope by sharing green technology resources, which include technical expertise and skilled labour (Ning & Guo, 2022). However, developing technology-diversified industries related to a core industry has diminishing returns to scale for R&D as investment in a specific technological field accumulates (Kim et al., 2016; Choi & Lee, 2021). Green innovation activities require diverse knowledge capabilities (Ardito et al., 2019) and significant systemic changes (Ning & Guo, 2022). Innovators who engage in recombination with cognitive distance may face increased uncertainty (Barbieri et al., 2020a). Technological specialisation can mitigate the diminishing returns associated with technological diversification somewhat. However, this is particularly challenging in unrelated technological domains with high uncertainty (Choi & Lee, 2021; Grashof et al., 2024). Based on the above, we propose the following hypotheses:
H3a Green technological specialisation positively moderates the relationship between related green technological diversification and carbon emissions efficiency.
H3b Green technological specialisation has a greater complementary effect on related green technological diversification than unrelated green technological diversification.
Referencing Dai et al. (2024), we employ the StoNED method to assess the industrial CEE of 30 provinces and cities in China. The input–output indicators are detailed as follows:
- (1)
We use energy, capital and labour as input indicators, which are represented by the end consumption of various energy sources in the industrial sector, the average net value of industrial fixed capital and the average employment of regional industry.
- (2)
The expected output indicator is value added by regional industry.
- (3)
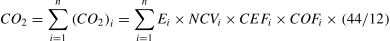
The unexpected output indicator is the amount of industrial carbon emissions calculated by the Intergovernmental Panel on Climate Change, which is based on industrial energy consumption. The detailed formula is as follows:
We employ a three-step approach to measure related (RD) and unrelated (UD) technological diversification.
First, we identify the revealed technological advantage (RTA) using a method adapted from Hidalgo et al. (2007) to reflect technological specialisation as follows:
where i represents the province, j denotes the technology field as defined by the four-digit International Patent Classification code. Patentijt indicates the number of patents in province i at time t in technology field j. RTA ijt is a binary variable used to determine whether province i at time t in technology field j possesses a comparative advantage. When RTA ijt = 1, it indicates that province i has achieved a technological advantage at time t in technology field j, otherwise it signifies that province i has not attained a technological advantage at time t in technology field j.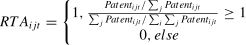
Second, we calculate technological density based on the identified RTA, following the methodology outlined by Balland and Boschma (2021). This step reflects the capabilities of existing specialised technologies.
where j represents a technological field that has not yet been specialised but is highly related to the specialised technological field j’. We determine the relatedness of technological fields using the principle of co-occurrence of patent applicant information within the same patent. Densityijt denotes the capabilities of technology field j in province i at time t, which we measure using the ratio of the sum of all comparative advantage technological fields j’ related to technological field j at time t for province i, to the sum of all technological fields j’ related to technological field j at time t.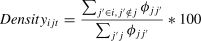
Third, we further assess related and unrelated green technological diversification based on technological density, as referenced by Zheng and Ran (2021).
where O represents the collection of technology fields that do not exhibit a comparative advantage in province i at time t. 〈Densityit〉O denotes the average technological capabilities within the ensemble. σO(Densityit) represents the standard deviation of the technological capabilities in the ensemble. When ωijt>0, it indicates that the capability of technological field j in province i is relatively ample and is related to green technological diversification. When ωijt<0, it suggests that the capability of technological field j in province i is relatively small and represents unrelated green technological diversification.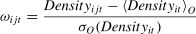
In summary, we quantify the number of technological fields in related and unrelated green technological diversification as the values of RD and UD variables, respectively. RD and UD represent the related and unrelated green technological diversification of province i at time t. A higher RD value indicates that a region demonstrates a stronger propensity to achieve diversification within relevant green technology domains. Conversely, a greater UD value suggests that the region’s green technology diversification activities are increasingly focused on unrelated fields.
Moderating variable: technological specialisation (TS)The moderating variable is TS. Referencing Balland and Boschma (2021), when technological field j in province i at time t has a comparative advantage, this indicates that province i has achieved TS in technological field j at time t. Therefore, TS = 1, otherwise, TS = 0.
Control variablesThe control variables include industry structure (IS), energy structure (ES) and ownership structure (MS). is measured by the proportion of secondary industry value added in regional GDP, ES is calculated as the proportion of coal consumption in the total industrial energy consumption in the province and MS is represented by the ratio of the number of employees in state-owned enterprises to the total number of employees in the region (Kang & Kim, 2012).
Due to the absence of data from Tibet, we use panel data from 30 provinces and regions in China covering 2010–2023. As described, the input–output data for CEE include labour, capital and industrial output, which we source from the China Statistical Yearbook and the China Industrial Economy Statistics Yearbook. We adjust capital and industrial outputs according to the fixed assets investment price index and the industrial producer price index published by the China National Bureau of Statistics. Data on energy consumption and industrial carbon emissions are obtained from the China Energy Statistics Yearbook and converted into standard coal equivalent. Additionally, we use green patent text data for listed companies in the China National Knowledge Infrastructure patent database for 2010–2023. Data for control variables are also sourced from the China Statistical Yearbook. Any missing data are supplemented by the annual average growth rate and interpolation methods. Table 2 presents the descriptive statistics for all the variables.
To test the variables’ stationarity, we conduct the Fisher–Phillips–Perron unit root test for each variable, presenting the results in Table 3. Both the horizontal sequence and the first-order difference sequence of all the variables reject the null hypothesis (that a unit root exists) at a 1 % significance level. This indicates that all the variables are stable.
Unit root test results.
Notes: Null hypothesis: a unit root exists. ***, **and * denote 1 %, 5 % and 10 % significance levels, respectively. p-values are in parentheses.
CEE evaluation often uncovers undesirable outputs. DEA is widely used to assess complex systems with multiple inputs and outputs and is particularly effective in addressing undesirable outputs, such as carbon emissions (Wen et al., 2022; Xu et al., 2023; Zhang et al., 2023, 2024b). Chung et al. (1997) proposed a novel radial directional distance function (DDF) that provides an advanced analytical framework for evaluating environmental efficiency in the context of undesirable outputs. Gémar et al. (2018) used a non-radial DEA model to assess CEE. Ferreira et al. (2023) incorporated uncertainty factors to evaluate eco-efficiency, which enhanced the robustness and reliability of the assessment framework. Furthermore, Sala-Garrido et al. (2023) integrated cross-efficiency techniques into the eco-efficiency evaluation framework. In a recent study, Chen et al. (2023b) introduced a temporal dimension into their analysis. Traditional DEA methods are vulnerable to statistical noise that can distort estimates of CEE. SFA has the significant limitation of requiring a specific functional form of production technology. Kuosmanen and Kortelainen (2012) introduced the StoNED technique to address these challenges, which combines the non-parametric approach of DEA with the stochastic frontier framework of SFA to simultaneously accommodate flexibility and noise. This method maintains the non-parametric nature of DEA and eliminates the need to specify a predefined production function. It also incorporates the stochastic error term derived from SFA, which helps decompose deviations from the efficiency frontier into random error and inefficiency components. The StoNED model is constructed as follows:
where x represents the inputs, y denotes the outputs and f signifies the boundary of the production possibility set. We decompose the disturbance term (εit) into a non-efficiency component (ui) and a random error term (vit), where ui∼N(0,δu2), vit∼N(0,δv2).
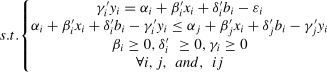
This study employs a multi-step approach to estimate the StoNED model. First, we apply the following CNLS-DDF method to estimate parameters based on multiple input and output data:
where the first constraint defines the distance to the frontier as a linear function of inputs and outputs. The second set of constraints includes Afriat inequalities, which impose global concavity. The third constraint is a normalisation constraint that ensures the translation property. The fourth constraint imposes a monotonically increasing limit on the production function.
Second, we use the following conditional expectation as the point estimator for the first moment of the non-efficiency term ui:

Third, estimation of efficiency is calculated using formula (7) as follows:

To further investigate the regional characteristics of China’s industrial CEE, we categorise 30 provinces and municipalities into eight comprehensive economic zones based on the Strategy and Policy for Regional Coordinated Development. These zones are the Northeast Region (Liaoning, Jilin and Heilongjiang), the North Coastal Region (Beijing, Tianjin, Hebei and Shandong), the East Coastal Region (Shanghai, Jiangsu and Zhejiang), the South Coastal Region (Fujian, Guangdong and Hainan), the Middle Yellow River Region (Shaanxi, Shanxi, Henan and Inner Mongolia), the Middle Yangtze River Region (Hubei, Hunan, Jiangxi and Anhui), the Southwest Region (Yunnan, Guizhou, Sichuan, Chongqing and Guangxi) and the Northwest Region (Gansu, Qinghai, Ningxia and Xinjiang). The CEE of these eight comprehensive economic zones and the entire country exhibits the following characteristics.
At the national level, CEE exhibited a trend of initial decline followed by a rise from 2010 to 2023. Additionally, the CEE in east coast and north coast regions was generally high, while it was comparatively lower in the south coast region. The east coast and north coast regions benefit from significant geographical advantages and have high-quality industries; however, environmental protection efforts in the south coast region have not kept pace with economic development. The CEE in the Middle Yellow River region, southwest region and other areas was relatively higher, which can be attributed to effective local carbon mitigation policies. Conversely, the CEE in the northwest region is the lowest, which is primarily attributable to the region’s underdeveloped economy and a long-standing focus on the secondary industry. Fig. 2 presents a heat map illustrating CEE across Chinese provinces, where darker colours signify higher efficiency.
Panel quantile regression model
Compared with least squares regression, quantile regression has more flexible application conditions and can effectively capture the tail characteristics of a distribution. When independent variables have varying effects at different positions within the dependent variable’s distribution, quantile regression provides a more comprehensive description of these distributional characteristics. Consequently, quantile estimation is more robust than least squares estimation (Zhu et al., 2016). The panel quantile regression model is constructed as follows:
where Q(yit|xit,ai)=xit′β+ai(τ), τ is a conditional quantile, yitis the dependent variable, xit is the independent variable, ai is individual fixed effect and ζit is the random error.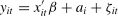
Since variables’ normality is a fundamental assumption of the traditional mean regression model, it is essential to confirm normality before conducting panel quantile regression. If the sample data are normally distributed, the traditional mean regression model can be employed to analyse the impact of technological diversification on CEE. Conversely, if the data are not normally distributed, the traditional mean regression model may yield biased estimates, and the panel quantile regression model is more suitable. This study presents a Quantile-Quantile (Q-Q) plot to assess the normality of the variables (Fig. 3). If a variable follows a normal distribution, the scatter plot should approximate a diagonal line. Based on this analysis, the Q-Q plot indicates that none of the variables fully adhere to a normal distribution, indicating that the panel quantile regression model is the appropriate choice.
Empirical resultsRegression resultsBenchmark estimation
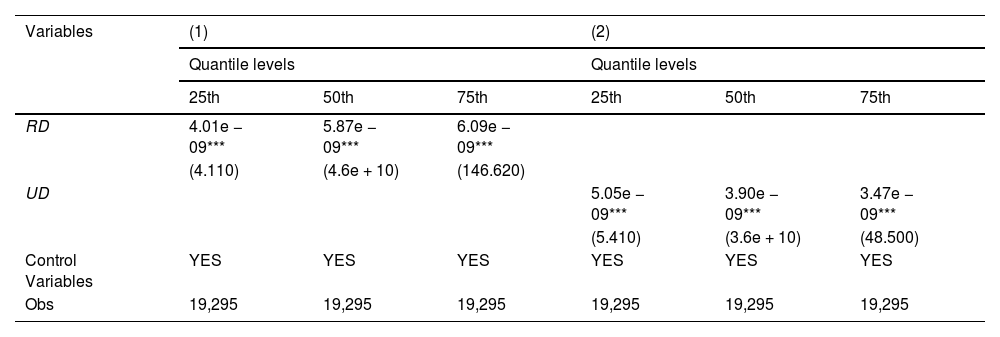
We employ the panel quantile regression model to estimate the impact of RD and UD on CEE. The selected quantiles are 25 %, 50 % and 75 %, which correspond to low, medium and high CEE, respectively. We set the bootstrap value at 500, presenting the results in Table 4. Column (1) displays the results of the quantile regression of RD on CEE and column (2) presents the results of the quantile regression of UD on CEE. Overall, the coefficients of RD and UD are significantly positive at the 1 % level, indicating that both factors promote CEE, which supports hypotheses H1a and H1b. The coefficients of 25 %, 50 % and 75 % quantile levels gradually decrease, indicating that the effect of RD and UD on low, medium and high CEE diminishes as the quantile rises. Furthermore, the coefficient for RD is generally larger than that for UD, indicating that RD has a more substantial impact on CEE. This suggests that RD facilitates technological innovation at a lower cost, resulting in higher CEE, which aligns with hypothesis H1b. Related green technological diversification has a more pronounced effect. This phenomenon occurs because related green technological diversification can more effectively enhance short-term carbon efficiency, which is achieved by leveraging the existing technology base, promoting knowledge spillovers and reducing innovation and organisational coordination costs. In contrast, while unrelated green technological diversification holds long-term potential, its short-term impact on carbon emissions is limited by high knowledge integration costs.
Benchmark estimation results.
Note: t-values are in parentheses. (2) ***, ** and * denote 1 %,5 % and 10 % significance levels, respectively.
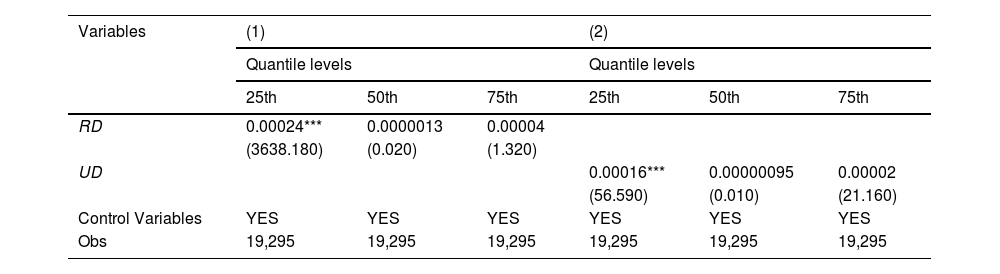
To confirm the robustness of parameter estimation, we employ the Super-SBM model to measure CEE and conduct the panel quantile regression once more. The regression results are presented in Table 5. Both RD and UD significantly enhance the CEE, with RD having a larger impact, which is consistent with the benchmark regression results.
Robustness tests.
Note: t-values are in parentheses. (2) ***, ** and * denote 1 %, 5 % and 10 % significance levels, respectively.
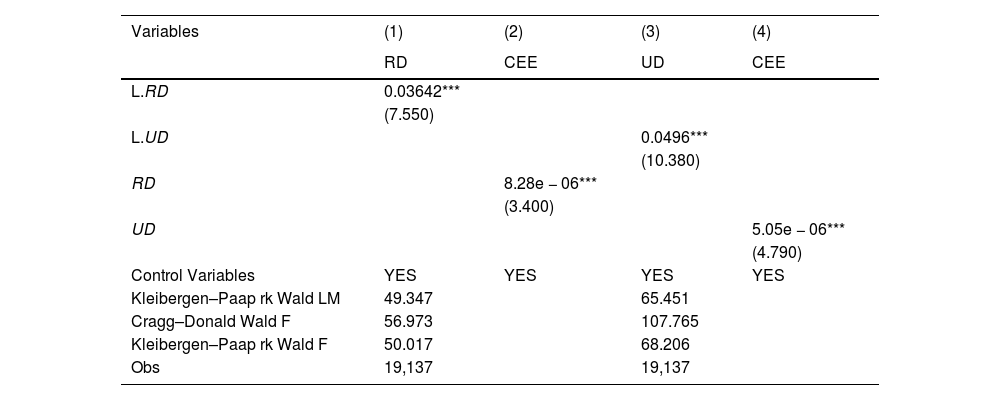
The relationship between RD (or UD) and CEE may exhibit reverse causality, which can lead to endogeneity concerns in model setting. This study employs the two-stage least squares (2SLS) method to address endogeneity. Referencing Li et al. (2021), this study considers the first-order lagged RD and UD as instrumental variables (IVs). Columns (1) and (2) in Table 6 present the regression results of the 2SLS method using the first-order lagged RD. The results show that the effect of the first-order lagged RD on current-period RD is positive, and that current-period RD enhances CEE. Column (3) and (4) in Table 6 report the regression results of the 2SLS method based on the IV of first-order lagged UD, which is also positive and current-period UD accelerates CEE. These results demonstrate that the benchmark regression is robust. The Kleibergen–Paap rk Wald LM test confirms that the model does not have any unidentified issues. Additionally, the Cragg–Donald Wald F test and the Kleibergen–Paap rk Wald F test indicate no weak IV problem.
Endogeneity treatment.
Note: t-values are in parentheses. (2) ***, ** and * denote 1 %, 5 % and 10 % significance levels, respectively.
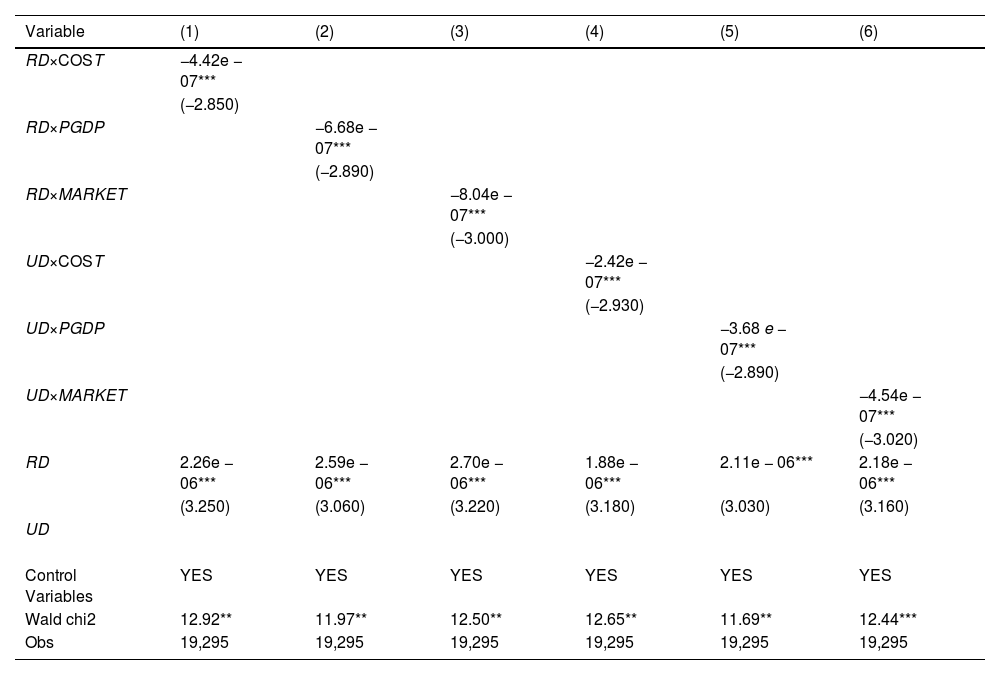
In this section, this study further analyses the heterogeneity of the impacts of RD (or UD) on CEE. To do so, we categorise the sample into three groups based on regional characteristics of geography, economy and market level. These groups include coastal and non-coastal provinces, high-income and low-income provinces and provinces with high and low market levels. If the dummy variable COST = 1, it indicates that the province is located in a coastal region, if the dummy variable PGDP = 1, it signifies that the province’s income is higher than the median income of sample and if the dummy variable MARKET = 1, it suggests that the province’s market capacity exceeds the average income of the sample. Fig. 4 presents heatmaps that depict provincial income levels on the left side and coastal areas on the right side.

Based on this analysis, ordinary least squares estimation results are presented in Table 7, spanning six columns. All coefficients for the interaction terms of RD (or UD) and dummy variables (COST, PGDP, MARKET) are significantly negative at the 1 % significance level. This indicates that RD (or UD) has a more pronounced impact on CEE in non-coastal regions, low-income provinces and provinces with limited market access, supporting hypotheses H2a–H2c, respectively. Coastal regions, with advanced technological infrastructure, have achieved significant green technological diversification; however, its marginal impact tends to diminish, contributing modestly to CEE improvement. Conversely, non-coastal regions with less robust technological foundations are well-positioned to achieve more substantial advancements in technology and innovation. In high-income areas, green technological diversification focuses on optimising existing technologies rather than promoting groundbreaking innovations. In contrast, low-income regions, engaged in economic catch-up, can accelerate technological progress and productivity gains. Furthermore, regions with higher MARKET levels face increased market uncertainty, which may constrain the development of green technology diversification and limit its effectiveness in reducing carbon emissions. In contrast, regions with lower MARKET levels face less uncertainty risk, which advances the effective implementation of green technology diversification.
Heterogeneity analysis.
Note: t-values are in parentheses. (2) ***, ** and * denote 1 %, 5 % and 10 % significance levels, respectively.
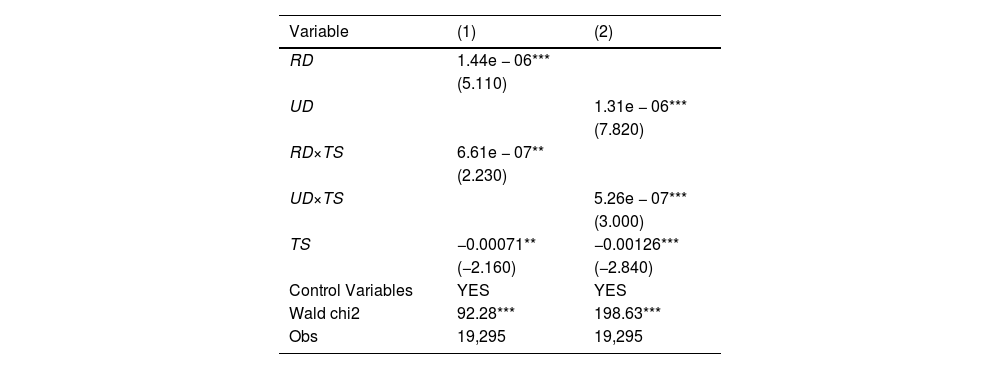
We next introduce an interaction term in our regression analysis to examine the moderating effect of TS on the relationship between green technological diversification and industrial CEE. This term combines TS with related and unrelated green technological diversification. Columns (1) and (2) in Table 8 reveal that the coefficients of the RD ×TS and UD ×TS interaction terms are significantly positive at the 5 % level. This indicates that TS positively moderates the impact of RD and UD on CEE, which verifies hypothesis H3a. Comparing the coefficients of RD×TS and UD×TS, we find that the coefficient of RD×TS is larger than that of UD×TS, indicating that TS has a stronger complementary effect on CEE in RD, which verifies hypothesis H3b. This is because specialisation in green technology enhances the impact of green technology diversification on CEE by reducing R&D costs, facilitating knowledge sharing and stabilising innovation activities. However, firms face the challenge of balancing the costs and diminishing returns when pursuing both technological diversification and specialisation. TS has a more significant impact on carbon efficiency in related technology areas and its moderating effect is limited in unrelated areas with high technological uncertainty.
Moderating effects.
Note: t-values are in parentheses. (2) ***, ** and * denote 1 %, 5 % and 10 % significance levels, respectively.
The industrial sector is the primary source of carbon emissions and reducing related emissions is crucial for achieving China’s carbon peak and neutrality targets. In this context, we offer insights into related and unrelated green technological diversification, while considering the moderating role of TS to examine how these factors influence industrial CEE.
First, we use the StoNED model to estimate the industrial CEE of 30 provinces and cities in China. Compared with the super SBM-DEA model (Xu et al., 2023), we calculate efficiency values ranging from 0.521 to 1, indicating a more concentrated distribution. We suggest that this concentration arises from the StoNED method’s incorporation of a random error term based on the SFA method. This term decomposes residuals into an inefficiency term and a random disturbance term, which enhances the rationality of the results. The StoNED model effectively addresses the issue of statistical noise in measuring CEE but it does not fully capture the complex regional dynamics. We also analyse the current state of industrial CEE in eight integrated economic zones. This analysis contrasts with Cheng et al. (2018), who analysed on three majors regional in eastern and western China, providing a more in-depth exploration of regional differences in industrial CEE.
Second, unlike most studies that measure technological diversification using the entropy index (Choi & Lee, 2021; Kim et al., 2016), we distinguish between related and unrelated green technological diversification using the relative technological density measurements suggested by Zheng and Ran (2021). This approach is more aligned with the true essence of green technological diversification and effectively avoids the statistical bias associated with regions’ inherent technological capabilities. Our empirical results indicate that the positive impact of related green technological diversification on CEE is more pronounced than that of unrelated green technological diversification, which aligns with Castaldi et al. (2015) and Xu et al. (2023). Furthermore, recognising that the knowledge spillover effect of green technological diversification can be influenced by various factors such as local economic conditions and geography, we incorporate regional heterogeneity analysis, considering geographical location, economic status and market level characteristics.
Finally, previous academic debates have largely centred on whether specialisation or diversification activities promote innovation and industrial growth more effectively (Simonen et al., 2015; Santoalha, 2019; Kim et al., 2022). In contrast, we focus on the moderating effect of TS on green technological diversification, arguing that TS creates economies of scale and reduces R&D costs. It also leverages competitive advantages to efficiently allocate R&D resources to diversified green technological fields. Specifically, we contend that TS has a positive moderating effect and enhances the external spillover effects of green technological diversification. Unlike the majority of previous studies that have used entropy weight as a measure of TS (Ejdemo & Ortqvist, 2020), we use RTA as our measure of specialisation. Our empirical results effectively complement existing research.
Conclusions and policy implicationsThis study contributes to the body of research on green technological diversification and industrial carbon emissions, using provincial data from China spanning 2010 to 2023 as the sample and employing the StoNED model to measure CEE. The findings indicate that the CEE for the entire nation initially declines before rising, CEE is higher in the east coast and north coast regions, while it is lower in the northwest region. Subsequently, we calculate RD and UD using patent text data. We then use these measures to explore their impacts on CEE using a panel quantile model. The results demonstrate that both RD and UD significantly influence CEE. RD has a larger impact than UD. Robustness and endogeneity tests validate the benchmark regression results. Furthermore, the heterogeneity analysis reveals that the influence of RD and UD on CEE is comparatively stronger in non-coastal regions, low-income provinces and provinces with low market access. Furthermore, TS has a more pronounced moderating effect on CEE in RD than in UD.
The conclusions have several policy implications. First, policymakers should continue promoting green technological diversification. Green technology is inherently more complex than non-green technologies, diversification activities in green technology are beneficial to green innovation and firms operating in the green sector can reduce the cost of innovation in green technologies. This is achieved by leveraging the structural characteristics of the technology, knowledge spillovers and economies of scale associated with green technological diversity (Barbieri & Consoli, 2019). Meanwhile, government officials should also pursue unrelated green technological diversification to prevent technology lock-in and overtake curves. Additionally, governments should establish innovation funds and offer tax incentives for green R&D activities to promote green technology diversification. Second, heterogeneous regional development characteristics result in different green technology innovation strategies. Coastal regions, high-income regions and resource-based regions should select key technological fields to push green technological diversification and vigorously develop high-tech green industries to achieve a comparative advantage in green technology innovation. For example, Shenzhen successfully shifted from traditional manufacturing to high-tech green industries (Cheshmehzangi and Tang, 2024). This transition can serve as a model for other coastal regions. Its strategy included investing in green tech startups and creating innovation parks focused on clean energy. In economic and resource-poor areas, firms must actively reform the traditional industrial models and introduce emerging green technology industries, leveraging the successful experiences of low-carbon pilot areas to explore low-carbon development models suitable for their region and narrow the gap with economically developed coastal regions. Finally, developing long-term core technological competence is essential for achieving green technological innovation. Therefore, policymakers should strengthen R&D for new green technologies and establish a close connection between firms’ advantageous and core technologies. In other words, regions should actively guide the clustering of relevant advantageous technologies and promote TS. In addition, firms must persistently accumulate knowledge and technology in a particular field and apply this knowledge and technology to products in different market segments (Kang et al., 2021). This approach will fully leverage the externality effects of specialised and diversified technologies, promoting diversified green technology innovation through the flow of technological elements and complementary collaboration between enterprises.
Several areas require further investigation. While this study provides empirical evidence on the relationship between green technological diversification and CEE at the provincial level in China, it does not consider intra-provincial heterogeneity and localised institutional dynamics. Future research should extend to city-level analyses with particular focus on innovation pilot cities to reveal finer spatial patterns, policy implementation and urban–rural differences in green technology adoption. Furthermore, intellectual property protection is crucial for firms’ technological innovation (Dussaux et al., 2022); therefore, future research should assess how intellectual property protection mediates the effects of city-level diversification. These refinements would yield actionable insights for sub-provincial policymaking and corporate R&D strategies. Finally, our methodology is based on panel quantile regression but while the results demonstrate robustness, they may not fully address all potential endogeneity issues. Future research could explore alternative econometric techniques to address these concerns more effectively. Additionally, the StoNED model provides a robust framework for measuring CEE by incorporating undesirable outputs and accounting for statistical noise. However, it may not fully capture the complex regional dynamics that influence green technological diversification and CEE.
Data availabilityThe labelled datasets supporting the findings of this study are available from the corresponding author upon request.
CRediT authorship contribution statementShouhui He: Writing – original draft, Software, Resources, Project administration, Methodology, Investigation, Formal analysis, Data curation, Conceptualization. Si Xu: Writing – original draft, Software, Resources, Project administration, Methodology, Investigation, Formal analysis, Data curation, Conceptualization. Aria Xianya Zou: Writing – review & editing, Writing – original draft, Visualization, Validation, Supervision, Software, Project administration, Methodology, Investigation, Funding acquisition, Formal analysis, Data curation, Conceptualization.
The authors declare that there no conflicts of interest.
This work was supported by Social Science Planning Research Foundation of Shandong Province in China (Grant No.: 23CGLJ06).