


This paper responds to recent calls to study the role that board gender diversity plays in shaping corporate responses to climate change. It examines whether female board representation is associated with greater climate change innovation and whether its effect is determined by the presence of a greater number of independent female directors or the existence of a critical mass of female directors. The results obtained for a panel data of 3,928 companies over the period 2010–2020 (35,199 observations) confirm that companies with a greater female board representation (both in number and in percentage) are more proactive in terms of investments in climate change innovation. This positive effect does not require a critical mass of female directors and diminishes when the percentage of female directors is higher than 46.78%, a proportion associated with the presence of five or more female directors. Furthermore, female directors influence climate change innovation mainly through their involvement in management as executive directors, rather than through the monitoring and advisory roles that characterize independent directors. The theoretical and practical implications derived from this research are robust to different considerations and methodological approaches.
The need to fight against climate change and its devastating effects on the planet represents one of the greatest challenges for humanity (IPCC, 2007). As a major emitter of greenhouse gases and waste generation, companies are urged by the various economic, political and social players to take measures to reduce their carbon footprint (Ben-Amar et al., 2017; Caby et al., 2022; Gull et al., 2022). One way to respond to these growing demands is to implement innovative solutions aimed at reducing pollutant emissions and waste generation, as well as resource consumption (García-Sánchez et al., 2020; Haque, 2017). However, such initiatives are costly and can take time to have an effect, so their development requires strong commitment and support from the board (Atif et al., 2021; Gull et al., 2022; He & Jiang, 2019), as the main body responsible for corporate strategies and risk management (Issa & Bensalem, 2022; Nadeem et al., 2020).
The board of directors has a significant influence on a company's sustainability agenda (Haque & Jones, 2020; UNGC, 2012). Certain attributes related to the composition of the board of directors may be conducive to its orientation towards sustainable development and eco-innovation (de Villiers et al., 2011; Galia, 2015; García-Sánchez et al., 2021; Haque, 2017). Specifically, female representation on the board is considered a key driver of corporate sustainability (Ben-Amar et al., 2017; Boulouta, 2013; Shaukat et al., 2016) in terms of renewable energy consumption (Atif et al., 2021), waste management (Gull et al., 2022), greenhouse gas (GHG) emissions (Konadu et al., 2022) and eco-innovation (Issa & Bensalem, 2022; Nadeem et al., 2020). As directors, women are more mindful of corporate social responsibilities (Issa & Bensalem, 2022) and environmental concerns (Liu, 2018). In addition, they are more open to adopting new ideas and innovative solutions (Konadu et al., 2022). This suggests that female directors are more inclined to support environmental protection initiatives to mitigate climate change (Atif et al., 2021; He & Jiang, 2019) and, therefore, firms with a higher female representation on the board would be more prone to invest in climate change mitigation innovations and technologies.
Previous research on the role of gender diversity on boards in driving companies to reduce the impact of their activities on global warming by investing in climate change mitigation innovations and technologies is scarce (He & Jiang, 2019; Le Loarne-Lemaire et al., 2021; Nadeem et al., 2020) and tends to focus on corporate social responsibility (CSR) practices generally (Ben-Amar et al., 2017) or on specific dimensions of corporate environmental sustainability, such as energy consumption, waste management and carbon performance (Atif et al., 2021; Gull et al., 2022; Konadu et al., 2022). However, climate change is a “multi-dimensional concept” and, therefore, business efforts to tackle it must be viewed from a wide perspective. Such perspective should consider business investment in innovations, technologies and other climate change initiatives that are developed at all stages of business activity, with a focus on the organization as a whole. Furthermore, researchers have tended to assume that female directors have “a homogeneous effect” instead of analysing “when” female representation on the board has significant influence on firm decisions (Moreno-Ureba et al., 2022). As a result, prior studies document contradictory results regarding the effect of female directors on eco-innovation (Issa & Bensalem, 2022; Naveed et al., 2022; Zaman et al., 2022).
This paper aims to fill these gaps in the literature and respond to recent calls to delve into the role that board gender diversity plays in shaping corporate responses to climate change (Griffin et al., 2021; Shui et al., 2022; Le Loarne-Lemaire et al., 2021; Baker et al., 2020; Liao et al., 2015). Specifically, we investigate the effect that female representation on the board has on the adoption of different innovations aimed at fighting climate change by attempting to answer two main research questions: (1) is board gender diversity associated with greater climate change innovation? and (2) is the effect of board gender diversity on climate change innovation determined by the presence of a greater number of independent female directors or by the existence of a critical mass of female directors?
To answer these questions, we analyse a panel data of 3928 companies over the period 2010–2020 (35,199 observations) and consider a broad set of investments in different innovations and technologies of different nature, such as management systems, green design, eco-efficiency, pollution control or low-carbon energy (Wang et al., 2018), which help companies to reduce emissions and mitigate the consequences of climate change at all stages of business activity. The results confirm that companies with a greater presence of women on their boards of directors are more proactive in terms of investments in innovation for climate change mitigation. However, this positive relationship diminishes when boards begin to balance in favour of the female gender, with an inverse relationship between board gender diversity and climate change mitigation innovation being observed when the percentage of board seats held by women is higher than 46.78%, a proportion associated with the presence of five or more female board members. Furthermore, the channel through which female directors influence climate change innovation is mainly their involvement in management as executive directors, rather than through the monitoring and advisory roles that characterize independent directors. The theoretical and practical implications derived from this research are robust to different considerations and methodological approaches.
This study extends existing research on the relationship between board gender diversity and corporate environmental proactivity by analysing the impact of female directors on climate change mitigation innovations and technologies, thereby providing a new perspective that has not been previously investigated. Thus, our findings contribute to understanding the dynamics of board gender diversity and its effect on corporate responses to climate change by providing a broad picture of whether, how and under what conditions female board representation influences climate change innovation. Furthermore, this study considers the existence of a non-linear relationship between board gender diversity and corporate sustainability, an aspect little analysed in the literature, thus contributing to fill a research gap and providing valuable evidence that could explain mixed prior results.
The rest of the paper is organized as follows: Section 2 presents the theoretical framework; Section 3 develops the research hypotheses; Section 4 outlines the research methodology; and Section 5 presents the main findings, which are supplemented in Section 6 with a complementary analysis. Section 7 discusses the study's findings and explores their theoretical and practical implications. Finally, Section 8 draws the main conclusions of the research and presents its limitations and some avenues for future research.
Theoretical frameworkSeveral theories, such as agency theory, resource dependence theory, upper echelons theory, stakeholder theory, legitimacy theory, gender socialization theory, gender role theory, and critical mass theory, have been employed to analyse the relationship between board gender diversity and firms’ environmental proactivity. Since each single theory has limited ability to explain the effect of the presence of women on the board of directors on corporate environmental proactivity (Haque & Jones, 2020; Issa & Bensalem, 2022; Konadu et al., 2022; Moreno-Ureba et al., 2022), most authors employ a multi-theoretical framework that combines different theoretical lenses to rationalize this association. In line with this overall approach, we rely on resource dependence theory, gender socialization theory, upper echelons theory, agency theory and critical mass theory to explain the effect of female representation on the board on the adoption of climate change mitigation innovations.
Resource dependence theory (Pfefer & Salancik, 1978) is related to the board's advisory and resource provisioning role, while agency theory is associated with the monitoring role of the board of directors (Ben-Amar et al., 2017; de Villiers et al., 2011; Haque, 2017; Haque & Jones, 2020). From the first perspective, the board of directors provides firms unique resources and capabilities, such as strategic advice, reputation, knowledge, financial resources and networks, which affect the firm's ability and propensity to eco-innovate (Haque, 2017). Specifically, female directors bring different human and relational capital to the board (Caby et al., 2022; Haque & Jones, 2020), expanding its know-how, creativity, competence, expertise, open-mindedness and connections (Konadu et al., 2022).
On the other hand, agency theory explains the oversight role that the board of directors plays in constraining management's opportunistic behaviour (Fama & Jensen, 1983) and resolving agency problems arising from the uncertain and long-term nature of investments in climate change mitigation innovations (Griffin et al., 2019; Haque, 2017). From this point of view, the effectiveness of the board of directors in performing its monitoring role is largely influenced by certain attributes, such as the independence of its members (de Villiers et al., 2011; Moreno-Ureba et al., 2022). As for female directors, previous studies have shown that they improve board governance (Seebeck & Vetter, 2022) through effective oversight (Atif et al., 2021; Gull et al., 2022; Kassinis et al., 2016; Konadu et al., 2022) and greater independence (Adams & Ferreira, 2009; Carter et al., 2003).
Upper echelons theory (Hambrick & Mason, 1984) assumes that directors’ demographic characteristics and experiences shape their values and behaviours, which in turn influence their decisions and management styles (Hambrick, 2007). From this perspective, gender brings unique attributes to directors (Khandelwal et al., 2020), affecting their attitude, priorities and motivations, which in turn reflect on corporate strategies and decision-making. In this sense, female directors’ distinctive backgrounds increase the board's cognitive diversity, making it more likely to accept and promote environmental innovations (Galia et al., 2015; Konadu et al., 2022).
According to gender socialization theory, women and men have different attitudes and perspectives regarding environmental issues as a result of their education (Eagly & Johannesen-Schmidt, 2001; Konadu et al., 2022; Liu, 2018). Women have been educated to care about others (Moreno-Ureba et al., 2022), which makes them more sensitive to environmental and social challenges (Ben-Amar et al., 2017; Caby et al., 2022; Issa & Bensalem, 2022). From this perspective, female directors will behave in line with these internalized attributes (Atif et al., 2021; Gull et al., 2022; Nadeem et al., 2020) and, therefore, their presence on the board will favour a greater stakeholder and long-term orientation (Issa & Bensalem, 2021), thereby promoting climate change mitigation initiatives.
Hypothesis developmentBoard gender diversity and climate change mitigation innovationPrior research has documented an overall positive effect of board gender diversity on firm innovation (Chen et al., 2018; Galia & Zenou, 2012; Le Loarne-Lemaire et al., 2021; Midavaine et al., 2016; Torchia et al., 2011). These findings are attributed to the fact that female directors bring new perspectives, skills and expertise to the board, which fosters creativity and innovative thinking (Galia et al., 2015; Issa & Bensalem, 2022; Nadeem et al., 2020; Naveed et al., 2022). Likewise, prior studies reveal a general positive relationship between board gender diversity and CSR, in general, and environmental proactivity, in particular (Lu & Herremans, 2019; McGuiness et al., 2017; Nielsen & Huse, 2010; Pan et al., 2020). This positive effect is explained because, compared to male directors, female directors are more sensitive to environmental concerns and more environmentally proactive (Haque & Jones, 2020; He & Jiang, 2019; Liao et al., 2015; Nadeem et al., 2020; Pan et al., 2020; Post & Byron, 2015) and tend to show a better awareness of environmental initiatives (Arayssi et al., 2016).
Several authors provide empirical evidence of an overall positive association between board gender diversity and eco-innovation and climate change mitigation initiatives. Regarding eco-innovation, studies such as Galia et al. (2015), Glass et al. (2016), Horbach and Jacob (2018), He and Jiang (2019), Liao et al. (2019), Moreno-Ureba et al. (2022), Nadeem et al. (2020) and Naveed et al. (2022) document a positive impact of the presence of female directors on the board on eco-innovation. A similar relationship has been observed with respect to climate change mitigation initiatives. For example, Atif et al. (2021) showed a positive effect of gender diversity on boards on renewable energy consumption and Gull et al. (2022) documented a positive effect on waste management. Haque (2017) found a positive impact of the presence of female directors on the board on the firm's efforts to reduce emissions and increase eco-efficiency, and García Martín and Herrero (2020) and Konadu et al. (2022) found a negative relationship between board gender diversity and carbon emissions. Other authors (e.g. Ararat & Sayedy, 2019; Ben-Amar et al., 2017; Liao et al., 2015; Tingbani et al., 2020) document a positive relationship between board gender diversity and voluntary disclosure of climate change information. Few studies show negative or no impact of board gender diversity on eco-innovation (e.g. García-Sánchez et al., 2021) and carbon performance (Caby et al., 2022) and disclosures (e.g. Prado-Lorenzo & García-Sánchez, 2010).
Taken together, this empirical evidence suggests that gender-diverse boards are more likely to promote the adoption of climate change mitigation innovations. From the resource dependence theory's perspective, this relationship is supported by the fact that female directors’ human and relational capital favour the inclusion of climate change issues into corporate strategies (He & Jiang, 2019; Hollindale et al., 2019; Nadeem et al., 2020), thereby positively affecting innovation in climate change mitigation. Likewise, from the agency theory's standpoint, the increased board oversight due to the presence of female directors contributes to solving agency problems associated with the uncertain and long-term nature of investments in climate change mitigation innovations, by curbing opportunistic management behaviours that would inhibit this type of investment (Haque, 2017).
Upper echelons theory and gender socialization theory also support the existence of a positive effect of board gender diversity on climate change mitigation innovations. According to the former, the presence of female directors on the board broadens the cognitive composition of the board of directors, which favours a better understanding of societal demands and challenges, such as climate change (Galia et al., 2015; Horbach & Jacob, 2018; Konadu et al., 2022), making the board more likely to support investments in climate change mitigation innovations and technologies. From the perspective of gender socialization theory, female directors will behave in line with the attributes instilled in them. Thus, compared to their male counterparts, female directors are more sensitive to environmental concerns (Nadeem et al., 2020) and have higher ethical standards (Moreno-Ureba et al., 2022); consequently, they will promote proactive environmental strategies and investments (Atif et al., 2021; Gull et al., 2022; Issa & Bensalem, 2021; Nadeem et al., 2020).
Based on this discussion, we assume that gender-diverse boards are more likely to promote the adoption of climate change mitigation innovations. Hence, we pose the following hypothesis:
H1: Board gender diversity is associated with greater climate change innovation.
Female independent directors and climate change mitigation innovationAccording to the agency theory's tenets, independent directors perform more effective oversight of management with regard to environmental issues (de Villiers et al., 2011; Haque, 2017) and, therefore, greater board independence would constrain potential opportunistic behaviour by management to delay investments in climate change mitigation innovations and technologies (He & Jiang, 2019). Furthermore, from the perspective of the resource dependence theory, independent directors provide expertise advice and a critical view (Haque, 2017) and a higher stakeholder orientation (Moreno-Ureba et al., 2022), which would favour this type of investment. The greater the number of independent directors on the board, the greater the likelihood that the board will promote climate change innovations.
Consequently, it would be expected that the positive effect of female directors on climate change mitigation innovation would be greater when they are also independent directors. Prior empirical evidence supports this conjecture. Gull et al. (2022) found that the presence of female directors on the board has a positive impact on waste management only when they are independent, concluding that it is this attribute which drives the effect of board gender diversity on waste management. Atif et al. (2020) obtained the same result with regard to sustainable investments, while Atif et al. (2021) found that the impact of female directors on renewable energy consumption was higher when they were also independent. Lastly, Liao et al. (2019) document a positive effect of female independent directors on environmental innovations.
Based on this discussion, we assume that the independence of female directors is what drives the effect of board gender diversity on climate change innovation. Hence, the following hypothesis is stated:
H2: The effect of board gender diversity on climate change innovation is driven by the presence of female independent directors.
Critical mass of female directors and climate change mitigation innovationAlthough, according to theoretical arguments and empirical evidence, board gender diversity is assumed to have a positive impact on eco-innovation and climate change mitigation initiatives, the literature argues that a certain number of female directors on the board are required to have a significant impact on business decisions and strategies (Amorelli & García-Sánchez, 2020; Atif et al., 2021; Ben-Amar et al., 2017; Gull et al., 2022; He & Jiang, 2019; Joecks et al., 2013; Konrad et al., 2008; Kramer et al., 2006; Moreno-Ureba et al., 2022). This view is based on critical mass theory (Kanter, 1977), which postulates that the weight of the minority group influences interpersonal interactions and group dynamics, so that it is necessary for the minority group to reach a critical mass to significantly affect group decision-making. Under that threshold, minority group members are seen as “tokens” representing a particular group and tend to adjust their behaviour to the majority group's criteria but, once the minority group reaches a critical mass, they feel more confident and become influential, thereby improving group dynamics and interactions (Atif et al., 2020; Nuber & Velte, 2021; Terjesen et al., 2009).
From this perspective, female directors would constitute the minority group on the board (Seeker & Vetter, 2022), with a critical mass being necessary to have “presence and voice” and, thus, affect board decisions (Kanter, 1977). Results from previous studies support this argument. Torchia et al. (2011) found that three or more female directors are needed to significantly affect firm innovation, and Moreno-Ureba et al. (2022) obtained the same result in the case of environmental innovation, while He and Jiang (2019) set the threshold at two female directors to exert a significant influence on board decisions regarding green innovation. Atif et al. (2020) and Atif et al. (2021) found that female board representation should reach at least two female directors to have a significant influence on sustainable investments and renewable energy consumption, respectively. Gull et al. (2022) showed that gender diversity significantly affects waste management only when there are at least two female directors on the board, and Ben-Amar et al. (2017) and Hollindale et al. (2019) obtained the same result with regard climate change disclosure.
In light of this discussion, the following hypothesis is formulated:
H3: The effect of board gender diversity on climate change innovation is driven by the existence of a critical mass of female directors.
Empirical designSampleAlthough the fight against climate change requires the commitment of the entire business fabric, larger companies should be more involved, mainly because they have greater resources and, as a result of their volume of activity, have a greater environmental impact. In this regard, based on the literature review, the companies included in Compustat and Thomson Reuters EIKON databases were selected.
Three search criteria were used to identify the companies to be analysed: firstly, that both databases contained the financial and non-financial (environmental social and governance, ESG) information needed to construct the variables that would allow estimation of the empirical models designed to test the research hypotheses. Secondly, the information should be available from 2010 to 2020, a period in which there is a clear concern about climate change, and greater homogeneity with respect to the commitments and objectives to be achieved in this regard. Thirdly, that the companies had all the information available for at least five of the eleven years analysed to ensure the robustness of the results through different methodological estimates.
The final sample is made up of 3928 companies, forming an unbalanced panel of 35,199 observations. In addition, information on the institutional environment was incorporated from macroeconomic indicators from different agencies.
Empirical models and methodologyTo test the research hypotheses, three empirical models have been designed. In Model 1, the verification of hypothesis H1 will require that β1>0 and significant from the econometric point of view. The testing of hypothesis H2, concerning the impact of female directors’ independence, will be performed by estimating Model 2 and will require that ∝1 > 0 and significant. The checking of hypothesis H3 will be performed by estimating Model 3, expecting that 0<δ1<δ2<δ3 and that all coefficients are significant.
Inno_ClimaChi,t=β0+β1BoardDiversity/WomenDirectorsi,t+∑n=212βiFi,t+∑n=1319βiBi,t+∑n=2023βiIi,t+β24Countryi+β25Indi+β26Yeart+εit+ηi[Model 1]
Inno_ClimaChi,t=∝0+∝1Independent_WDi,t+∝2Insider_WDi,t+∑n=313∝iFi,t+∑n=1420∝iBi,t+∑n=2124∝iIi,t+∝25Countryi+∝26Indi+∝27Yeart+εit+ηi[Model 2]
Inno_ClimaChi,t=δ0+δ1Skewedi,t+δ2Tiltedi,t+δ3Balancedi,t+∑n=414δiFi,t+∑n=1521δiBi,t+∑n=2225δiIi,t+δ26Countryi+δ27Indi+δ28Yeart+εit+ηi[Model 3]
Given the ordinal nature of the dependant variable, the models will be estimated with STATA 17.0 software, using ordinal regressions for panel data, random effects. In order to obtain robust results, static (t-estimates) and dynamic models will be used applying one to three lags (t-1, t-2 and t-3) as instruments for the explanatory variables.
VariablesThe dependant variable (Inno_ClimaCh) comprises a broad set of investments in different innovations and technologies related to climate change, such as management system technologies, green design technologies, eco-efficiency technologies, pollution control technologies or low-carbon energy technologies (Wang et al., 2018), which help to reduce emissions and mitigate the consequences of climate change, generating greater climate knowledge (PwC, 2021).
Thus, the ClimateTech variable has been configured as a score formed by the sum of seven items that identify business investment in innovations, technologies and other initiatives against climate change. These projects are of different natures and are developed in all stages of business activity, with a focus on the organization as a whole. The score is generated by adding the following dichotomous variables that identify that the company has made innovations in (i) green building, including pollution-control equipment, and (ii) resource uses with the aim of reducing the consumption of resources and energy and improving resource energy efficiency; has invested in (iii) clean technology in production planning and management processes; and (iv) waste technology with the aim of employing recycling techniques and using recycled materials. In addition, the company has developed (v) environmentally responsible products and promoted initiatives that encourage (vi) sustainable land use (land environment), and (vii) sustainable mobility of its personnel in all work-related travels.
The independent variables designed to test the research hypotheses are BoardDiversity and WomenDirectors for hypothesis H1; Independent_WD and Insider_WD for hypothesis H2; and Skewed, Tilted, and Balanced for hypothesis H3. Following Atif et al. (2020, 2021) and Gull et al. (2022), we define gender diversity by BoardDiversity and WomenDirectors, both variables represent the presence of female directors on the board expressed as a percentage of total number of directors and the number of female directors on the board, respectively. Independent_WD and Insider_WD correspond to the proportion of female independent and executive directors with respect to board size, respectively (Atif et al., 2021; Liao et al., 2019). Finally, with respect to hypothesis H3 based on critical mass theory, following Seebeck and Vetter (2022), we consider the three types of boards defined by Kanter (1977): skewed (male-dominated boards), tilted (boards with a greater female presence, but without reaching a balanced distribution of seats), and balanced (gender-balanced boards). To identify these situations, three dummies have been created: Skewed, Tilted, and Balanced, which take, respectively, the value 1 when the percentage of women on the board is less than or equal to 20%; is between 20% and 40%; or is greater than 40% and less than or equal to 60%, and 0 otherwise.
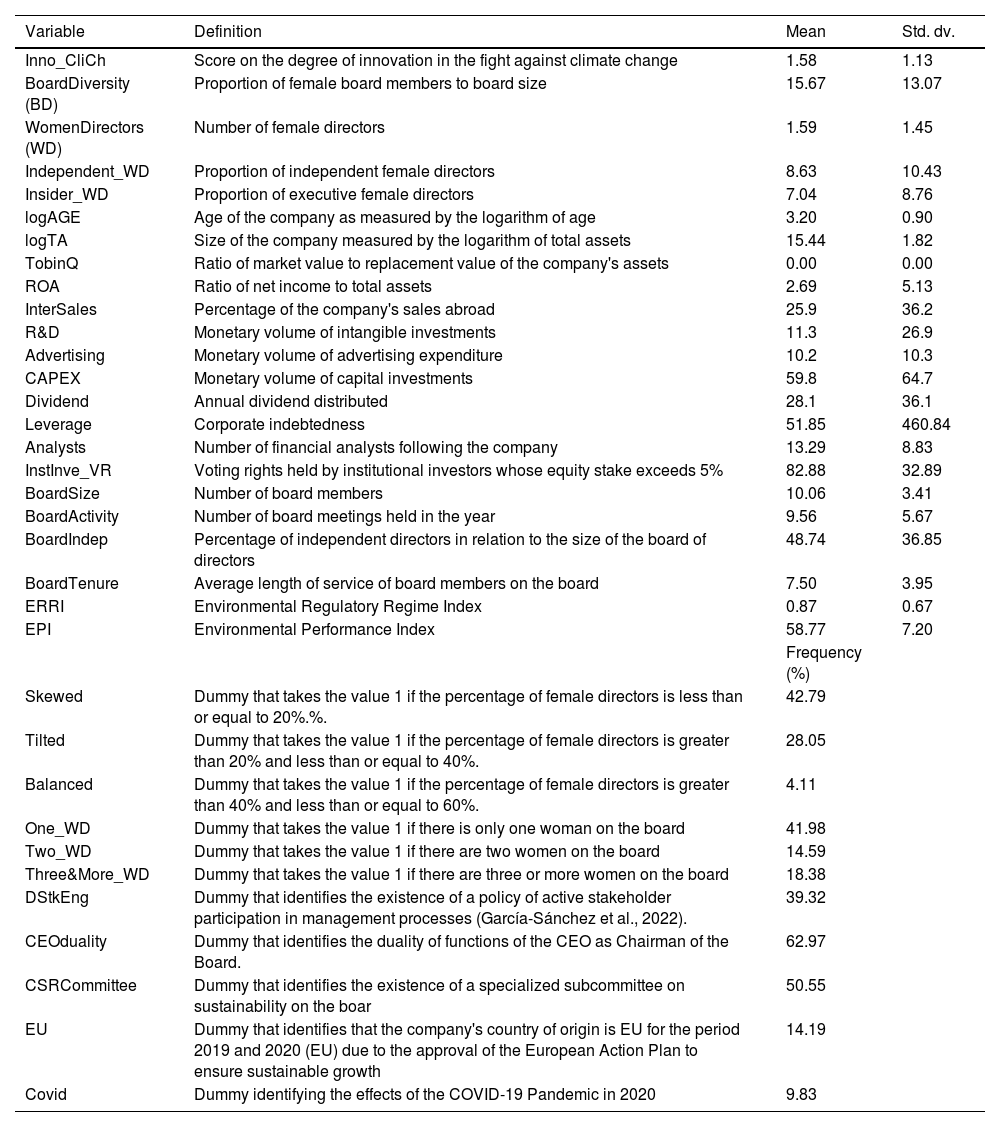
To mitigate bias in the estimation of the models, three vectors of variables, F, B, and I, have been included with the aim of controlling for the effect that different variables have shown to have in previous studies (e.g. Aibar-Guzmán et al., 2022; García-Sánchez et al., 2020). Specifically, vector F identifies 11 business characteristics associated with the existence of resources, capabilities and incentives or the involvement of certain financial agents, such as financial analysts and institutional investors. Vector B identifies seven dimensions of board effectiveness as an internal corporate governance mechanism (de Villiers et al., 2011; Galia, 2015; García-Sánchez et al., 2021; Haque, 2017). Lastly, vector I entails the inclusion of four macroeconomic indicators that identify the institutional context and the pressures that may exist on environmental issues at the country level, as well as the effect of the COVID-19 pandemic in the year 2020. Table 1 reflects the definition and measurement of the twenty-two control variables included in the models. Additionally, we control for time period, industry and country using the variables Year, Industry, and Country.
Variables: definition and statistics.
| Variable | Definition | Mean | Std. dv. |
|---|---|---|---|
| Inno_CliCh | Score on the degree of innovation in the fight against climate change | 1.58 | 1.13 |
| BoardDiversity (BD) | Proportion of female board members to board size | 15.67 | 13.07 |
| WomenDirectors (WD) | Number of female directors | 1.59 | 1.45 |
| Independent_WD | Proportion of independent female directors | 8.63 | 10.43 |
| Insider_WD | Proportion of executive female directors | 7.04 | 8.76 |
| logAGE | Age of the company as measured by the logarithm of age | 3.20 | 0.90 |
| logTA | Size of the company measured by the logarithm of total assets | 15.44 | 1.82 |
| TobinQ | Ratio of market value to replacement value of the company's assets | 0.00 | 0.00 |
| ROA | Ratio of net income to total assets | 2.69 | 5.13 |
| InterSales | Percentage of the company's sales abroad | 25.9 | 36.2 |
| R&D | Monetary volume of intangible investments | 11.3 | 26.9 |
| Advertising | Monetary volume of advertising expenditure | 10.2 | 10.3 |
| CAPEX | Monetary volume of capital investments | 59.8 | 64.7 |
| Dividend | Annual dividend distributed | 28.1 | 36.1 |
| Leverage | Corporate indebtedness | 51.85 | 460.84 |
| Analysts | Number of financial analysts following the company | 13.29 | 8.83 |
| InstInve_VR | Voting rights held by institutional investors whose equity stake exceeds 5% | 82.88 | 32.89 |
| BoardSize | Number of board members | 10.06 | 3.41 |
| BoardActivity | Number of board meetings held in the year | 9.56 | 5.67 |
| BoardIndep | Percentage of independent directors in relation to the size of the board of directors | 48.74 | 36.85 |
| BoardTenure | Average length of service of board members on the board | 7.50 | 3.95 |
| ERRI | Environmental Regulatory Regime Index | 0.87 | 0.67 |
| EPI | Environmental Performance Index | 58.77 | 7.20 |
| Frequency (%) | |||
| Skewed | Dummy that takes the value 1 if the percentage of female directors is less than or equal to 20%.%. | 42.79 | |
| Tilted | Dummy that takes the value 1 if the percentage of female directors is greater than 20% and less than or equal to 40%. | 28.05 | |
| Balanced | Dummy that takes the value 1 if the percentage of female directors is greater than 40% and less than or equal to 60%. | 4.11 | |
| One_WD | Dummy that takes the value 1 if there is only one woman on the board | 41.98 | |
| Two_WD | Dummy that takes the value 1 if there are two women on the board | 14.59 | |
| Three&More_WD | Dummy that takes the value 1 if there are three or more women on the board | 18.38 | |
| DStkEng | Dummy that identifies the existence of a policy of active stakeholder participation in management processes (García-Sánchez et al., 2022). | 39.32 | |
| CEOduality | Dummy that identifies the duality of functions of the CEO as Chairman of the Board. | 62.97 | |
| CSRCommittee | Dummy that identifies the existence of a specialized subcommittee on sustainability on the boar | 50.55 | |
| EU | Dummy that identifies that the company's country of origin is EU for the period 2019 and 2020 (EU) due to the approval of the European Action Plan to ensure sustainable growth | 14.19 | |
| Covid | Dummy identifying the effects of the COVID-19 Pandemic in 2020 | 9.83 |
Table 1 shows the mean and standard deviation of the variables designed for the estimation of empirical models 1 to 3. The mean climate change innovation score (Inno_CliCh) indicates a low level of business commitment in this regard, standing, on average, at 1.58 (standard deviation of 1.13). This means that companies have promoted or invested in 2 or 3 out of the 7 climate change initiatives that make up the score.
In terms of board gender diversity, female directors represent, on average, approximately 16% of board members (BoardDiversity), occupying around 1.59 seats (WomenDirectors). These values are similar to those obtained by Ben-Amar et al. (2017), Gull et al. (2022), and Naveed et al. (2022), and higher than the values reported by Atif et al. (2020) and Atif et al. (2021), but our mean percentage of gender diversity is lower than that obtained by Issa and Bensalem (2022), Konadu et al. (2022) and Nube and Velte (2021). In general, these findings indicate a low participation of women on boards of directors. However, the standard deviation indicates that this percentage can vary significantly amongst the companies analysed.
In addition, 41.9% of companies have only one female director on the board (One_WD), 14.59% of companies have two female directors and 18.38% have three or more female directors. Quantifying the board gender equity, 42.79% of the companies have a skewed board, with a female presence of less than 20%, while 28.05% of the companies have a tilted board, with a percentage of women board members between 20% and 40%. Only 4.11% of the companies have a balanced board.
Regarding the type of female directors, the presence of independent female directors (Independent_WD) is slightly higher than that of executive female directors (Insider_WD). These findings are consistent with the results obtained by Atif et al. (2021) and Gull et al. (2022), who also found that the percentage of independent female directors exceeds the percentage of executive female directors.
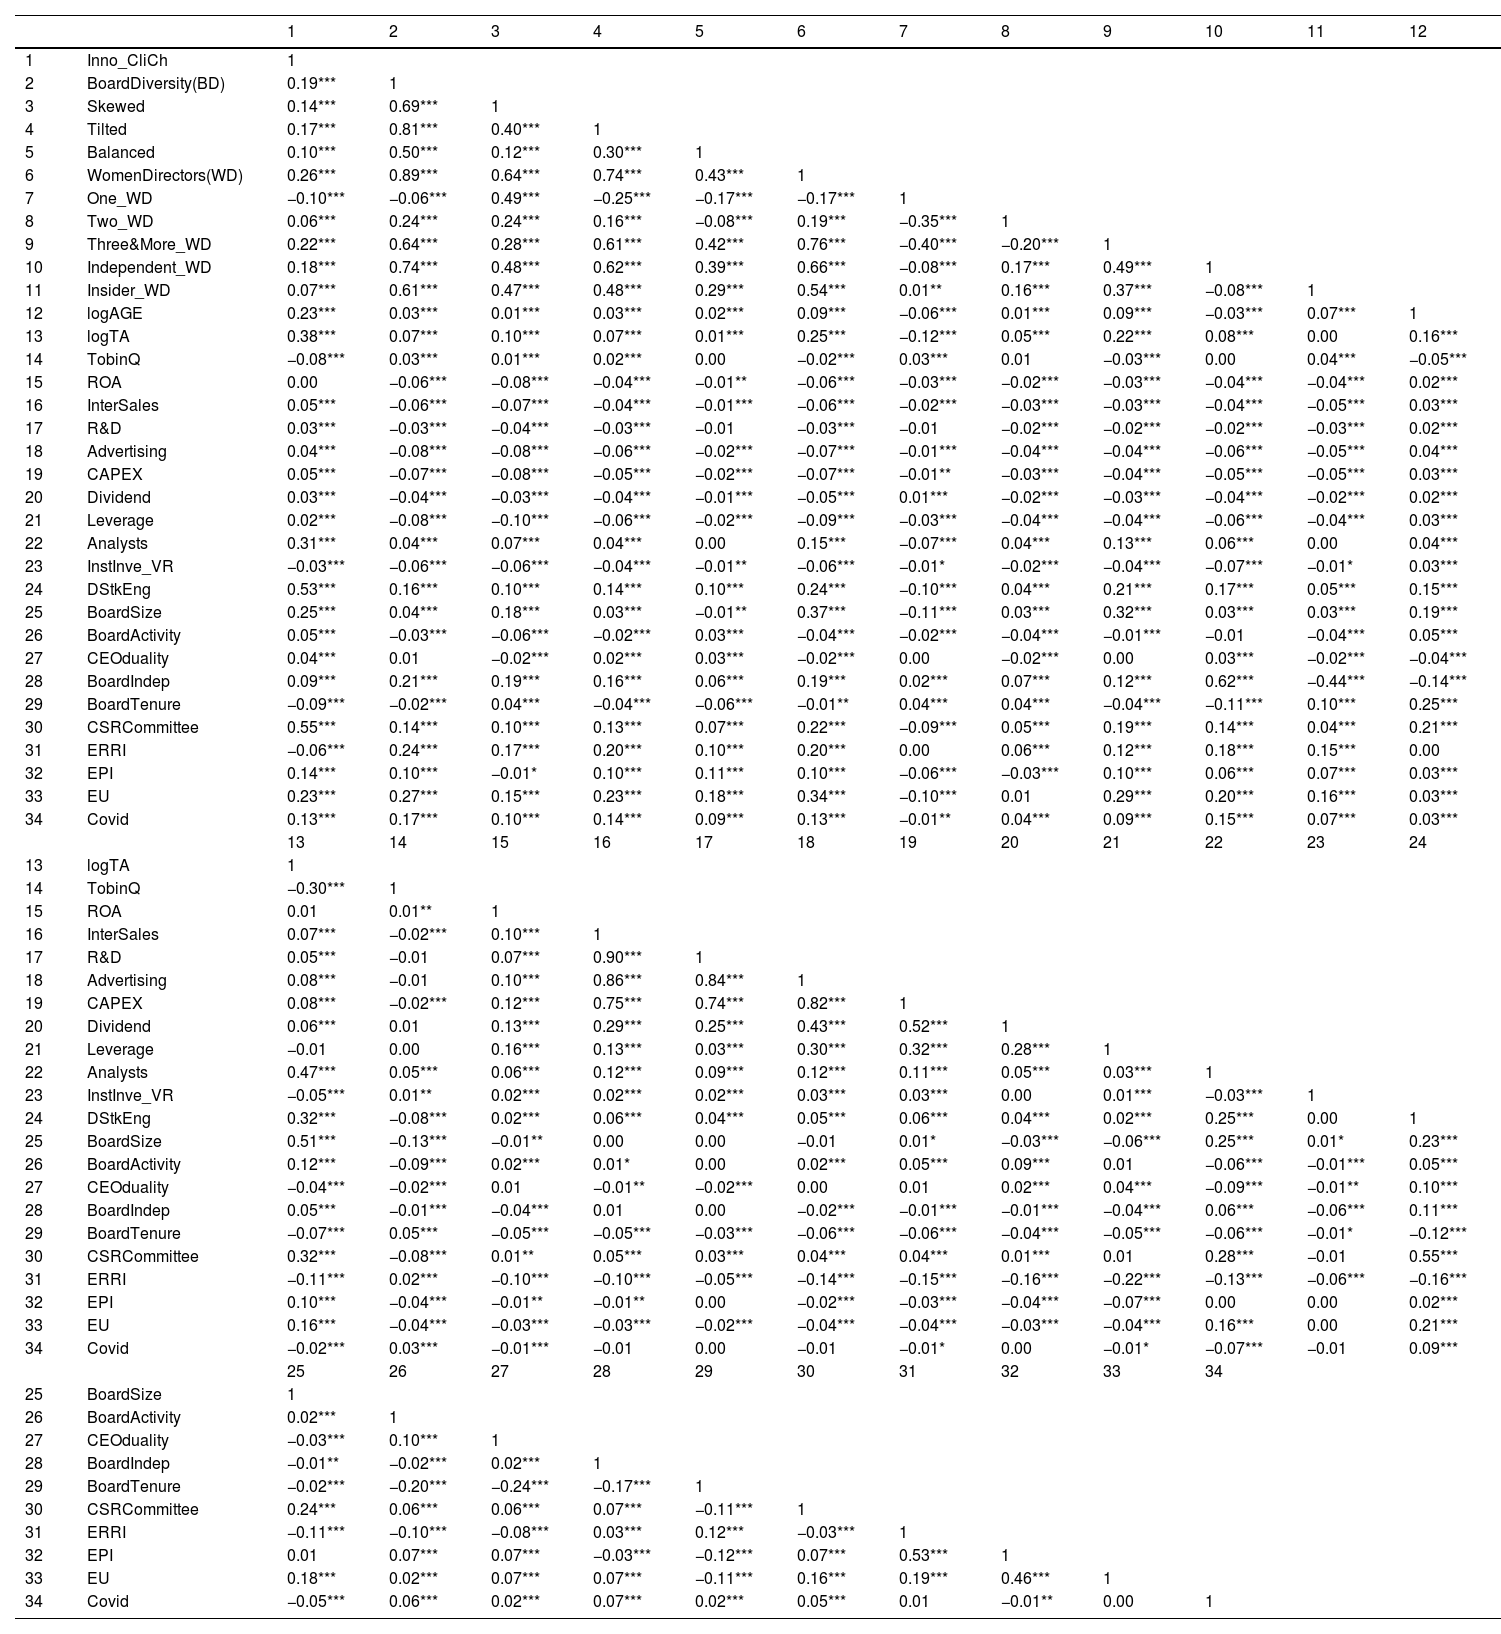
Table 2 shows the correlation matrix. As can be seen, the coefficients that determine the bivariate correlation are significant, although their values are very small, indicating the absence of collinearity problems.
Bivariate correlations matrix (*** p<0.01, ** p<0.05, * p<0.1).
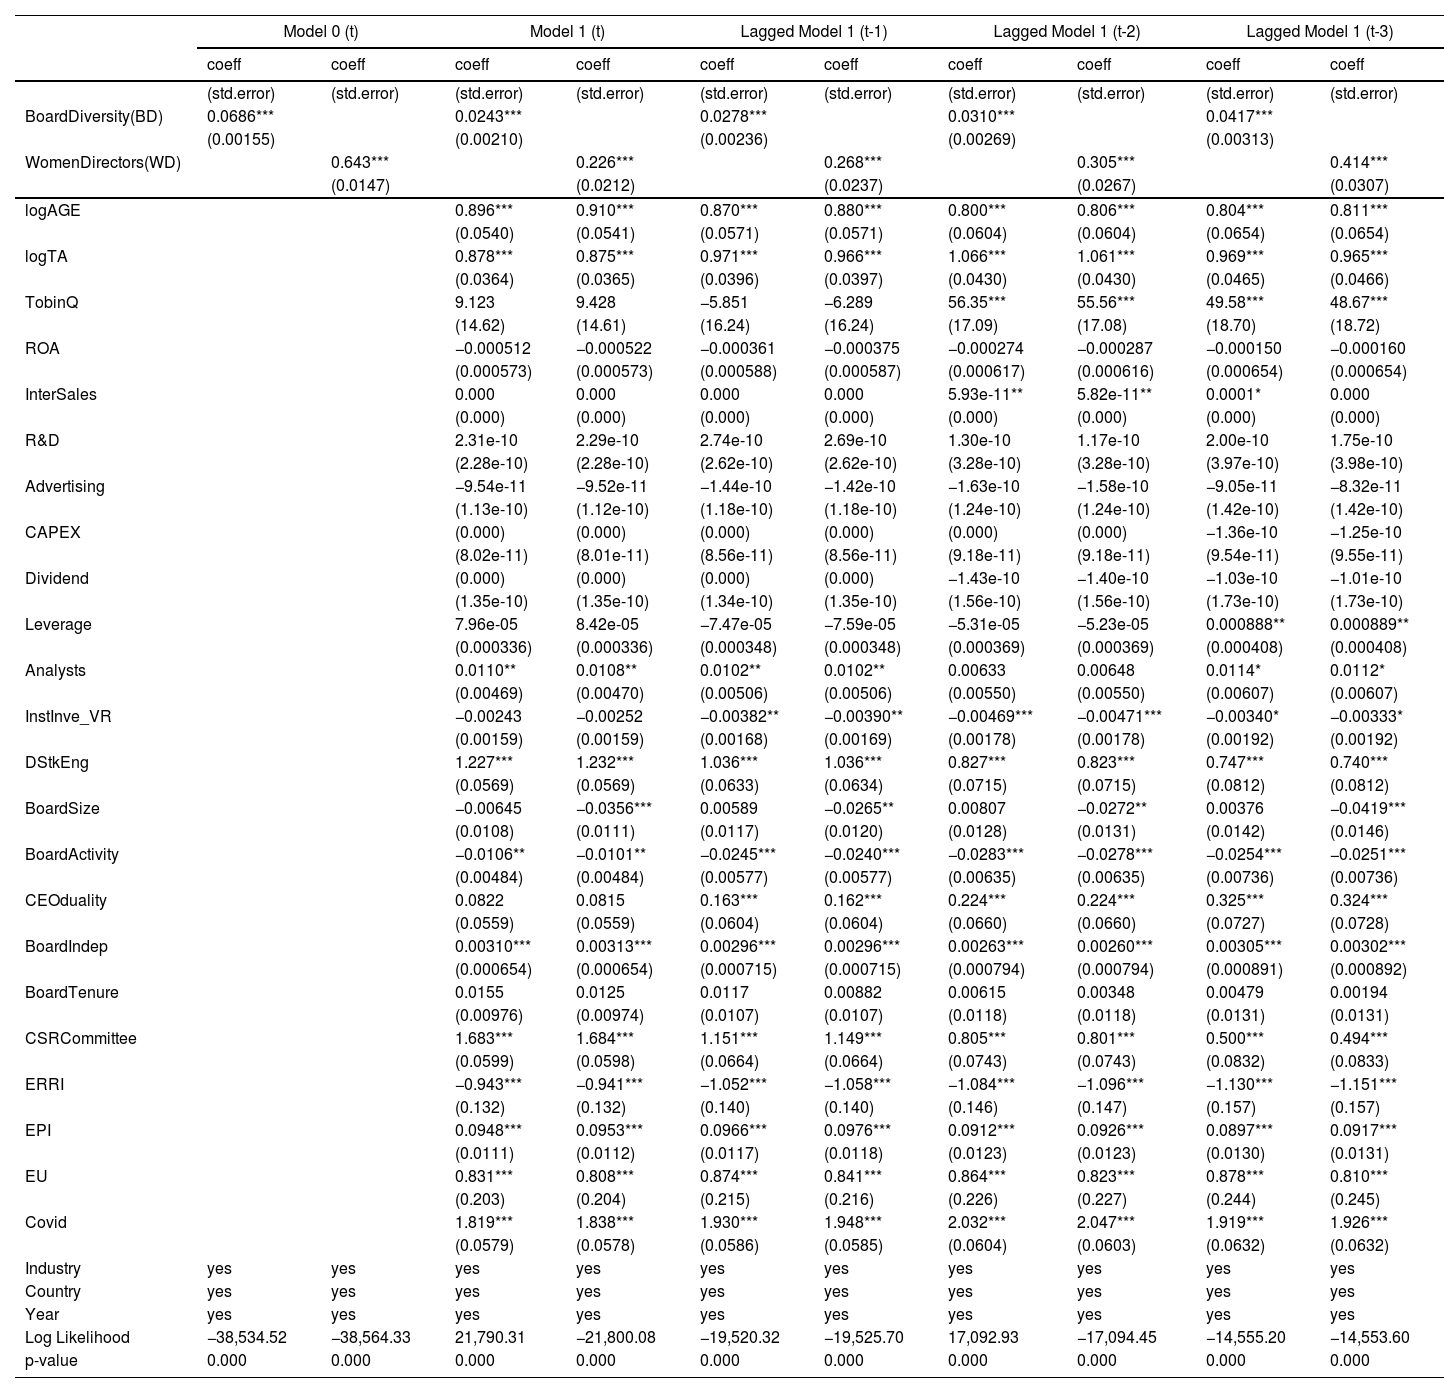
The results obtained in the estimation of the empirical models designed to test the research hypotheses are summarized in Table 3 (Model 1) and Table 4 (Models 2 and 3). For all models, a preliminary equation, Model 0, is presented, which assumes the estimation of each model in t with the only inclusion of the independent variables relating to gender diversity. That is, in each equation's version 0, the control variables are omitted, except those related to sector, country and time period. In addition, to ensure the robustness of the results obtained in the face of methodological specifications, each model is estimated with and without instruments. This implies the inclusion of the explanatory variables in t (static models or without instruments) and the use of lags t-1, t-2 and t-3 (dynamic models, with lags or with instruments).
Board Diversity and Climate Change innovations (*** p<0.01, ** p<0.05, * p<0.1).
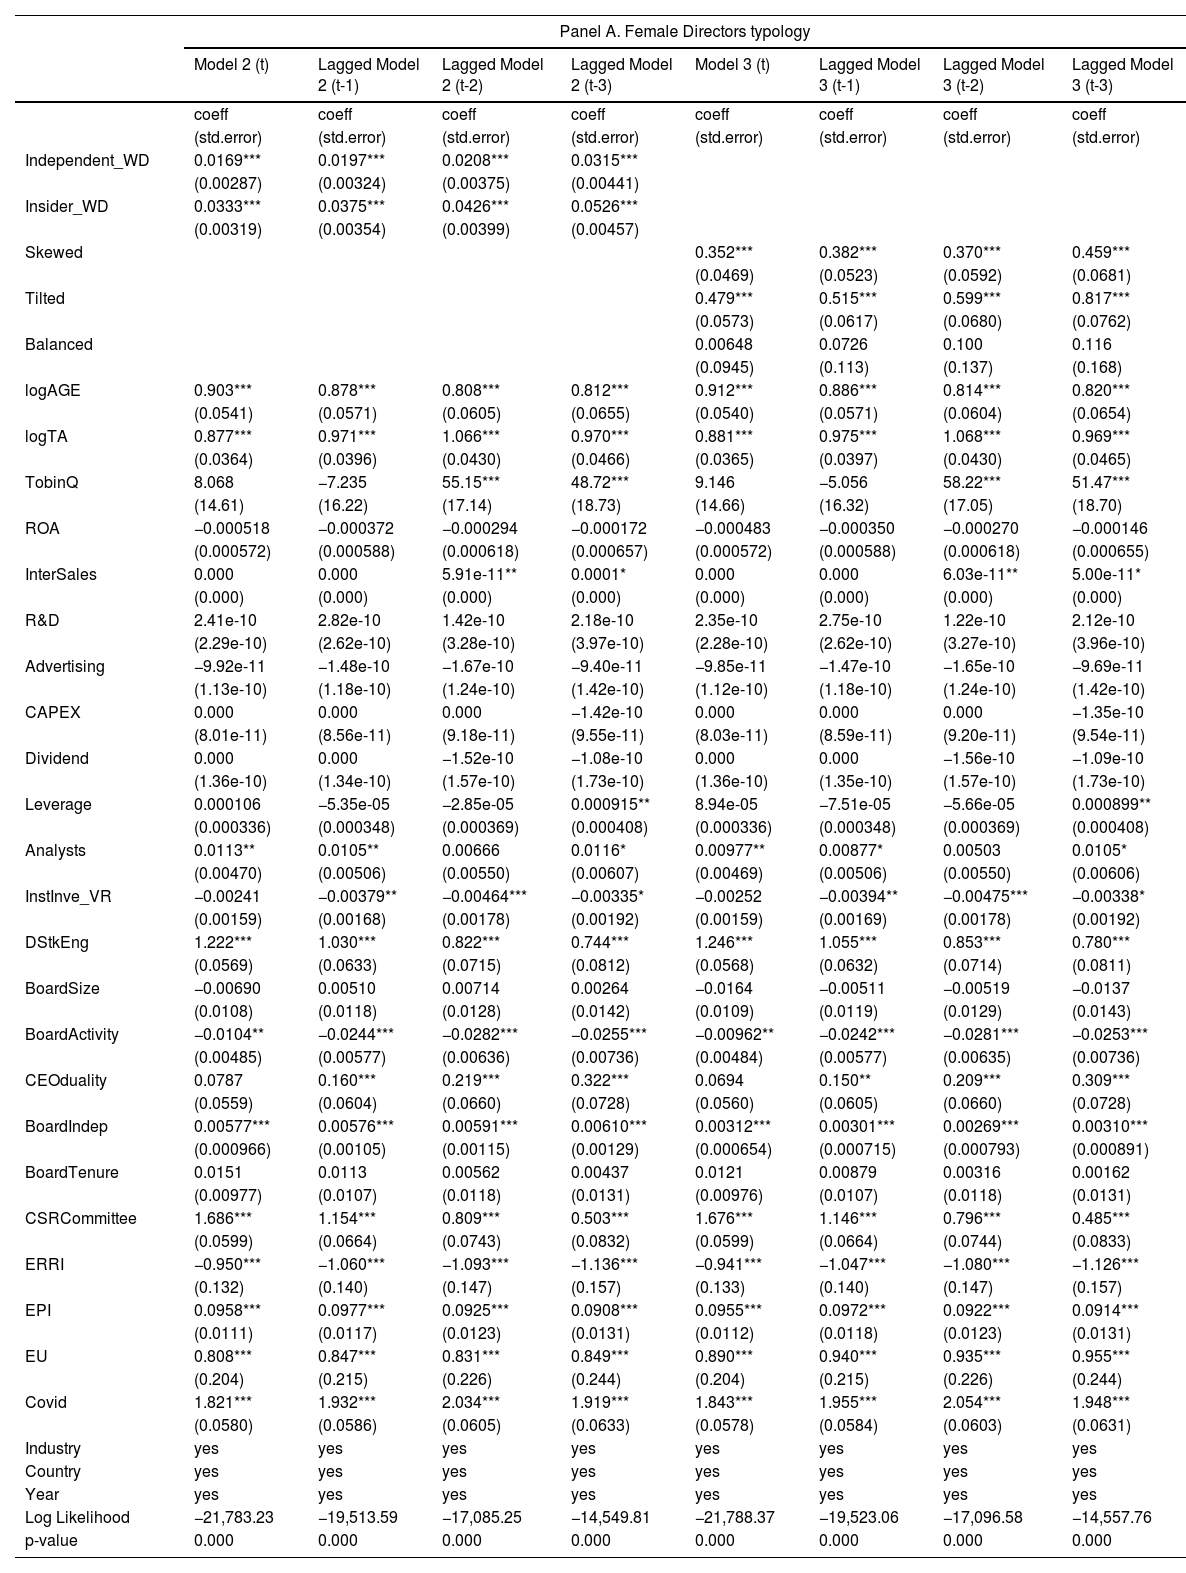
Female director's typology and critical mass (*** p<0.01, ** p<0.05, * p<0.1).
Table 3 shows the results relating to Model 1, designed to test hypothesis H1. In this regard, the testing of hypothesis H1 is performed by using the variables BoardDiversity (BD) and WomenDirectors (WD), representing the proportion and number of female directors, respectively. As can be seen, the BoardDiversity variable has a positive impact on the dependant variable Inno_ClimaCh, significant for a 99% confidence level. Specifically, its isolated effect is β1 = 0.0686, reducing to β1 = 0.0243 when considering other variables representing the resources and capabilities of the companies, the attributes of the board of directors and the existence of institutional pressures. The positive nature of the effect and its significance are maintained in the dynamic models in which lags t-1 (β1 = 0.0278), t-2 (β1 = 0.0310) and t-3 (β1 = 0.0417) are used as instruments.
The effect observed for the WomenDirectors variable is quite similar in sign and significance, although the amount is larger due to the measurement scale. Its effect in Model 0 is β1 = 0.643, and β1 = 0.226 in the full static model (equation 1, including control variables). In the dynamic models, the coefficients reach the following values: β1 = 0.268 in the full model with lag t-1; β1 = 0.305 in the full model with lag t-2; and β1 = 0.414) in the full model with lag t-3.
The alternative use of both variables and the similarity of results between static and dynamic models ensures the robustness of the results regarding the role that board gender diversity exerts on corporate commitment to the fight against climate change, identified through the promotion of and investment in different proactive environmental projects and initiatives. Therefore, hypothesis H1, which stated that board gender diversity is associated with greater climate change innovation, can be accepted.
Panel A in Table 4 shows the results corresponding to Model 2, designed to test hypothesis H2. As can be seen, the impact that the presence of women on the board has on the company's proactivity in innovation against climate change is independent of the type of director considered (independent or executive). Thus, the first column of this panel shows that both independent and executive female directors have a positive and significant impact at a confidence level of 99%. In fact, the magnitude of the impact is greater in the case of the latter type of female directors: the Independent_WD variable has an effect of δ1 = 0.0169, while the effect of the Insider_WD variable is δ1 = 0.0333. The nature of the effect, its significance and amount are maintained in the dynamic models estimated with lags t-1 to t-3. Therefore, the evidence obtained from the estimation of Model 2 leads us to reject hypothesis H2, which posited that the effect of board gender diversity on climate change innovation is driven by the presence of independent female directors.
Regarding the last hypothesis, Panel B in Table 4 summarizes the results corresponding to Model 3. These findings do not suggest the theoretically expected relationship in its entirety. It can be observed that the most proactive companies with respect to investing in climate change innovations are those whose boards of directors have a percentage of women equal to or less than 40%. Thus, regarding the static model, in the first column, the Skewed and Tilted variables have a positive impact on the Inno_ClimaCh score, significant at a 99% confidence level. However, the effect of the Tilted variable, representative of a female presence between 20% and 40% of the board size, is greater than that of the Skewed variable, indicative of women occupying at most 20% of the seats on this body 0<δ1=0.352<δ2=0.479. In contrast, the Balanced variable, representing boards with a balanced presence of men and women, although having a positive effect, is not significant from an econometric point of view. The results are robust to the use of dynamic models (results showed in the following three columns) and allow us to partially accept hypothesis H3 that the effect of board gender diversity on climate change innovation is driven by the existence of a critical mass of female directors.
In terms of the control variables, the various models confirm that companies with higher levels of resources and capabilities associated with their age and size, as well as those with more effective internal corporate governance structures (i.e. more independent boards and with a higher specialization on sustainability issues) and more active in their dialogue with stakeholders are the most proactive companies in climate change innovation. With regard to national pressures, the European institutional context and the COVID-19 pandemic are drivers of these decisions. As regards the former, our findings reflect the effect of the several reforms introduced in the European Union to encourage business commitment to the fight against climate change (Nube & Velte, 2022). This is also the case for environmental commitment at the country level as measured by the EPI indicator. Conversely, the existence of broader environmental legislation inhibits these proactive practices.
Complementary analysisThe results obtained with respect to critical mass theory, Model 3, suggest the existence of a possible non-linear relationship between board gender diversity and environmental innovation in climate change. To contrast the existence of this relationship and to deepen the understanding of the ideal size of critical mass, the following models have been defined:
Inno_ClimaCh/EnvScore/ESGScorei,t=60+61BoardDiversity/WomenDirectorsi,t+62Square_BD/SquareWDi,t+∑n=3136iFi,t+∑n=14206iBi,t+∑n=21246iIi,t+625Countryi+626Indi+627Yeart+εit+ηi [Model 4]
Inno_ClimaCh/EnvScore/ESGScorei,t=Ω0+Ω1One_WDi,t+Ω2Two_WDi,t+Ω3Three&More_WDi,t+∑n=414ΩiFi,t+∑n=1521ΩiBi,t+∑n=2225ΩiIi,t+Ω26Countryi+Ω27Indi+Ω28Yeart+εit+ηi [Model 5]
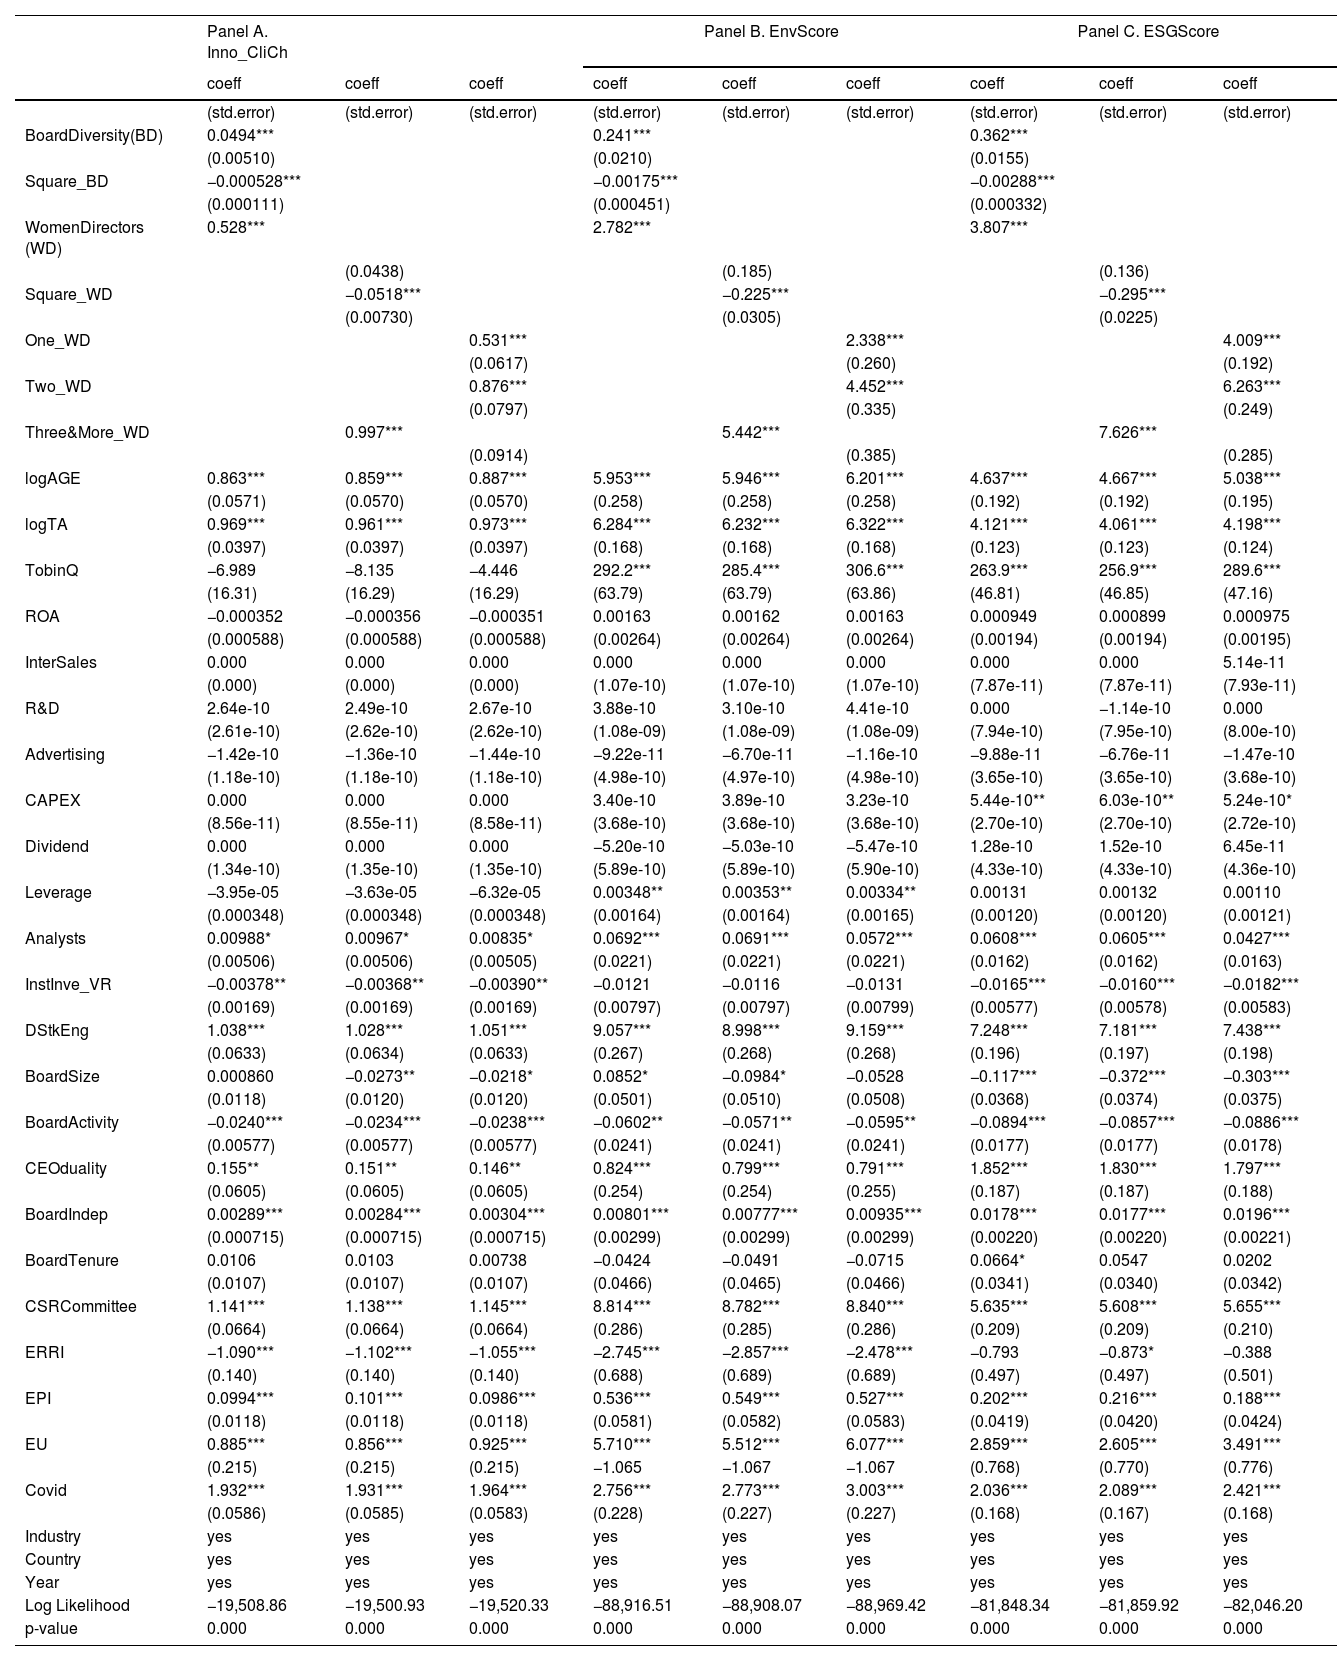
Model 4 has been designed to test for the existence of a possible non-linear relationship between board gender diversity and environmental proactivity in the fight against climate change. For this purpose, both the variables BoardDiversity and WomenDirectors and their squares (Square_BD and Square_WD) have been included. In case of the existence of an inverse-U relationship, it is expected that 61>0y62<0.
In Model 5, following Atif et al. (2021), we have included the dummies One_WD, Two_WD and Three&More_WD that take the value 1 to identify those companies whose boards have, respectively, 1, 2 and 3 or more female directors. Otherwise, the variables take the value 0. It is expected that 0<Ω1<Ω2<Ω3.
In addition, in order to show whether this effect is specific to the decisions made with respect to climate change innovation or is generalizable to all environmental and sustainability areas, the EnvScore and ESGScore variables, constructed from the performance scores available in EIKON for both dimensions, will be used. These models will be estimated using regressions adapted to the nature of the dependant variables, ordinal and Tobit for panel data, controlling for multicollinearity introduced by the squaring of the variables by using centred variables.
The results depicted in Panel A in Table 5 allow us to observe a partial effect of critical mass in the sense that the presence of 3 or more female directors on the board has a greater impact on climate change innovation than if there are one or two female directors, but the presence of a single female director guarantees business proactivity in the fight against climate change (0<Ω1=0.531<Ω2=0.876<Ω3=0.997).
Complementary analysis (*** p<0.01, ** p<0.05, * p<0.1).
Additionally, in the first two columns it can be seen that there is a non-linear relationship (inverted U-shaped) between board gender diversity and climate change innovation, as it is confirmed that 61>0y62<0. In this respect, to determine the ideal number or proportion of female board members, we calculate the point Ф1 at which the change in the effect of these variables occurs, which is determined by Ф1 = - (61 / 262). We found that this point is associated with the presence of 5 female directors on the board, which means 46.78% of the board members. Thus, when the number of female directors on the board surpasses five, climate change innovation does not correlate with the percentage of female directors or the statistical significance of the association between them decreases.
Furthermore, the relationships observed for the Inno_ClimaCh variable are confirmed in the models estimated for EnvScore and ESGScore, synthesized in panels B and C in Table 5. Therefore, it can be stated that the U-inverse relationship associated with board gender diversity is generalizable to any corporate sustainability decision made by boards of directors.
DiscussionSummary of findingsOur findings show that climate change innovation is positively associated with both the percentage and the number of female board members, indicating that, as posited by hypothesis H1, board gender diversity is associated with greater climate change innovation. Thus, the results support the theoretical predictions that female board representation favours the inclusion of climate change issues into corporate strategies and the adoption of proactive environmental initiatives in this regard, and are consistent with previous empirical evidence documenting a positive association between board gender diversity and eco-innovation (Galia et al., 2015; Glass et al., 2016; He & Jiang, 2019; Hobach & Jacob, 2018; Liao et al., 2019; Moreno-Ureba et al., 2022; Nadeem et al., 2020; Naveed et al., 2022) and climate change mitigation initiatives (Atif et al., 2021; García Martín & Herrero, 2020; Gull et al., 2022; Haque, 2017; Konadu et al., 2022; Nube & Velte, 2020).
However, this positive effect does not depend on the type of board female member considered (independent or executive director). In our sample, both independent and executive female directors have a positive and significant impact on climate change innovation, the impact being more pronounced for executive female directors than for independent female directors. Therefore, contrary to hypothesis H2, the positive effect of board gender diversity on climate change innovation is not due to the presence of independent female directors. This result is inconsistent with theoretical predictions that independent directors increase board effectiveness through better oversight, expertise and stakeholder orientation. Moreover, it contradicts previous empirical evidence (e.g., Atif et al., 2020, 2021; Gull et al., 2022), indicating a greater impact of independent female directors on environmental proactivity compared to executive female directors. This could be due to the fact that in our case the proportion of independent and executive female directors is relatively balanced, compared to other studies. In our view, a possible explanation for our result could be that, not belonging to the “old-boys’ network”, female directors tend to exhibit greater independence than their male counterparts (Adams & Ferreira, 2009; Li & Li, 2020; Seebeck & Vetter, 2022), which makes them better monitors regardless of their ties to the company, as independent or executive directors.
Our results partially support hypothesis H3. In line with its postulation, environmental proactivity in the fight against climate change increases as the number of female directors increases. Thus, the statistical significance of female board representation is greater for companies with three female directors than for companies with two, and is greater when there are two female directors on the board than when female board representation is limited to a single female director. Likewise, the effect is greater when female board representation accounts for between 20% and 40% of the board size than when female directors occupy less than 20% of the board seats. Nevertheless, the presence of a single woman on the board has a significant impact on climate change innovation, without the need for a critical mass. These findings are in line with those obtained by Naveed et al. (2022) but contradict the results obtained by Ben-Amar et al. (2017), He and Jiang (2019), Hollindale et al. (2019), Moreno-Ureba et al. (2022), Nube and Velte (2021) and Torchia et al. (2011),
Our findings also indicate that there is a non-linear (inverted U-shaped) relationship between board gender diversity and climate change innovation. Thus, boards of directors with a balanced presence of men and women have a positive but not statistically significant effect. In addition, we found that when there are five or more female board members, which means 46.78% of the board, climate change innovation does not correlate with the percentage of female directors or the statistical significance of the association between them decreases. These results are in line with those obtained by Birindelli et al. (2019), Naveed et al. (2022) and Nube and Velte (2021).
Research and practical implicationsThis study complements previous research on the association between board gender diversity and eco-innovation and climate change mitigation initiatives by focusing on those innovations aimed at combating climate change, thereby responding to recent calls to explore the role of board gender diversity in shaping business initiatives to fight against climate change (Liao et al., 2015; Le Loarne-Lemaire et al., 2021). We provide empirical evidence of “who” within companies promotes innovation aimed at mitigating climate change and “how” and “under what conditions” they do so. Additionally, we support the need for a multi-theoretical framework that combines different theoretical lenses to provide a better understanding of the effect of the female board representation on environmental proactivity and, specifically, on climate change innovation.
Our results show that female board representation has a positive impact on climate change innovation and that this impact does not require a critical mass of female directors, although it is stronger as the number (percentage) of female directors increases until the threshold of five female directors (46.78% of the board members) is reached, at which point the relationship loses strength, suggesting a non-linear (inverted U-shaped) relationship between board gender diversity and climate change innovation. We also show that the positive effect of female board representation is stronger for executive female directors than for independent female directors, indicating that female directors influence climate change innovation mainly through the “executive power channel”, owing to their direct involvement in management (Atif et al., 2020, p, 4357), rather than through the monitoring and advisory roles that characterize independent directors.
As for the practical implications of the study's findings, they provide valuable reasons for promoting gender diversity on boards: it favours the inclusion of climate change issues into corporate strategies, which positively affects innovation in climate change mitigation. Therefore, companies, investors and policymakers concerned about climate change should encourage a gender-balanced board composition as well as a greater involvement of female directors in management. At the societal level, our results show that promoting the fair participation of women on the board of directors is not only a matter of social justice but can also contribute to protecting the planet.
ConclusionsThe fight against climate change has become a societal challenge that requires the coordinated efforts of a variety of actors, including companies whose investments in climate change mitigation technologies have grown in recent years (PwC, 2021). This paper responds to recent calls to examine the role of board gender diversity in shaping corporate responses to climate change (Le Loarne-Lemaire et al., 2021; Liao et al., 2015) by analysing whether female board representation is associated with greater climate change innovation and whether its effect is determined by the presence of a greater number of independent female directors or the existence of a critical mass of female directors.
The results obtained for a panel data of 3928 companies over the period 2010–2020 (35,199 observations) confirm that companies with a greater female board representation (both in number and in percentage) are more proactive in terms of investments in innovation for climate change mitigation. However, this positive effect does not require a critical mass of female directors and diminishes when the percentage of board seats held by women is higher than 46.78%, a proportion associated with the presence of five or more female directors. Furthermore, female directors influence climate change innovation mainly through their involvement in management as executive directors, rather than through the monitoring and advisory roles that characterize independent directors. The theoretical and practical implications derived from this research are robust to different considerations and methodological approaches.
Notwithstanding the interest and usefulness of our study, it suffers from some limitations. First, the results may be subject to potential endogeneity concerns due to omitted variables that may affect the relationship between board gender diversity and climate change innovation. Second, the findings could be caused by reverse causality (i.e. the possibility that female directors have self-selected proactive companies in the fight against climate change). Finally, the results may be affected by changing drivers of investments in climate change mitigation innovations and technologies (e.g. environmental regulation).
All these limitations should be addressed in future research. In addition, future studies could examine the moderating impact of some factors that usually drive environmental innovation and climate change mitigation initiatives on female directors’ influence in this regard. Lastly, future research could consider the impact of female directors’ background and demographic features on their influence on climate change innovation.
FundingThis work was supported by Junta de Castilla y León y Fondo Europeo de Desarrollo Regional [Grant/Award No. CLU-2019–03 Unidad de Excelencia “Gestión Económica para la Sostenibilidad” (GECOS)]; Consejería de Educación, Junta de Castilla y León [Grant/Award Number: SA069G18]; Ministerio de Ciencia, Innovación y Universidades [Grant/Award Number: RTI2018‐093,423‐B‐I00]; Xunta de Galicia [Grant/Award Number: 2020 GPC GI-2016]; and Foundation for Science and Technology - FCT [UIDB/04,043/2020].