


Most ecotourism destinations have not yet fully explored the benefits of augmented reality (AR) marketing in relation to family vacations. Although AR improves travel experiences and destination branding, there is limited research on parents’ perceptions of AR when traveling with children. This study combines the unified theory of acceptance and use of technology (UTAUT) with the concept of sustainability education to investigate how parents’ perceptions of AR technology shape visit behavior and destination branding, improve family vacations, and strengthen ecotourism sustainability. A mixed methods approach was applied, combining partial least structural equation modeling (PLS-SEM) with fuzzy-set qualitative comparative analysis (fsQCA). An online survey questionnaire (distributed via the Prolific platform) was completed by 181 parents who visited Romanian ecotourism destinations with their children and had previous AR experience. The PLS-SEM results indicate that facilitating conditions, performance expectancy, social influence, and sustainability education have significant effects on parents’ intentions to use AR technology. Furthermore, these intentions significantly influence destination visit behavior and AR branding. The fsQCA results show that sustainability education is the sole necessary condition for AR technology to influence families’ ecotourism experiences, possibly enhancing destination branding. The findings provide new theoretical and practical implications for ecotourism stakeholders interested in using AR to enhance their branding for families traveling with children.
When choosing an ecotourism destination, tourists increasingly use digital technology to gather information. This tendency is fueled by the growing availability of personal devices such as smartphones. For destinations to capitalize fully on the potential competitive advantages presented by digital technologies, they must match the technology they use with those used by their target customers (Chai-Arayalert, 2020; Sharma et al., 2024). Data on children’s and teenagers’ use of digital media lend credibility to the videophilia hypothesis, which suggests that digital media are taking center stage in everyday recreational activities (Edwards & Larson, 2020). Visitor experiences enhanced by augmented reality (AR) are thus important to ensure that tourism and hospitality businesses remain competitive (Buhalis, 2020; (Gössling, 2017; Jalilvand & Ghasemi, 2024).
From a managerial perspective, the main goal of AR marketing is to provide digital opportunities for customer experiences. Examples include providing digital cues in a physical setting to promote or support customer participation (Chylinski et al., 2020). Customers become engaged by these digital capabilities in a rich context (Heller et al., 2019). This engagement leads to so-called situated cognition, in which consumers actively engage with and rely on a virtually enhanced environment to make their decisions (Hilken et al., 2017).
Yung and Khoo-Lattimore (2019) defined AR as a computer-generated object that improves the real-world environment and provides context-sensitive information about the user’s immediate surroundings using a combination of 3D models, images, immersive features, and technological appliances such as desktop computers, tablets, eyeglasses, and smartphones. Mobile augmented reality is a rising technology that can help children understand and engage with their environment and with products by introducing contextual spatial information. Children can thus develop a collaborative relationship with nature through technology, learning to respect and value the environment in enhanced mental and physical conditions (Legget, 2012) Unrestricted access to digital technologies encourages children to record and observe natural phenomena. In these circumstances, parents may control the information observed by children and the conclusions they reach (Stewart et al., 2020).
Research suggests that AR marketing offers an innovative strategy to enhance tourist experiences (Mohanty et al., 2020; Wedel et al., 2020). AR technology connects tourists with destinations in ways that foster emotional and cognitive engagement, lowering the perceived risks associated with intangible tourist product acquisition in the pre-visit stage and increasing booking intentions (Flavian et al., 2021). Despite these findings, the potential of AR to enhance destination branding in the ecotourism sector has not been fully explored, especially in the case of family vacations, which prioritize joint and educational tourist experiences.
Fan et al. (2022) acknowledged this gap in the literature, concluding that more research is needed to investigate the potential of AR to promote sustainability education experiences, particularly before and during vacations. Furthermore, the unique needs and decision-making behaviors of family ecotourists regarding AR experiences have been insufficiently explored in previous studies, which have primarily focused on solo travelers (Fatma & Bhatt, 2023). Dinç et al. (2023) conducted a bibliometric analysis of ecotourism research published between 1991 and 2021, concluding that future ecotourism studies should focus on issues such as ecotourism intentions and the use of new-generation technologies. Another reason why further research is needed is that recent studies have found low stakeholder awareness and a lack of AR family-focused apps in ecotourism destinations, particularly in Eastern Europe, South America, and Southeast Asia (Baldeon et al., 2023; Beták et al., 2023;Leong et al., 2024). Potential challenges to AR integration in ecotourism destinations, such as high costs or poor infrastructure (Giraldo et al., 2024; Samaddar & Mondal, 2024), should be addressed rather than limiting the potential of AR to meet families’ travel needs for sustainability education.
To the authors’ knowledge, no study has focused on parents’ intentions to use AR technology when traveling with children to ecotourism destinations. To address this gap, the present study focuses on Romanian ecotourism destinations and combines the concept of sustainability education with the unified theory of acceptance and use of technology (UTAUT) to examine the role of AR technology in family ecotourism. By adding sustainability education to the UTAUT, the study explores the influence of sustainability education, along with facilitating conditions, performance expectancy, effort expectancy, and social influence, on parents’ intentions to use AR technology. Additionally, the study investigates whether these intentions influence family visit behavior and ecotourism destination branding. Another goal is to explore how AR marketing can be used to boost family educational experiences and enhance sustainable behaviors in ecotourism destinations. The research questions addressed by this study are as follows:
RQ1: What motivates families with children to use AR technology when traveling to ecotourism destinations?
RQ2: How does the use of AR technology by families with children impact their visit behavior in ecotourism destinations, and how can it eventually be used to inform destination management organizations (DMOs) about future ecotourism branding strategies?
The UTAUT is a comprehensive model that combines constructs from eight well-known models of technology acceptance, including the theory of planned behavior, the technology acceptance model, and the theory of reasoned action (Venkatesh et al., 2003). According to the UTAUT, performance expectancy, effort expectancy, social influence, and facilitating conditions are the four main drivers of intention and usage behavior. The UTAUT is more predictive than its predecessors, providing a comprehensive method for a nuanced understanding of the factors that influence technology adoption (Manfreda & Mijač, 2024; Venkatesh et al., 2012). Its superiority in predicting technology acceptance and use has been validated in recent studies, which highlight the model’s applicability in a variety of technology contexts (Dwivedi et al., 2019). The UTAUT has evolved to handle increasingly complex adoption scenarios. Its adaptability makes it excellent for research involving a variety of user groups and future technologies such as AR. The UTAUT is especially relevant for the study of families traveling with children when considering resource availability and social influence (Oliveira et al., 2021). Finally, it is more insightful than other models that are considered more limited (Camilleri & Camilleri, 2023).
Facilitating conditions refer to a person’s belief in the availability of organizational and technological infrastructure to support system use (Venkatesh et al., 2003). For tourist destinations, the rise of 5G+ networks and the internet of everything (Porter & Heppelmann, 2014) provides major marketing opportunities (Buhalis et al., 2023) by enabling 3D simulations and enhancing the applications of AR technology (Rauschnabel et al., 2022). Web AR has become popular among developers, offering a promising avenue for mobile AR (Qiao et al., 2019).
Talkative Museum is a mobile AR technology that has been tested in museums to observe how it enhances experiences via interactive group activities for parents and children (He et al., 2018; Tokuno et al., 2024). The findings reveal that this prototype successfully generates engagement and group learning. Furthermore, mobile AR provides various ways to explore the environment, enabling fast learning by children by engaging touch, hearing, sight, smell, and sound (Ruchter et al., 2010).
Digital tools have been developed to encourage outdoor play and nature engagement. Interactive digital equipment can also foster children’s interaction with nature in playgrounds (Güdelhöfer, 2016). The EduPARK project offers a relevant example, showing how smartphones and AR can support children’s nature learning by enhancing interactions with urban green spaces (Coppola et al., 2021). Gamified activities are expected to help adolescents appreciate sensory and cognitive experiences with nature (Beery & Jørgensen, 2018; Kleftodimos et al., 2023).
AR marketing has also been explored because of its potential to engage children with natural environments (Kourouthanassis et al., 2015; Sultana & Hawken, 2023). Apps such as LeafSnapPlant Identification & Care, Plantsnap, Picture This Botanist in Your Pocket, and Pl@ntNet use visual recognition to identify plant species, making nature exploration easy for families and encouraging children to connect with their parents and share experiences (Otter et al., 2021). Considering these arguments, the following hypothesis is proposed:
H1 Facilitating conditions have a significant positive effect on parents’ intentions to use AR technology while traveling with children to ecotourism destinations.
The imaginative and creative demands of traditional nature-based recreation mean that it may struggle to compete with captivating virtual environments (Edwards & Larson, 2020). Minges et al. (2015) argued that children often do not know how to spend their free time besides playing video games. Moreover, Mjaavatn (2016) reported that children today are now engaging in more intense outdoor activities rather than traditional nature-centered leisure activities. Thus, more enjoyable nature experiences may be required to replicate the engaging experience provided by AR technology.
Ecotourism destinations could design and implement AR mobile apps, using gamification strategies to enhance interactions. Sultana and Hawken (2023) argued that these apps can support communication between parents and children through gamified and digitally mediated activities. Mobile AR can also help children overcome potential emotional, cultural, and geographic barriers while learning about their environment (O’Loughlin et al., 2013). McGlynn-Stewart et al. (2018) showed that mobile AR technology can strengthen peer relationships, whereas Cumbo and Iversen (2020) highlighted its role in improving children’s understanding of abstract concepts by linking them to tangible experiences.
Parents are fundamental in supporting children’s connection with nature by guiding and encouraging nature-based activities (Edwards & Larson, 2020). Chawla (2007) argued that this connection is related to the intergenerational transmission of values. However, Hesketh et al. (2017) noted that parents’ excessive use of digital media can influence children’s sedentary behavior. D’Amore (2015) reported that parents’ curiosity and responsibility may increase the likelihood that digitally oriented children choose nature activities. Considering these findings from the literature, the following hypothesis can be formulated:
H2 Performance expectancy has a significant positive effect on parents’ intentions to use AR technology while traveling with children to ecotourism destinations.
One of the key predictors of technology adoption in the UTAUT is effort expectancy (Chao, 2019). Venkatesh et al. (2003, p. 450) defined effort expectancy as “the degree of ease associated with the use of the system.” Merchant (2015) concluded that interactive touch screens require no specific motor skills and are easy to use for young children. Likewise, Vaiopoulou et al. (2021) noted that media consumption, such as touch screen use is a digital routine for many families.
In this research, effort expectancy refers to the ease of using AR apps on smartphones. The assumption is that user-friendly AR apps offered by ecotourism destinations are more likely to be adopted by families traveling with children. Based on these arguments, the following hypothesis is proposed:
H3 Effort expectancy has a significant positive effect on parents’ intentions to use AR technology while traveling with children to ecotourism destinations.
Another external factor influencing parents’ attitudes toward AR technology is social influence. It refers to how others’ presence or actions can affect people’s attitudes, beliefs, and behaviors (Venkatesh et al., 2003). People may adopt behaviors against their preferences due to social pressures, reflecting the direct impact of social factors on behavior (Lim, 2022). Saprikis et al. (2020) suggested that AR technology is highly relevant in this context because it is considered more influential than functional.
Harborth and Pape (2017) argued that social influence on the use of gamified AR mobile apps can lead to opposite outcomes. Whereas young parents may experience pressure from other influential parents, older ones may feel reluctant or embarrassed to use AR technology. However, in this research, it is assumed that the influence of extensive use by other families and children is positive. Hence, the following hypothesis is proposed:
H4 Social influence has a significant positive effect on parents’ intentions to use AR technology while traveling with children to ecotourism destinations.
AR technology can also help biophobic children (Louv, 2005) by offering an engaging way to interact with nature. This feature could be extremely helpful, especially in smart cities, where the use of electronics has greatly increased and children will become future digital citizens (Sultana & Hawken, 2023). Therefore, parental support of children’s early use of technology-based activities is crucial (Stewart et al., 2020). Although some parents encourage their children to be independent through technology skills (Yeh, 2017), others downplay its importance or see no benefit in early childhood usage (Palmer, 2015). Fantozzi (2022) advocated deliberate decisions on technology use, with careful supervision and role-modeling from parents, concluding that providing resources and ensuring active parent involvement are ways to help children reach their full potential.
In ecotourism, Chen (2022) discovered that AR digital picture books promote children’s environmental awareness and self-efficacy, leading to greater participation in conservation behaviors through immersive and interactive learning. In line with the increasing demand for educational and sustainable tourism, research also suggests that parents prefer destinations that offer AR-guided experiences because they keep children entertained and promote intergenerational learning (Benckendorff et al., 2018). Furthermore, families can explore wildlife habitats, preview conservation efforts, and engage in gamified environmental education at AR-enhanced ecotourism destinations. These options reduce doubt about the vacation’s value and make ecotourism destinations more appealing than traditional ones (Baldeon et al., 2023). In line with the findings in the literature, the following hypothesis is proposed:
H6 Facilitating conditions have a significant positive effect on the destination visit behavior of parents traveling with children to ecotourism destinations.
Information technology (IT), including AR, plays a crucial role in tourist experiences and behaviors in tourism destinations (Tussyadiah et al., 2018). Chung et al. (2015) concluded that tourists who enjoy using AR technology while on vacation are more likely to form AR-based images of a destination. Knani et al. (2022) reported that these AR-driven images can influence tourists’ future travel intentions. Additionally, Jalilvand and Ghasemi (2024) argued that AR empowers tourists by facilitating learning about destinations, offering simulations to enhance skills, providing educational tools, preserving cultural knowledge, and supporting access to travel guides, local history, and attractions. Therefore, the following hypothesis is proposed:
H7 Parents’ intentions to use AR technology for interactive experiences with children have a significant positive effect on destination visit behavior in the context of ecotourism.
Sustainability education entails teaching and learning. These activities are crucial for endowing individuals with the knowledge, skills, and values they need to address the economic, social, and environmental challenges involved in sustainable development (Fennell, 2020; Sterling, 2021). Adding sustainability education to the UTAUT is important because of its role in shaping parents’ behavioral intentions regarding sustainable technology adoption in the ecotourism context (Hui et al., 2023). AR technology facilitates immersive learning and interactive experiences (Omran et al., 2023), fostering environmental awareness and supporting sustainable tourism practices (Hanaa & Abdul, 2024). AR mobile apps such as Seek by iNaturalist application, Merlin All About Birds application and iTrack Wildlife–Animal Tracks App help parents and children explore natural resources and build a connection with the environment by promoting outdoor play.
Sultana and Hawken (2023) concluded that ecotourism apps are useful for families in learning about local vegetation and fauna and offering rewards for activities such as tree planting and trash cleanup. Fortino et al. (2014) noted that wisely used AR apps provide a strong connection to nature, generate compassion for species and habitats, and eventually encourage environmental awareness in children. They also suggested that hands-on activities are crucial for young children to build these connections and enhance their instinctive learning. Additionally, AR boosts attention and engagement, especially among younger audiences, and helps parents explain points of interest to their children (Cranmer et al., 2023; Mortara et al., 2014; Schott, 2017). Parents play a central role in sustainability education. Through role-modeling, they enhance children’s pro-environmental behavior (Grønhøj & Thøgersen, 2017; Jia & Yu, 2021). Engaging in AR-driven ecotourism experiences helps parents instill environmental values in their children, shaping their sustainability behavior. The literature suggests that, within ecotourism, parents may find AR technology valuable for educating their children about sustainability while supporting DMOs’ co-responsibility initiatives. Accordingly, the following hypothesis is proposed:
H5 Sustainability education has a significant positive effect on parents’ intentions to use AR technology while traveling with children to ecotourism destinations.
Ecotourism destination branding should promote a sustainable image, balancing values related to the dimensions of sustainability with an attractive brand that meets stakeholder needs (Belova et al., 2021; Tajer & Demir, 2024). AR marketing combines AR experiences with brand dimensions to meet marketing goals. It thus provides value for brands, stakeholders, and society while considering ethical issues (Rauschnabel et al., 2019). Rauschnabel et al. (2022) introduced the BICK FOUR framework based on branding, inspiration, convincing, and keeping to implement marketing objectives aligned with the customer journey. Because Romanian ecotourism destinations have not designed AR technology for tourist experiences, this study focuses on branding objectives such as increasing brand awareness (Javornik et al., 2021), enhancing brand image (Rauschnabel et al., 2019), and reaching new target audiences (Sung et al., 2021), according to parents’ perceptions.
Kumlu et al. (2024) revealed the importance of AR solutions in education, services, and security. They highlighted the use of smartphones for personalization, interactive experiences, data collection, and decision making. Jalilvand and Ghasemi (2024) noted that destination marketers can use AR to engage young tourists who are passionate about innovative technology. Shabani et al. (2019) concluded that AR applications such as social travel gamification and AR websites have improved tourist experiences through smart tourism. Shen et al. (2022) emphasized the role of AR for enhancing destination information and tourists’ behavioral intentions. Moreover, Lim et al. (2024) suggested that, by using AR, destinations can overcome competitors and attract ecotourists. AR mobile apps offer advantages for consumer marketing, online communities (Fong & Frost, 2009), brand awareness (Xu et al., 2015), brand image, and the minimization of negative word-of-mouth (Buhalis & Law, 2008).
AR games offer parents the opportunity to guide and model the behaviors of their children, enhancing cultural heritage preservation and positive emotions. Benckendorff et al. (2018) concluded that AR mobile apps can influence parents’ and children’s environmental behavior toward the cultural, economic, and environmental sustainability of ecotourism destinations. Thus, the following hypothesis is proposed:
H8 The destination visit behavior of parents traveling with children has a significant positive impact on destination branding in the context of ecotourism.
The conceptual model illustrates the proposed relationships between the independent variables and parents’ intentions to use AR technology at ecotourism destinations. In this model, sustainability education is combined with the UTAUT to explore the effects of facilitating conditions, performance expectancy, effort expectancy, social influence, and sustainability education on AR technology usage intention (Fig. 1).

Considering the AR marketing branding phase, these variables are expected to influence visit behavior positively and strengthen the destination’s brand. This conceptual model also makes predictions about the role of family educational experience in promoting sustainable tourism practices and enhancing the choice of ecotourism destination for families with children. To test this conceptual model, a combined symmetric and asymmetric approach was used based on partial least squares structural equation modeling (PLS-SEM) and fuzzy-set qualitative comparative analysis (fsQCA). PLS-SEM assumes linear effects across all constructs, even when quantifying causal relationships (Sarstedt et al., 2021). In contrast, configurational theory (fsQCA) assumes that several configurations of factors can lead to a given outcome (Meyer et al., 1993). FsQCA reveals a variety of equifinal paths. Accordingly, various combinations of AR behavior and cognitive constructs can influence destination branding in the context of family ecotourism. According to the guidelines for multi-method research in tourism, alternative factor configurations should be explored by combining fsQCA with PLS-SEM to validate key relationships quantitively (Rasoolimanesh et al., 2021). The application of fsQCA to AR marketing research has been endorsed by tom Dieck et al. (2024), who stressed the importance of examining comprehensive interaction patterns within the framework of the 4Cs of AR (consumer, content, context, and computing device).
PLS-SEM methodologyIn management, marketing, and the social sciences, PLS-SEM is a widely used advanced analysis technique (Law & Fong, 2020). PLS-SEM explains statistical relationships based on model validation and visualization (Hair & Alamer, 2022). PLS-SEM was appropriate in this study because most constructs were characterized by two items (Hair et al., 2014; Henseler, 2020). In addition, the study used a reflective model of well-established and intercorrelated latent variables and items (Coltman et al., 2008). The questionnaire included two to three items per reflective latent variable (Table 1) to capture the items and constructs in the research model. The measurement model was tested for internal consistency, discriminant validity, and convergent validity using confirmatory factor analysis. Furthermore, the structural model was assessed to examine causal relationships between constructs.
Questionnaire details.
Qualitative comparative analysis (QCA) enables in-depth analysis of multiple scenarios in complex environments. The aim is to identify potential behavior patterns within the collected data. In this study, fuzzy-set QCA (fsQCA) was used to analyze the relationships between causal conditions and outcomes based on set-membership scores ranging from 0 to 1. FsQCA is suitable for analyzing behaviors that are difficult to classify (Dragan et al., 2024; Glaesser, 2023).
FsQCA identified specific configurations of families’ perceptions of facilitating conditions, performance expectancy, effort expectancy, social influence, sustainability education, augmented reality interactivity, and destination visit behavior affecting destination branding. The effect of these constructs varied between high, low, and nonexistent across cases. FsQCA is based on the principles of conjunction, equifinality, and causal asymmetry. Using an inductive research framework, it offers an effective tool for analyzing how AR technology influences destination branding in ecotourism.
Facilitating conditions, performance expectancy, effort expectancy, social influence, sustainability education, augmented reality interactivity, and destination visit behavior were key constructs in the conceptual model. They were expected to play a role in causing the outcome of ecotourism destination branding. The analysis followed the approach described by Ragin (2000) using FS/QCA 4.0 software. Thus, the principles of fuzzy sets, logic, and QCA were combined to identify the pathways to the outcome of interest.
Sample and data collectionThis study combines the UTAUT with sustainability education and AR marketing to explore the impact of AR technology on factors influencing parent-child interactions and ecotourism experiences. The UTAUT constructs of social influence, effort expectancy, performance expectancy, and facilitating conditions capture parental perceptions of AR’s effectiveness, usability, social impact, and access to information. Sustainability education refers to AR’s role in educating families about sustainable practices in ecotourism by emphasizing shared responsibility, local spending, and cultural awareness. Destination branding relates to how AR experiences enhance ecotourism destinations’ image and awareness of the ecotourism brand. To examine the relationships among these constructs, the study tested hypotheses on the adoption and influence of AR in family-focused ecotourism destinations.
To test the study hypotheses, a 17-item questionnaire was created in Google Forms. It was shared online using the Prolific platform. A pilot survey was first performed to confirm the questionnaire’s validity. Necessary adjustments were then made. The survey targeted parents who traveled with children and had prior experience with AR technology. In total, 220 respondents completed the survey between April and July 2024.
Nakagawa and Foster (2004) recommended a prospective approach to estimate the minimum sample size in quantitative research. Studies should aim for an effect size of 0.04, which is twice Cohen’s minimum threshold (Cohen, 1988, 1992). In complex models, competing links reduce impact size. Given the complexity of the model in this study, the inverse square root method suggested a minimum sample size of 160 (Kock & Hadaya, 2018).
As shown in Table 2, the questionnaire was divided into several sections. The first included three filter questions. The study considered only parents who traveled with children aged 7 to 18 years because children develop the ability to use AR applications by that age (Yadav et al., 2020). Additionally, the research considered only parents who traveled with children to Romanian ecotourism destinations and had experience with AR. Thus, of the 220 responses, 18 were deleted because they did not meet these criteria. Responses were then checked to ensure that they had a standard deviation of <0.25, with higher values indicating potential respondent misconduct (Collier, 2020). Accordingly, another 21 responses were deleted. The final sample therefore comprised 181 valid responses.
Demographic profile of respondents (source: Authors).
In the second section of the questionnaire, the outcome (destination branding) and its predictors (performance expectancy, effort expectancy, facilitating conditions, sustainability education, social influence, AR usage intention, and destination visit behavior) were measured. In the third section, parents were asked to give details on their demographic profile. They also provided details about the Romanian ecotourism destination they had visited or planned to visit with their children. These data contributed to building the demographic profile of the respondents, as shown in Table 2. The data were prepared using SmartPLS version 4 after data collection. The 17 items in the first three sections were measured using a 7-point Likert scale, ranging from 1 (strongly disagree) to 7 (strongly agree).
Calibration processData were calibrated using external criteria based on the study’s description, formulation, and labeling (Table 3). Three qualitative breakpoints were used to create a fuzzy set for the 7-point Likert scale: full membership (7), full non-membership (1), and crossover point (4). Using the fsQCA method, the interval scale values corresponding to these breakpoints were identified (Ragin, 2000). They enabled transformation of the original interval scale values into fuzzy membership scores. Because it considers scores ranging from 0.05 to 0.95, this method provides an accurate calibration (standard error of 0.05) of case set membership.
Calibration of scales (source: Authors adapted from Ragin, 2000).
This study highlights the advantages of combining PLS-SEM and fsQCA to assess the causal effects of selected antecedents on an outcome of interest. The scores from the PLS-SEM analysis of the representation of concepts (antecedents and outcome) and their empirical manifestation provided the exact input for the fsQCA. The goal of the fsQCA was to identify multiple combinations of antecedent conditions that lead to the outcome in the proposed model.
PLS-SEMFirst, the measurement model’s internal consistency, discriminant validity, convergent validity, and indicator loadings were assessed (Hair et al., 2017). Following the indications of well-known PLS specialists, items with outer loadings of <0.7 were removed from the model (Ali et al., 2018; Henseler et al., 2009).
The discriminant validity of the model increased considerably once these components had been eliminated. Using SmartPLS4 software, Cronbach’s alpha and the composite reliability (rho_a and rho_c) were calculated to evaluate internal consistency. To assess convergent validity, the average variance extracted ratio (AVE) was evaluated. The degree of correlation between the reliability of the research instrument and the latent variables in the structural model is indicated by Cronbach’s alpha (Table 4). According to the criteria of Taber (2018), the values of all constructs were acceptable, ranging from 0.608 (facilitating conditions) to 0.866 (destination branding). Composite reliability (rho_a and rho_c) accounts for the different loadings for each indicator. Therefore, it is more adaptive than Cronbach’s alpha. Every variable in this study had a composite reliability value above the 0.7 threshold. When the AVE was used to verify the convergent validity of the model, the values for all eight variables were higher than the specified minimum threshold of 0.5 (Table 4).
Internal consistency and convergent validity of the research model.
Note: ARI = intention to use AR technology; DB = destination branding; DVB = destination visit behavior; EE = effort expectancy; FC = facilitating conditions; PEX = performance expectancy; SE = sustainability education; SI = social influence.
Because an online survey was used to collect the data, possible common method bias was considered. The research model did not exhibit collinearity or common method bias issues according to the variance inflation factor (VIF) values of <3.3 (Kock, 2015). Discriminant validity was verified using the Fornell-Larcker criterion and the heterotrait monotrait correlation (HTMT) ratio. The correlation between the latent variables and the square root of the AVE was compared using the Fornell-Larcker criterion. For a reflective variable to be considered significant, the square root of its AVE must be higher than its correlations with other latent variables. All values were higher than the correlations with the other latent variables. Therefore, this condition was confirmed. Table 5 displays these results below the main diagonal.
Discriminant validity (Fornell-Larcker criterion).
Note: Diagonal entries represent the square root of the AVEs; off-diagonal entries represent the correlations between constructs. ARI = intention to use AR technology; DB = destination branding; DVB = destination visit behavior; EE = effort expectancy; FC = facilitating conditions; PEX = performance expectancy; SE = sustainability education; SI = social influence.
According to Henseler et al. (2015), the HTMT ratio is compared to a maximum threshold that indicates the existence of discriminant validity. As a rule, this threshold is <0.85 for conceptually separate constructs and <0.90 for comparable constructs. Table 6 gives additional evidence of the model’s discriminant validity, with all variable correlations in this study falling below the upper limit of 0.90.
Discriminant validity (HTMT ratio).
Note: ARI = intention to use AR technology; DB = destination branding; DVB = destination visit behavior; EE = effort expectancy; FC = facilitating conditions; PEX = performance expectancy; SE = sustainability education; SI = social influence.
The results for the structural model indicate that in ecotourism destinations, intention to use AR technology had the biggest effect on destination visit behavior, with a value of 0.694. Effort expectancy had the smallest impact on AR usage intention, with a value of -0.081 (Fig. 2).

The statistical contributions of reflective latent variables to latent variables are indicated by their external loadings. Most parents reported that they have the knowledge to guide their children in effectively using AR mobile apps while visiting ecotourism destinations (FC2). Thus, this item had the largest statistical contribution to the facilitating conditions latent variable (Fig. 2). Using AR websites to educate a child is more effective than traditional methods (PEX1) had the greatest statistical contribution to performance expectancy. Furthermore, a large percentage of parents agreed that using AR mobile apps for parent-child interactions is straightforward and understandable (EE2). Hence, this item had the largest statistical contribution to the effort expectancy latent variable. Parents reported that they should use AR mobile apps for parent-child interactions because most families already do (SI2). This item had the highest statistical contribution to the social influence latent variable. In addition, most parents reported that AR websites endorse co-responsibility practices shared by families and DMOs (SE3). Hence, this item had the greatest statistical impact on the sustainability education variable. Parents stated that they are committed to become proficient with AR mobile apps while enjoying parent-child interactive experiences (ARI1). This item had the greatest statistical contribution to the AR usage intention latent variable. Most parents stated that they prefer ecotourism destinations that offer AR website experiences for family trips (DVB1). This item had the greatest statistical contribution to the destination visit behavior variable. Finally, tailored AR interactive experiences for families enhance the eco-brand image of ecotourism destinations (DB2) had the highest statistical contribution to the destination branding outcome variable.
Regarding explained variance, 66.2 % of the variation in AR usage intention was explained by the combined effects of facilitating conditions, performance expectancy, effort expectancy, social influence, and sustainability education (coefficient of determination R2 = 0.662). Likewise, 44.5 % of the variation in destination visit behavior was explained by the effect of AR usage intention (coefficient of determination R2 = 0.445), and 41 % of the variation in destination branding was explained by the effect of destination visit behavior (coefficient of determination R2 = 0.410).
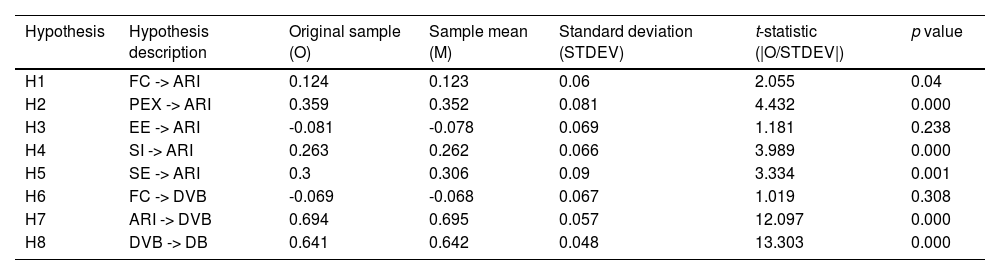
PLS-SEM uses bootstrapping to test the hypotheses captured by the conceptual model. This procedure means that to estimate the structural model, subsamples are created using random observations from the original data set. Fewer than 5000 samples were produced by the SmartPLS program for this analysis. Statistical reports with t-test findings and asymptotic significance (p values) were generated using parameter estimations from the structural model. One-tailed tests usually result in smaller p values. Therefore, two-tailed testing was applied to verify or refute the hypotheses (Kock, 2015). Six of the eight hypotheses were found to be valid, with p values less than the maximum permitted significance level of 0.05 (Table 7).
Values for the asymptotic significance (p) and t-test for the structural model hypotheses.
Note: ARI = intention to use AR technology; DB = destination branding; DVB = destination visit behavior; EE = effort expectancy; FC = facilitating conditions; PEX = performance expectancy; SE = sustainability education; SI = social influence.
The asymptotic significance for each hypothesis was as follows: H1 p = 0.04, H2 p = 0.000, H4 p = 0.000, H5 p = 0.001, H7 p = 0.000, and H8 p = 0.000. Hypotheses H3 and H6 were rejected (p = 0.238 and p = 0.308, respectively). The t-test revealed the strength of the relationships between the latent variables in the proposed model. Destination visit behavior had the greatest impact on the outcome of destination branding (t-value = 13.303).
FsQCASeveral combinations of causal conditions were found to be sufficient for the outcome of interest in this study. It is generally accepted that the value for the consistency measure should surpass the threshold of 0.75 for a configuration to be deemed sufficient (Woodside, 2014). The coverage and consistency scores on fuzzy-set XY plots can be used to confirm whether this threshold is surpassed. The outcome of destination branding was observed to be the combination of the seven antecedent conditions (ANTECEDENT: performance expectancy, effort expectancy, social influence, facilitating conditions, sustainability education, AR usage intention, destination visit behavior). The model had a coverage score of 0.530793 and a consistency score of 0.985882. Therefore, ANTECEDENT and the outcome (destination branding) were fairly similar. This finding indicates that this new combined antecedent (ANTECEDENT) covered 53.07 % of the outcome and that the fuzzy-set distribution was highly compatible with the hypothesis that this combined antecedent is a subset of destination branding. Further analysis was required even though the consistency and coverage scores indicated a strong causal relationship between cases. Truth table analysis was thus used to identify the intermediate, parsimonious, and complex solutions for the model.
Research indicates that the number of cases explained by a configuration is determined by setting a frequency threshold. Coverage is generally higher when there is a lower threshold and lower when there is a higher threshold. The current sample consisted of 181 respondents, so the chosen threshold was three cases (Pappas & Woodside, 2021). The values in the last row of Table 8 confirm that the solution provided by the software had SYM consistency and PRI consistency scores below the suggested threshold of 0.7. This criterion lowers the number of type II and type I errors (Dul, 2016). The truth table (Table 8) of the model ANTECEDENT → Outcome (destination branding) displays every feasible logical causal pairing between the antecedent conditions that could possibly result in the outcome of interest. The truth table for the negated outcome (Table 9) shows the possible configurations of antecedent conditions that could present barriers to employing AR technology and that have very little or no impact on destination branding for families traveling with children.
Truth table for the outcome (source: Authors).
Note: ARI = intention to use AR technology; DB = destination branding; DVB = destination visit behavior; EE = effort expectancy; FC = facilitating conditions; PEX = performance expectancy; SE = sustainability education; SI = social influence.
Truth table for the negated outcome (source: Authors).
Note: ARI = intention to use AR technology; DB = destination branding; DVB = destination visit behavior; EE = effort expectancy; FC = facilitating conditions; PEX = performance expectancy; SE = sustainability education; SI = social influence.
The intermediate, parsimonious, and complex solutions for the positive and negative outcomes were identified using the Quine-McCluskey algorithm. The analysis of the positive outcome, destination branding = f(performance expectancy, effort expectancy, social influence, facilitating conditions, sustainability education, AR usage intention, destination visit behavior), revealed 10 configurations in the complex solution, four in the parsimonious solution, and 10 in the intermediate solution (including the first two with core and peripheral conditions). These causal configurations are those that are most likely to lead to the outcome (Fig. 3). The core conditions indicate the conditions that are most important in leading to the outcome. The configurations frequently include the presence of facilitating conditions and effort expectancy, so these antecedents emerge as core conditions in most of the solutions. These constructs are important in most of the pathways leading to high destination branding. Hence, the results imply that when parents have the right facilitating conditions and can use them with little effort, they are more likely to perceive AR technology and its effect on ecotourism destination branding positively.

The absence of performance expectancy from half of the solutions implies that high performance expectations are not important in certain configurations. Similarly, the absence of social influence from five solutions and its presence as a core condition in four solutions implies that recommendations from other families to use AR technology can contribute to high destination branding only in combination with facilitating conditions and effort expectancy. The raw coverage values show that Configuration 10 covers the greatest proportion of the outcome (0.553206), making it the most impactful configuration.
The analysis of the negated outcome, ∼destination branding = f(performance expectancy, effort expectancy, social influence, facilitating conditions, sustainability education, AR usage intention, destination visit behavior), assessed whether AR technology has a minimal or nonexistent impact on destination branding for families traveling with children (Pappas et al., 2017). The analysis showed eight configurations in the complex solution, four in the parsimonious solution, and eight in the intermediate solution that could potentially lead to the negated outcome (Fig. 3). Several configurations were characterized by the absence of performance expectancy, destination visit behavior, and sustainability education as core conditions. Thus, when parents perceive that AR technology is not useful for children’s education, lacks sustainability messaging, and is not integrated into family bonding experiences, it fails to contribute to destination branding in ecotourism. Furthermore, facilitating conditions and effort expectancy were present as peripheral conditions in five configurations for facilitating conditions and four configurations for effort expectancy. This finding indicates that although ease of access and limited effort may support family AR usage, these variables alone are insufficient to drive destination branding in ecotourism. In addition, strong cognitive and experiential engagement factors are needed, such as performance expectancy, sustainability education, and destination visit behavior.
The raw coverage data show that Configuration 1 covered the largest proportion of the outcome (0.633835), making it the most effective configuration for predicting low destination branding impact. According to Ragin (2000), configurational reasoning is the cornerstone of QCA. In a social setting, an outcome might result from multiple causes acting at the same time. This idea is especially crucial for updating branding strategies in Romanian ecotourism destinations that use AR technology because a variety of factors influence the decisions of families with children. The existence of different solutions with a range of configurations resulting in high destination branding illustrates the fsQCA principle of equifinality. According to this principle, multiple combinations of elements may result in the same outcome. The fact that the importance of some factors varies depending on the presence of others highlights conjunctural causation. Under this principle, the influence of one condition is determined by the existence or absence of another. Table 10 shows various alternative combinations of antecedent conditions that lead to the outcome of interest.
Necessary conditions for the model Antecedents → Positive and Negated Outcome Destination Branding (DB & ∼DB).
Note: ARI = intention to use AR technology; DB = destination branding; DVB = destination visit behavior; EE = effort expectancy; FC = facilitating conditions; PEX = performance expectancy; SE = sustainability education; SI = social influence.
To ensure the fit of the model, only one combination with a consistency value of greater than 0.90 was chosen. Only sustainability education was identified as a necessary condition for AR technology to have a strong influence on families’ ecotourism experiences, potentially boosting destination branding. This condition meets the threshold of 0.9 for consistency, confirming that it is necessary. Other factors such as AR usage intention, facilitating conditions, and effort expectancy are influential but do not meet the consistency threshold for necessity.
FsQCA provides a solid framework for identifying the crucial AR features for families visiting Romanian ecotourism destinations with children. By considering the AR constructs that enhance and hinder destination branding, ecotourism marketers can allocate resources more effectively and develop strategies that attract and retain families with children, thereby enhancing people’s awareness of the destination and the destination’s image.
Decision trees were produced to highlight the key conditions that influence both positive and negative destination branding outcomes. These decision trees help clarify the fsQCA solutions. The decision trees were generated with Python’s scikit-learn library (Scikit-learn Developers, 2024) using the “DecisionTreeClassifier” function. This function applies a recursive splitting approach based on the Gini impurity criterion to classify cases into positive or negative destination branding outcomes.
For the outcome of positive destination branding, key predictors include sustainability education, intention to use AR technology, and destination visit behavior. High sustainability education (> 0.78) and AR usage intention (> 0.515) significantly increase the likelihood of successful destination branding. Facilitating conditions and social influence play secondary roles in reinforcing positive branding (Fig. 4).

Conversely, the decision tree for the outcome of negative destination branding (∼DB) shows that low AR usage intention, sustainability education, and destination visit behavior strongly indicate branding failure. Weak social influence and facilitating conditions further contribute to negative destination branding (Fig. 5). These findings provide further insight into the fsQCA solutions, showing that sustainability education and AR usage intention are important for destination branding success.
Discussion
This study is the first to integrate the UTAUT with sustainability education and the branding phase of AR marketing to explore how parents traveling with children to ecotourism destinations perceive AR technology. The quantitative approach of PLS-SEM confirmed that most UTAUT antecedents play a role in parents’ intentions to use AR technology and visit behavior. Facilitating conditions (H1, effect coefficient: 0.124), performance expectancy (H2, effect coefficient: 0.359), and social influence (H4, effect coefficient: 0.263) have a significant positive effect on parents’ intentions to use AR technology. Furthermore, parents’ intentions to use AR have a significant positive effect on visit behavior (H7, effect coefficient: 0.694).
These results related to H1 extend the applicability of the UTAUT to family ecotourism. Beery and Jørgensen (2018) and Tokuno et al. (2024) have highlighted the need for appropriate knowledge and resources for technology acceptance. Their studies support this research, whose results reveal that parents engage with AR technology in ecotourism destinations when they have the necessary facilities and knowledge to support their children. This finding is crucial for ecotourism stakeholders who need to enhance trust by providing technical and educational support for family AR experiences.
The results regarding H2 confirm that AR performance expectancy positively influences parents’ intentions to use AR in ecotourism destinations. This finding is aligned with those of Edwards and Larson (2020), who emphasized digital engagement as a strategy to enhance children’s connection to nature. However, this study extends previous findings, which focus on children’s digital preferences. It does so by showing that parents view AR websites and mobile applications as tools for both education and engagement. Thus, AR offers a practical marketing solution for ecotourism. Therefore, parents play an active role in using AR technology for the educational benefits of all family members, reinforcing the potential of AR in ecotourism destination branding.
The results for H4 reveal the significant effect of social influence on parents’ AR adoption in ecotourism. These results, which highlight the contextual variation in social norms in technology acceptance, contradict the findings of Harborth and Pape (2017), who concluded that social influence has no impact on AR gaming. The present study’s findings are in line with those of Osorio-Saez et al. (2021), who found that parental technology adoption is primarily influenced by peer behavior and perceived community acceptance in schools. Accordingly, this study expands the theory by showing that social influence is especially important in tourism decision-making processes involving children. Therefore, considering application-specific and user-group factors in AR adoption frameworks seems to be crucial.
According to the results in relation to H7, parents who engage with AR mobile apps prioritize destinations that offer AR experiences. These results are supported by previous research (Jalilvand & Ghasemi, 2024; Knani et al., 2022). This finding reflects the growing importance of AR technology in ecotourism, which affects travel decisions and helps with family bonding. Thus, ecotourism destinations can enhance their attractiveness through AR experiences, targeting families who seek interactive and educational vacations.
In contrast to previous studies (Merchant, 2015; Vaiopoulou et al., 2021), the results lead to the rejection of H3. Effort expectancy did not significantly influence parents’ intentions to use AR in ecotourism. This finding may be explained by parents’ high familiarity with technology, considering that the survey targeted parents with AR experience. Hence, ease of use might have been less critical for these parents. Research suggests that habitual tech users prioritize experience over usability. In addition, advancements in intuitive AR design reduce usability concerns (Khashan et al., 2023). Moreover, parents are likely to prioritize content relevance and children’s educational engagement. This finding is aligned with prior research indicating that utility and fun promote digital tourism adoption more than effort expectancy (Arghashi & Yuksel, 2022). Therefore, the benefits of using AR for children’s learning and engagement may exceed parents’ concerns of low effort in AR use. However, simply integrating AR technology in the tourist experience does not significantly change visit behavior (H6), as suggested by Fantozzi (2022). Accordingly, AR integration in ecotourism destinations should not be supported only by parents’ ability to use AR. Family bonding and the quality of AR experiences seem to play a stronger role in the travel decision process. Additionally, the nonsignificant effect of AR facilitating conditions on parents’ ecotourism decisions (H6) can probably be explained by travel concerns (Guo et al., 2022) and adoption barriers (Koutromanos et al., 2024). Thus, ecotourism destination safety, accessibility, child-friendly eco-lodging, and technological barriers may be more important for parents than AR technology when planning an ecotourism vacation.
The present study also confirms the importance of AR in enhancing family educational experiences (H5), a finding that is supported by recent studies (Cranmer et al., 2023; Sultana & Hawken, 2023). The study shows that parents’ intentions to use AR in ecotourism destinations are significantly influenced by sustainability education. Moreover, AR could be an effective solution for promoting sustainable behaviors in family ecotourism because it increases shared responsibility, local spending, and cultural preservation of ecotourism destinations.
Finally, the results for H8 show that destination visit behavior positively affects destination branding. Parents’ preference for AR-integrated ecotourism destinations boosts family bonding and increases destination appeal. This finding is aligned with research by Buhalis and Law (2008) and Xu et al. (2015), who showed that AR can enhance eco-brand awareness and image. Thus, destinations can strengthen their branding by providing interactive and tailored AR experiences.
The fsQCA results for the positive outcome suggest that AR functionality and social influence are not sufficient for enhancing ecotourism destination branding. Instead, parents’ perceptions are more influenced by AR technological support and low-effort usage. Facilitating conditions and effort expectancy are important because parents prioritize infrastructure readiness and convenience over technical efficiency, especially when considering practical assistance and peer influence. The combination of facilitating conditions and effort expectancy as core conditions in multiple solutions indicates that family AR adoption in ecotourism depends greatly on both technological support and ease of use. However, the fact that, in some solutions, these constructs are combined with other core conditions such as social influence and destination visit behavior suggests that their impact on destination branding could be enhanced through social endorsement and active family engagement. In addition, the study shows that AR’s impact on destination branding is lower when performance expectancy, destination visit behavior, and sustainability education are absent. To enhance branding outcomes, Configuration 1 underscores the need for user-friendly AR and better alignment with family behaviors.
ConclusionsTheoretical contributionsThe study has several theoretical contributions. First, it advances research on AR marketing in tourism by integrating PLS-SEM with fsQCA to provide a comprehensive explanation of AR adoption for the enhancement of ecotourism destination branding for family vacations. By combining linear analysis with configurational theory, the research shows that AR’s impact on ecotourism destination branding is triggered not only by single variables but also by combinations of facilitating conditions, effort expectancy, social influence, and destination visit behavior. A key theoretical contribution is the identification of sustainability education as the single necessary condition for enhancing AR-driven destination branding for family ecotourism. According to parents’ perceptions, cognitive engagement with ecotourism sustainability is necessary for AR to contribute meaningfully to family ecotourism branding.
Second, the research extends the UTAUT by including sustainability education as a key predictor of tourists’ intentions to use AR technology, an approach that could help future studies investigate the potential implementation of other emerging technologies in the ecotourism context such as artificial intelligence assistants. Third, the research provides key insights for advancing AR marketing under the BICK FOUR framework (branding, inspiring, convincing, and keeping) introduced in recent research (Rauschnabel et al., 2022).
Practical implicationsThe findings provide guidance for DMOs, AR developers, and local communities aiming to capitalize on AR’s marketing potential in family ecotourism. Given that sustainability education is identified as the only necessary condition for enhancing ecotourism destination branding, web AR and mobile AR applications must highlight sustainability dimensions to foster pro-environmental behaviors and long-term family engagement. Thus, DMOs should incorporate sustainability education into digital marketing strategies to ensure that AR-driven family experiences highlight economic, social, and environmental sustainability. For instance, AR developers should design interactive and gamified experiences that link digital activities to conservation awareness, biodiversity education, and responsible tourism practices. Therefore, AR technology should be promoted not only for entertainment but also for education to reinforce sustainability values within family ecotourism experiences. To enhance the AR experiences of both parents and children and strengthen ecotourism destination branding, residents should actively participate in AR content development by sharing their knowledge about the destination’s environment, becoming involved in storytelling and cultural traditions, and engaging in economic sustainability practices.
The results also show that simply having AR functionality and social influence is not enough to strengthen an ecotourism destination’s brand for family vacations. Instead, ease of use and strong technological support are perceived as more important by parents. Accordingly, DMOs should focus on promoting AR as an accessible, family-friendly tool rather than a high-tech feature. Promoting seamless user experiences, highlighting intuitive design, and emphasizing reliability in marketing campaigns are crucial areas to attract and engage eco-conscious families. Features such as real-time troubleshooting and offline functionality should be emphasized to reassure families and reduce adoption barriers. Additionally, DMOs should follow strategies that communicate the value of AR-enhanced experiences such as storytelling-driven promotions, influencer partnerships, and family-oriented messages that showcase the effortless usage and benefits of AR in ecotourism.
For AR developers, ensuring usability and reliability is crucial. It is important to make the web AR experience easy to navigate to ensure minimal effort for parents and children. It is also important to create intuitive AR mobile applications and to optimize performance across devices. Finally, residents can collaborate with DMOs and AR developers to identify families’ needs and usage challenges while on vacation. Such insight could ensure that AR mobile applications are easy to use, meaningful, and smoothly integrated into the ecotourism experience.
Limitations and future researchThis study has several limitations. First, the sample size (181 valid responses) may be considered small, which could limit the generalizability of the findings. Second, the research explored only parents’ perceptions, disregarding those of children, which are relevant because family tourism experiences involve joint decisions. Exploring children’s perspectives on AR technology could help ecotourism marketers optimize AR experiences for the whole family. Third, the findings may vary when considering different demographic profiles and geographic regions because the research focused on parents traveling with children to Romanian ecotourism destinations. Fourth, the research used a cross-sectional single study, which captured parents’ perceptions at a single time. Hence, this approach did not allow for comparisons of results at different times as a longitudinal study would have.
Future longitudinal studies should be conducted to compare and validate the findings of this research. Such research could explore whether parents’ attitudes toward AR change over time and could investigate how these changes affect ecotourism destination branding and family behavior in the long run. This research direction would show how long-term AR use affects families’ engagement and satisfaction with ecotourism destinations. Furthermore, cross-cultural research could be performed to evaluate how cultural and geographic differences influence the efficiency of AR technology. Comparative analysis of cultural dimensions would provide insight into how regional practices, infrastructure, and educational programs influence families’ perceptions of AR technology. This approach would generate more focused research outcomes and tailored marketing strategies. Further research could also be conducted to explore potential variations across different tourist demographic profiles and geographic contexts to expand the applicability of the findings. Additionally, research could use neuromarketing experiments to compare AR marketing with traditional marketing in the ecotourism context. Electroencephalography, eye-tracking, and facial emotion analysis could provide deeper insights by offering alternative measures of cognitive and emotional responses in parents and children, thereby further revealing the impact of AR on family ecotourism behavior.
CRediT authorship contribution statementIulian Adrian Sorcaru: Writing – original draft, Resources, Methodology, Investigation, Formal analysis, Data curation, Conceptualization. Adrian Micu: Writing – review & editing, Resources, Investigation, Conceptualization. Gianita Bleoju: Writing – review & editing, Visualization, Project administration, Conceptualization. Angela-Eliza Micu: Visualization, Resources, Project administration, Formal analysis. George Bogdan Dragan: Visualization, Validation, Software, Methodology. Mihaela-Carmen Muntean: Visualization, Supervision, Resources, Project administration. Mark Anthony Camilleri: Visualization, Validation, Supervision.