


Fuzzy-set qualitative comparative analysis (fsQCA) has gained widespread popularity in social science research. However, incorporating the concept of growth—common in business and economic studies—into fsQCA remains unintuitive and methodologically challenging. This study proposes a new approach to systematically integrate growth into fsQCA applications. The method addresses three key challenges: the naming of antecedents and outcomes, the calibration of variables, and the interpretation of results. An empirical analysis demonstrates that the proposed approach offers a more generalized and robust framework for handling both positive and negative growth values. By applying the method, antecedents and outcomes are appropriately named and calibrated, and the resulting solutions are more interpretable and self-explanatory. Ultimately, the method enhances the clarity and accuracy of fsQCA outcomes, reducing the risk of misinterpretation.
This paper proposes a new approach to incorporating the concept of growth into fuzzy-set qualitative comparative analysis (fsQCA). Growth has long been recognized as a critical construct across various disciplines in the social sciences (Canals, 2001; Levine, 2003). Broadly, growth refers to the process of increase or expansion over time. Oxford English Dictionary defines economic growth as the increase in the production of goods and services per head of population over a period of time. Roser (2024) notes that growth is often measured by increases in income or inflation-adjusted GDP per capita. Growth may also reflect rates of change, such as population growth rates, which capture proportional changes in fertility and survival (Sibly & Hone, 2002). Applications of growth concepts are widespread, appearing in studies on economic development, population dynamics, inflation, and beyond.
FsQCA, introduced by Ragin (2000), has emerged as a robust and increasingly popular alternative to conventional statistical techniques. It combines elements of qualitative and quantitative analysis to support nuanced causal inference. Unlike traditional methods, fsQCA focuses on identifying combinations of conditions that lead to specific outcomes, capturing causal asymmetry (Ragin, 2009).
According to Pappas and Woodside (2021), fsQCA integrates foundational ideas from both qualitative and quantitative traditions, while diverging from variance-based approaches. The latter typically analyze variables in isolation, emphasizing net effects. In contrast, fsQCA explores complex, configurational, and asymmetric relationships between antecedents (independent variables) and outcomes (dependent variables). It has gained traction in a variety of domains, particularly in entrepreneurship (Guo et al., 2023; Kusa et al., 2021; Mas-Verdú et al., 2015; Xie et al., 2021) and innovation research (Cheng et al., 2013; Dai & Huang, 2015; Kraus et al., 2017; Yu et al., 2021a; Yu & Huarng, 2023). FsQCA's ability to accommodate theoretical complexity and contextual variation has made it increasingly appealing to researchers (Greckhamer et al., 2018; Rihoux et al., 2013; Schneider & Eggert, 2014).
Given the importance of growth and the growing use of fsQCA in social science research, it is timely and necessary to explore how growth can be meaningfully integrated into fsQCA. However, several key challenges must first be addressed.
Naming antecedents and outcomes. In conventional fsQCA applications, variables are typically positive in value, making it common to label conditions as High or Low. However, growth-related variables often include both positive and negative values, which complicates naming conventions and demands more careful consideration.
Calibration methods. Calibration—the first and most crucial step in fsQCA (Ragin, 2009)—has been handled in previous studies using absolute or relative approaches. While these are effective in certain settings, they may not be appropriate when applied to growth variables, especially when values span both negative and positive ranges.
Interpretation of results. Traditional fsQCA interpretations generally categorize conditions and outcomes as High or Low. When incorporating growth, additional dimensions may be necessary. For instance, while positive GDP growth is generally favorable, a negative growth rate may be preferred when considering crime rates. Thus, the binary High and Low framework may be insufficient. Moreover, existing calibration practices typically treat intermediate (between High and Low) as don’t care, which may not be conceptually valid in the context of growth variables.
Incorporating the concept of growth into fsQCA has the potential to significantly advance methodological development and expand the tool's applicability. This study is the first to systematically address these challenges and propose practical solutions. It aims to extend fsQCA’s analytical scope and enhance its relevance to a wider array of research questions. The remainder of this paper is organized as follows: Section 2 reviews existing literature on calibration methods in fsQCA. Section 3 proposes a novel approach for incorporating the concept of growth into both calibration and interpretation. Section 4 demonstrates how the proposed approach enhances fsQCA application. Section 5 discusses contributions, implications, and limitations. Section 6 concludes this paper.
Literature reviewThis study aims to enhance the application of fsQCA by incorporating the concept of growth. This section reviews relevant literature in three areas: the concept of growth, calibration methods, and the use of growth variables in fsQCA studies.
The concept of growthIn the social sciences, growth is a widely recognized and frequently applied concept (Bond et al., 2010; Ngonghala et al., 2014). It generally refers to an increase in a specific variable over time, typically measured in quantitative terms. The concept of growth spans various disciplines. For instance, economic growth refers to the increase in the economic output of a country or region, often measured by indicators such as Gross Domestic Product (GDP). It serves as a key metric for assessing economic health and improvements in living standards. Population growth measures changes in population size, commonly expressed as a percentage over a given time period.
While growth often implies positive development, this is not always the case. For example, moderate inflation (e.g., 2 % annually) may indicate economic stability, whereas high inflation can signal economic turmoil. In short, growth is context-dependent—its implications can be positive (e.g., development) or negative (e.g., overgrowth or decline), depending on the specific application.
Calibration methodsCalibration is the process of converting raw data into standardized fuzzy-set membership scores, ranging from 1.0 (full membership) to 0.0 (full non-membership), with 0.5 indicating the crossover point or representing an intermediate relationship. Accurate calibration is essential, as it directly affects the validity of fsQCA results. The main calibration methods are described below:
Absolute method: The absolute method uses fixed thresholds for calibration, often applied to data with predefined, bounded ranges (e.g., Likert scales). It assumes that the upper and lower bounds are known in advance and applies thresholds without regard to data distribution. For example, Ordanini et al. (2014) suggest calibrating 7-point Likert-scale data using thresholds of 6 (full membership), 4 (intermediate), and 2 (full non-membership).
However, this method is only appropriate for datasets with fixed, non-negative values. It becomes inapplicable when applied to growth-related data, which often include both positive and negative values.
Relative method: The relative method determines calibration thresholds based on percentiles, making it more adaptable to datasets with varying ranges. For example, the 95th percentile is used for full membership (1.0), the 50th percentile for intermediate (0.5), and the 5th percentile for full non-membership (0.0) (Fiss, 2011; Ragin, 2009).
However, this method assumes that all data values move in the same direction (e.g., uniformly positive or uniformly negative). When the variable includes both positive and negative values, the percentile-based thresholds can lead to misleading interpretations.
Adjustments for Skewness: Pappas et al. (2017) propose adjusting calibration thresholds for skewed distributions. For right-skewed data, they suggest using the 80th percentile for full membership, the 20th percentile for full non-membership, and the 50th percentile as the intermediate. This adjustment aims to prevent results where all the conditions identified as necessary, which can occur when data skewness is ignored (Plewa et al., 2016).
Consider the example: A growth-related antecedent X = {−1.0, −0.8, −0.7, −0.5, −0.3, −0.3, −0.1, 0.0, 0.2, 0.7, 0.7}.
The absolute method is not feasible due to the absence of a fixed range.
Using the relative method, the 50th percentile (i.e., the intermediate point) is −0.3. Consequently, values above −0.3 (e.g., −0.1 or 0.0) are calibrated toward the positive region, which introduces conceptual problems—such as classifying a negative value like −0.1 as indicative of positive growth.
This issue is even more severe when growth is the outcome, as such misclassification can lead to counterintuitive or erroneous interpretations.
While existing methods have been effective in fsQCA applications involving positive-only variables, they are not well-suited for data that include both negative and positive values—a common characteristic of growth-related variables. These limitations are further explored in the next section.
Growth in fsQCA studiesSome fsQCA studies have included growth-related antecedents or outcomes, but most do not address their unique characteristics. Cheng et al. (2022) use fsQCA to evaluate mergers and acquisitions in terms of timing, environment, and human factors. Both antecedents and outcomes are calibrated using the absolute method, because the values for performance growth are all positive. In a study of sales growth, Leischnig et al. (2016) also apply the absolute method to calibrate outcomes derived from survey data, where values (including the values for growth variables) are entirely positive. Chen et al. (2025) investigate how innovation narratives, external conditions, and firm characteristics affect high firm growth. While both the antecedent (innovation distinctiveness) and the outcome (firm growth) include positive and negative values, the study still uses the absolute method—without accounting for the nature of the data.
A few studies apply the relative method to growth-related constructs: Beynon et al. (2020) explore how internal SME strategic factors—such as staffing, training, R&D, and digital presence—affect growth and innovation intentions. Growth is calibrated using the same relative thresholds as other antecedents because all values are positive. Yu et al. (2021b) forecast causal combinations of innovation factors driving economic growth using OECD data. Because the variable used, ln(GDP), contains only positive values, the relative method is appropriate. Huggins et al. (2025) apply fsQCA to study local economic development. The values of the antecedents and the outcome are all positive, justifying their use of the relative method.
An exception is Li et al. (2025), who examine how technological, organizational, and environmental factors influence ESG performance and firm growth. The growth-related antecedent—financial performance—includes both positive and negative values. The financial performance appears in three out of four configurations associated with high ESG performance, raising the possibility that a high score may include negative values—thus producing questionable interpretations.
The new approach for handling growthTo meaningfully incorporate the concept of growth into fsQCA analysis, this study proposes a new methodological framework. The proposed approach consists of four main steps: (1) identifying growth variables, (2) naming antecedents and outcomes, (3) applying a mixed calibration method, and (4) interpreting the results.
Identifying growth variablesThe first step involves identifying all growth-related antecedents and outcomes. In some studies, growth variables are explicitly defined by the researchers, making identification relatively straightforward. In other cases, commonly used variables such as inflation rate or population change inherently represent growth, even if not explicitly labeled as such. Researchers must exercise care in identifying these variables to ensure they are treated appropriately in calibration and analysis.
User-defined growth variables: These are explicitly labeled by the researcher, making their growth-related nature immediately recognizable.
Implicit growth variables: These include widely used indicators such as inflation rate, unemployment rate change, or GDP growth, which inherently reflect growth dynamics and must be treated as such, even if not named accordingly.
Naming antecedents and outcomesProper naming of antecedents and outcomes is critical for both calibration and interpretation. In conventional fsQCA applications, terms such as High and Low are used to describe the calibrated scores of antecedents and outcomes. For example, High economic development (Yu et al., 2016, 2021b); High FinTech adoption (Huarng & Yu, 2022); and High healthcare expenditure countries (Huarng & Yu, 2015).
When the calibrated score reaches full membership, terms like High are applied, while scores close to full non-membership are labeled Low. Intermediate scores (∼0.5) are typically described as don’t care or neither/nor (Feurer et al., 2016; Papadopoulou et al., 2019).
However, growth variables often reflect rates or directional changes (e.g., increase, decline, stability) that are not adequately captured by the binary High/Low convention. Therefore, alternative naming conventions—such as Positive, Negative, or Neutral—are more appropriate for capturing the nuanced implications of growth.
For instance, Positive GDP growth implies economic expansion and improved standards of living. Negative carbon emission growth signals environmental progress. Neutral inflation suggests economic stability.
Naming conventions must reflect the contextual significance of growth in each case to ensure meaningful interpretation throughout the analysis.
The mixed calibration methodCalibration is the process of converting raw data into fuzzy-set membership scores to reflect the degree to which a case belongs to a particular set. As Woodside (2017, p3) emphasizes, “A fuzzy membership score attaches a truth value, not a probability, to a statement.” Accurate calibration is therefore critical—especially when growth variables are involved.
Conventional calibration methods often fall short when growth data include both positive and negative values. To address this limitation, we propose a mixed calibration method that accommodates: entirely positive values, entirely negative values, and mixed positive and negative values.
Steps in the mixed calibration method are listed below:
Case 1: If all values are either positive or negative and the data range is fixed (e.g., Likert scale), use the absolute method.
Case 2: If all values are either positive or negative and the data range is variable (e.g., financial indicators), use the relative method.
Case 3: If values include both positive and negative figures, use zero as the intermediate point (calibrated as 0.5). Positive values are calibrated between 0.5 and 1.0. Negative values are calibrated between 0.0 and 0.5.
This method draws on the absolute method to establish zero as the threshold dividing the Positive and Negative regions.
The key features of the proposed method are
Contextual Neutrality: Establishes zero as a meaningful neutral reference point, improving interpretability when working with mixed growth data.
Dynamic Thresholding: Adjusts thresholds based on actual data distribution, rather than relying on fixed percentiles.
Interpretive Consistency: Ensures that calibrated scores align intuitively with real-world growth meanings. For example, −0.3 would indicate mild negative growth, while 0.3 would reflect mild positive growth.
Interpretation of solutionsIn conventional fsQCA interpretation, solutions typically report only the configurations of antecedents with strong membership (e.g., High) or non-membership (e.g., Low). Antecedents with scores near 0.5—interpreted as intermediate—are often excluded from the analysis and labeled don’t care.
The conventional practice is problematic for growth variables. Intermediate values (e.g., 0.5) may reflect Neutral growth, which can carry significant meaning—such as economic stability or constant inflation. Ignoring such values may lead to oversimplified or misleading interpretations.
Suppose X₁, X₂, and X₃ are antecedents leading to outcome Y. One solution identified is X₁ ∗ X₂ → Y. In this case, X₁ and X₂ are considered causal, while X₃—having an intermediate value—is absent from the expression and is often ignored in interpretation. However, if X₃ represents stable inflation, dismissing it overlooks its potential role in supporting the outcome.
Hence, this study suggests avoiding dismissing intermediate values in growth variables; using domain knowledge to evaluate whether Neutral growth is desirable or meaningful in context; and reframing intermediate growth variables not as don’t care, but as Neutral contributors to stability or equilibrium.
Data and antecedentsTo illustrate the proposed approach, this study draws on data from the Global Sustainable Competitiveness Index (2022). The GSCI assesses a country's performance, development trends, and growth potential across six dimensions: natural capital (NC), resource intensity (RI), social capital (SC), intellectual capital (IC), economic sustainability (ES), and governance (G). The outcome is GSCI score (Sus_C).
To incorporate growth into the analysis, this study modifies the approach used by Yu and Huarng (2025) by replacing GDP per capita with the growth rate of GDP per capita, representing Economic Growth (EG). EG is calculated as follows:
where t = 2022.
All antecedents and the outcome will be calibrated using the proposed mixed calibration method. The next section presents the empirical application and demonstrates how the method enhances fsQCA analysis when dealing with growth-related data.
Empirical analysisThis section demonstrates how the proposed new approach can be applied to incorporate the concept of growth into fsQCA analysis.
Descriptive statisticsThis study utilizes data from The Global Sustainable Competitiveness Index (2022) and GDP per capita data for 2022 from the International Monetary Fund. The analysis covers a total of 168 countries. Table 1 presents sample data for 10 countries, while Table 2 provides the maximum, minimum, and mean values of each antecedent and the outcome. Specifically, the Economic Growth (EG) antecedent is calculated based on Eq. (1).
Part of the data.
Following the proposed method, this study applies fsQCA to analyze Global Sustainable Competitiveness. First, EG is identified as the growth-related antecedent. According to the new method’s guidelines, all antecedents and the outcome are classified as Positive, Negative, or Neutral.
As shown in Table 2, all antecedents and the outcome—except EG—fall under the Positive category. Therefore, we apply the relative calibration method to these variables using the 95th, 50th, and 5th percentile values, as shown in Table 3. These calibrated variables are prefixed with c_ (e.g., c_NC) to indicate their calibrated status.
Calibrated results.
For EG, the mixed calibration method is employed to accommodate both positive and negative values. We set 0 as the threshold for the intermediate membership score of 0.5 (instead of using the median value, as in the relative method). The positive values of EG range from 0.0014 to 0.8907, and the negative values range from −0.0005 to −0.1799. In the positive range, we set the 90th percentile (0.2697) as the threshold for full membership. In the negative range, we set the 10th percentile (−0.0847) as the threshold for full non-membership. The calibrated values of c_EG are also listed in Table 3.
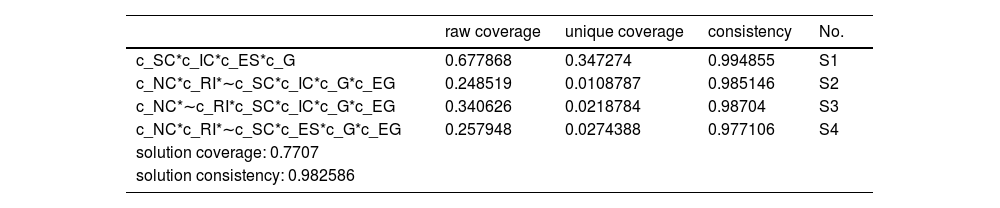
The fsQCA procedure is then conducted. Following Yu and Huarng (2025), first, cases with only a single occurrence are removed. Next, the thresholds are set as follows: raw consistency ≥ 0.80, PRI consistency ≥ 0.70, and SYM consistency ≥ 0.70. The resulting configurations are presented in Table 4, labeled S1 to S4.
Solutions obtained by the mixed method.
To contrast the findings obtained via the new approach, we also apply the conventional relative calibration method to analyze the same dataset. The calibration of all antecedents and the outcome remains consistent with the previous approach. EG values range from −0.1799 to 0.8907, containing both negative and positive values. Under the conventional relative method, the 5th, 50th, and 95th percentiles are −0.0715, 0.0619, and 0.3061, respectively. The resulting calibrated variable is denoted as c_rel_EG. By applying the same fsQCA procedure, we obtain four additional configurations, shown in Table 5 and labeled S5 to S8.
Solutions obtained by the relative method.
Upon reviewing Tables 4 and 5, we note that c_EG is absent in S1 and c_rel_EG is absent in S5. In such cases, EG should be interpreted as representing stable economic growth, rather than being ignored from interpretation, as in conventional practice.
In configurations S2 to S4, EG is Positive, which aligns with the logic of the new method: Positive calibrated values correspond exclusively to positive raw values, and Negative ones to negative values. Similarly, in S7 and S8, EG is also Positive.
However, in configuration S6, EG is classified as Negative (∼c_rel_EG). When we check against the Negative region (−0.0715, 0.0619), Negative calibrated scores may correspond to either positive or negative raw values. As a result, interpreting economic growth in S6 becomes ambiguous. This illustrates a key limitation of the conventional relative method—namely, that it can produce misleading interpretations when growth-related variables include both positive and negative values.
DiscussionTheoretical contributions and implicationsGrowth is a fundamental concept in business and economic studies. However, incorporating it into fsQCA applications presents several challenges. This study proposes a new approach to address these issues—specifically concerning the naming of antecedents and outcomes, their calibration, and the interpretation of analytical results. By resolving these challenges, the proposed approach contributes to the expansion of fsQCA's applicability.
The method is particularly designed to handle antecedents and outcomes involving the concept of growth. The introduction of a mixed calibration method provides a more generalized approach for handling data that include both positive and negative values. From this standpoint, the method offers a practical solution for researchers who wish to apply fsQCA in contexts where growth dynamics are involved.
Limitations and future research directionsCalibration is widely recognized as the most critical step in fsQCA analysis (Ragin, 2009). Various calibration approaches have been developed to accommodate different types of data. The proposed method contributes to this landscape by introducing a mixed calibration technique that sets zero as the intermediate anchor point, and identifies full membership and full non-membership in the positive and negative value ranges, respectively.
Nonetheless, challenges remain regarding how to determine appropriate calibration thresholds for problems with data skewness or specific characteristics of cases (Bley et al., 2024), should be considered to improve calibration accuracy. Future research should aim to further validate the proposed method across diverse datasets and scenarios to enhance its robustness and generalizability.
ConclusionsThis study addresses a significant gap in the application of fsQCA by proposing a new approach to incorporate the concept of growth. While growth is a widely used construct in business and economic research, its integration into fsQCA has been limited due to challenges in naming, calibration, and interpretation—particularly when growth data include both positive and negative values.
The proposed method introduces a systematic approach that includes (1) classifying antecedents and outcomes as Positive, Negative, or Neutral, and (2) applying a mixed calibration method that anchors zero as the intermediate threshold while accounting for full membership and full non-membership in both positive and negative domains. An empirical analysis using global sustainable competitiveness and GDP growth data demonstrates the practical value of the method, highlighting how conventional approaches may lead to misinterpretations when growth is not properly handled.
The contributions of this study are both theoretical and methodological. Theoretically, it expands the scope of fsQCA to include dynamic constructs such as growth. Methodologically, it offers a flexible and transparent calibration framework that enhances the robustness of fsQCA findings.
Despite its contributions, this study also acknowledges limitations, particularly in setting context-sensitive calibration thresholds. Future research is encouraged to refine the mixed calibration approach and explore its application across diverse empirical contexts, ultimately contributing to more nuanced and accurate configurational analyses in the social sciences.
CRediT authorship contribution statementKun-Huang Huarng: Writing – original draft, Software, Investigation, Formal analysis, Data curation. Tiffany Hui-Kuang Yu: Writing – original draft, Validation, Methodology, Investigation, Conceptualization.
The authors are very grateful to National Science and Technology Council, Taiwan, (R.O.C.) for the financial support under project NSTC 114-2410-H-141-017-MY1.