
In this paper we propose an index to measure the state of health of the 28 countries of the European Union.
Material and methodsUsing the Principal Components Analysis method, we construct the European Health Index as a combination of six dimensions: (1) Working conditions, (2) General state of health, (3) Health system, (4) Quality of Life, (5) Mental health and drug abuse, and (6) Risk health factors, that are in turn made up of 29 distinct variables.
ResultsWe find the Netherlands, Denmark, Sweden and Ireland in the first four positions, and Estonia, Lithuania, Poland and Bulgaria at the end of the ranking. Within the European Union, two blocks stand out above the rest, the ex-soviet countries and northern Europe.
ConclusionThe European Health Index could be used to assist public policies designed to improve health perception in regions where it is needed.
En este artículo proponemos un índice para medir el estado de salud de los 28 países de la Unión Europea.
Material y métodosUsando el método de Análisis de Componentes Principales, construimos el Índice de Salud Europeo (ISE) como una combinación de 6 dimensiones: (1) Condiciones de trabajo, (2) Estado general de salud, (3) Sistema de salud, (4) Calidad de vida, (5) Salud mental y abuso de drogas, y (6) Factores de riesgo para la salud, que a su vez se componen de 29 variables distintas.
ResultadosEncontramos a los Países Bajos, Dinamarca, Suecia e Irlanda en las primeras 4 posiciones, y Estonia, Lituania, Polonia y Bulgaria al final del ranking. Dentro de la Unión Europea, 2 bloques destacan sobre el resto, los países exsoviéticos y el norte de Europa.
ConclusiónEl Índice de Salud Europeo podría usarse para ayudar a las políticas públicas diseñadas para mejorar la percepción de la salud en las regiones donde se necesita.
Health is one of the pillars of the welfare state and is the responsibility of each of the countries that make up the union, so the EU's role in health is to complement national policies and promote cooperation.1 With this objective in mind, the European Commission has designed a Health Strategy based on five fundamental points: Prevention, by promoting healthier habits; Procure a universal health care; Quality of life during old age2; Coordinate the fight against epidemics3; Research and improvement of the quality of systems with new technologies.4
However, the index we propose in this paper is not limited only to the points that are addressed in the European strategy. Since health is a national competence, there are several points of divergence between the different countries not addressed by the EU. It is an interesting point to analyze the fact of obtaining better or worse results according to each system, thus measuring the efficiency of public expenditure on health in each country.
In the remainder of the paper, an introduction for the creation of the index is presented in Section 1. Section 2 presents the data and method used to compose the index. Section 3 presents the results and finally Section 4 discussion and conclusions.
The creation of indexes is a technique used in several studies of public institutions and international organizations. However, most of the studies of this type published up to now, do not usually include this global result once the indicators have been weighted, but simply individually compare the set of indicators. The Organization for Economic Cooperation and Development (OECD) is one of the international organizations that elaborates indices by compiling numerous indicators to compare among its member countries the status of certain subjects and to determine which policies are more or less successful, according to the results they show. In recent years, they have developed indexes on subjects such as Education at a Glance (2017), good governance Government at a Glance (2017), Entrepreneurship at a Glance (2017), Society at a Glance (2016) and finally Health at a Glance (2017).
In addition, the OECD monitors the subjects studied, repeating the development of these indices periodically to see if there are developments or trends and analyze their causes. For example, the oldest available educational index is from 2004 Education at a Glance (2004) and the most current from 2017 Education at a Glance (2017), so that the results of the policies implemented during those years can be analyzed, which the results have been and that countries have made improvements and which are getting worse.
One of the innovations introduced in this type of publication is found in the OECD Better Life Index (2017) index where a global ranking is made and, unlike our work, the weighting of the indicators is not static but can be modified. By making these parameters dynamic variables, the result of the index will depend on the valuation made of each indicator. This index is composed of 11 different dimensions among which are housing, income and health.
Although there are similitudes, the index proposed here has some differences with the one proposed by the OECD. The first difference is about how to achieve the comparison between the different countries. On one hand, Health at a Glance compares the countries based on the difference in each of the indicators with their own conclusions for each block. In this paper, however, what is sought is to reach global conclusions on the health status of each country based on the results of each block, that is, from the disaggregated results, and then to be able to draw a final conclusion on the global health state. The second point is the depth of the work, in Health at a Glance, the data are distributed in nine blocks, with a number of indicators rather larger for each block, while in this paper there are six blocks with 29 indicators in total. This difference is justified in the way in which the conclusions are written, as we have just commented, we pursue some general conclusions about each country while in the previous one the conclusions are presented in a more granular way on each block.
MethodWe construct the European Health Index (EHI) as a combination of six dimensions: Working conditions, General state of health, Health system, Quality of life, Mental health and drug abuse, and Risk health factors, that are in turn made up of 29 distinct variables.
- -
Working conditions
The variables to be incorporated in this dimension are:
- -
General state of health
Here we broadly define the main characteristics that define the health of the inhabitants of a country. The variables to be incorporated in this dimension are:
- •
Number of avoidable deaths8 (source: Eurostat)
- •
Number of death due to infectious diseases (source: Eurostat)
- •
Ratio of deaths due to cancer per 100,000 individuals (source: Eurostat)
- •
Ratio of child mortality <1 year (source: Eurostat)
- •
Percentage of children <1 year vaccinated against poliomyelitis (source: WHO)
- •
Deaths due to HIV per 100,000 individuals9 (source: Eurostat)
- •
- -
Health system
The variables to be incorporated in this dimension are:
- •
Percentage of people that do not go to the hospital when needed10 (source: Eurostat)
- •
Ratio of number of beds available in health system (source: Eurostat)
- •
Ratio of doctors per 100,000 individuals (source: WHO)
- •
Radiotherapy units per million individuals (source: WHO)
- •
Health expenses as a percentage of GDP per capita11 (source: WHO)
- •
- -
Quality of life
The variables to be incorporated in this dimension are:
- •
Healthy life expectative12 (source: WHO)
- •
Percentage of people in poverty risk (source: Eurostat)
- •
Percentage of people that think their health is good or very good13 (source: Eurostat)
- •
Mortality ratio due to chronic diseases14 (source: Eurostat)
- •
Accidental deaths due to chemical exposure (source: WHO)
- •
- -
Mental health and drug abuse
The variables to be incorporated in this dimension are:
- •
Percentage of people with depression (source: Eurostat)
- •
Suicide Ratio per 100,000 individuals (source: WHO)
- •
Beds in psychiatric hospitals per 100,000 individuals (source: Eurostat)
- •
Drug related deaths per million of individuals15 (source: WHO)
- •
Dementia (and Alzheimer) related deaths (source: Eurostat)
- •
- -
Risk health factors
The variables to be incorporated in this dimension are:
For the construction of the European Health Index, Principal Component Analysis (hereinafter referred to as PCA) will be used for variable and weight choice, methodology described in the OECD handbook.23 PCA is a statistical technique that allows the extraction of significant data from a multivariate table and its later representation as a set of main components. These new components correspond to a linear combination of the previous variables and are constructed according to the order of importance in terms of the total variability that they collect from the sample. It is a widely used method in the literature.24–28
The objectives of this method are:
- (a)
Reduce the dimensionality of multivariate data to fewer main components than the number of original variables.
- (b)
Eliminate redundant information by reducing the impact of information redundancy as it does not take into account the accumulation of covariance among primitive variables.
- (c)
Capture in the new components part of the total variance, with a minimum loss of information, assuring the maximum discriminating power between them.
One of the requirements for a correct application of PCA is that variables must be measured on the same scale. There are several methods for normalizing data, such as the range of observations, standardization, distance from or to a reference, or by means of indicators below or above the mean.23 We select standardization as the method of normalization, which uses the variable's z-scores. By using the mean (μ) and standard deviation (σ) of the variables, we find the “z-scores” value, according to Z=(X−μ)/σ (‘x’ is the value of the variable).
Following Spector,29 the number 3 is established as a minimum of variables per dimension, taking into account that 3 elements by category must be seen as a minimum, not as optimal. All established groups have at least 3 elements, so this restriction is met.
To assign weights to the variables, we identify the main components for every dimension. Several criteria exist to pick the number of components, according to OECD,23 are applied together:
- 1.
Those that have their own values (or self-values) associated >1.
- 2.
Those that individually provide an explained variance of more than 10%.
- 3.
Those presenting an accumulated explained variance >60% of the total explained variance.
The number of dimensions is six: Public health, Education, Employment and incomes, Environment, Gender equality, Leisure and entertainment, Housing and safety, and Transport and mobility.
Secondly, the factor loads given by the PCA (through the matrix of components rotated) are used to allocate the variables to each component by the highest absolute value of the factor load.
Thirdly, following the OECD23 in its calculation of the index, a matrix is constructed with the squared factor load value. Then, all factors are added to the square of each component and the squared factor loads are divided over the sum. This results in the indicator's percentage of the total unit variance.
As a final step, using the proportion of the variation that every component can account for, we corrected the squared factor loads of the variables, thus obtaining the ultimate variable weight.
Once we have weighted these results, we proceed to the construction of the ranking in the following way, multiplying each of the weights by the standardized value that each indicator has in a given country. We must bear in mind that the weights must have a sign assigned according to the effect they produce, in this work we will assign negative weights to those that produce harmful effects on health and positive to those that are beneficial for the health of the inhabitants.
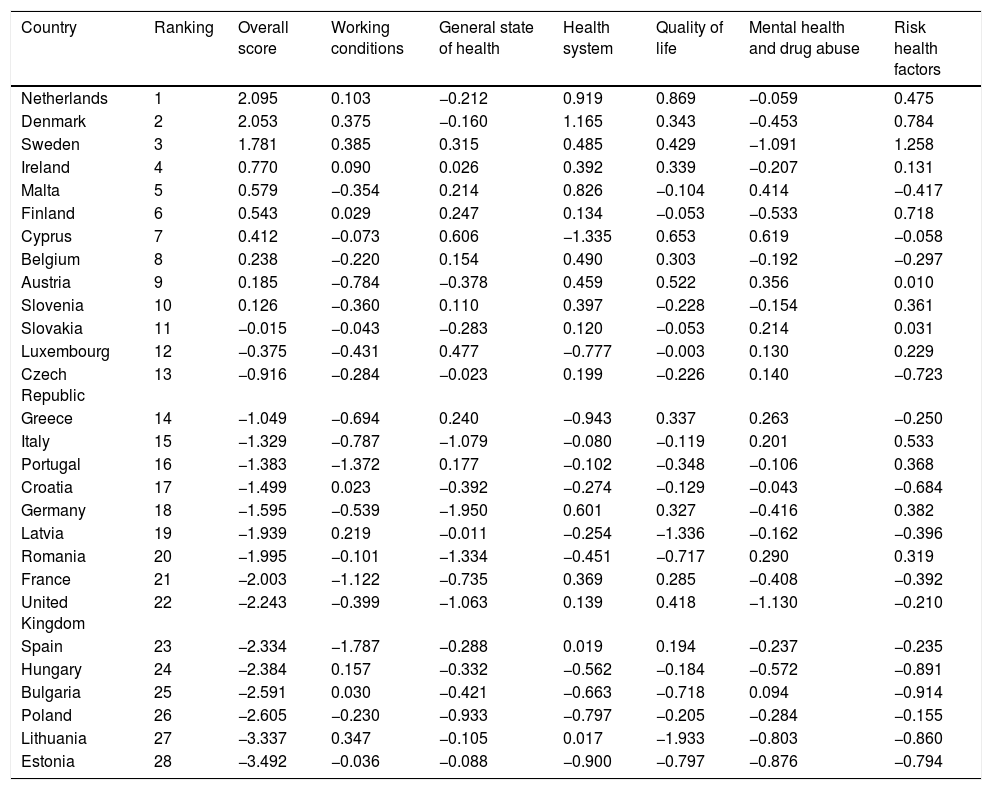
ResultsThe overall results of the ranking, the score and the value for each country on every dimension can be seen in Table 1.
Ranking of countries for the European Health Index (EHI).
| Country | Ranking | Overall score | Working conditions | General state of health | Health system | Quality of life | Mental health and drug abuse | Risk health factors |
|---|---|---|---|---|---|---|---|---|
| Netherlands | 1 | 2.095 | 0.103 | −0.212 | 0.919 | 0.869 | −0.059 | 0.475 |
| Denmark | 2 | 2.053 | 0.375 | −0.160 | 1.165 | 0.343 | −0.453 | 0.784 |
| Sweden | 3 | 1.781 | 0.385 | 0.315 | 0.485 | 0.429 | −1.091 | 1.258 |
| Ireland | 4 | 0.770 | 0.090 | 0.026 | 0.392 | 0.339 | −0.207 | 0.131 |
| Malta | 5 | 0.579 | −0.354 | 0.214 | 0.826 | −0.104 | 0.414 | −0.417 |
| Finland | 6 | 0.543 | 0.029 | 0.247 | 0.134 | −0.053 | −0.533 | 0.718 |
| Cyprus | 7 | 0.412 | −0.073 | 0.606 | −1.335 | 0.653 | 0.619 | −0.058 |
| Belgium | 8 | 0.238 | −0.220 | 0.154 | 0.490 | 0.303 | −0.192 | −0.297 |
| Austria | 9 | 0.185 | −0.784 | −0.378 | 0.459 | 0.522 | 0.356 | 0.010 |
| Slovenia | 10 | 0.126 | −0.360 | 0.110 | 0.397 | −0.228 | −0.154 | 0.361 |
| Slovakia | 11 | −0.015 | −0.043 | −0.283 | 0.120 | −0.053 | 0.214 | 0.031 |
| Luxembourg | 12 | −0.375 | −0.431 | 0.477 | −0.777 | −0.003 | 0.130 | 0.229 |
| Czech Republic | 13 | −0.916 | −0.284 | −0.023 | 0.199 | −0.226 | 0.140 | −0.723 |
| Greece | 14 | −1.049 | −0.694 | 0.240 | −0.943 | 0.337 | 0.263 | −0.250 |
| Italy | 15 | −1.329 | −0.787 | −1.079 | −0.080 | −0.119 | 0.201 | 0.533 |
| Portugal | 16 | −1.383 | −1.372 | 0.177 | −0.102 | −0.348 | −0.106 | 0.368 |
| Croatia | 17 | −1.499 | 0.023 | −0.392 | −0.274 | −0.129 | −0.043 | −0.684 |
| Germany | 18 | −1.595 | −0.539 | −1.950 | 0.601 | 0.327 | −0.416 | 0.382 |
| Latvia | 19 | −1.939 | 0.219 | −0.011 | −0.254 | −1.336 | −0.162 | −0.396 |
| Romania | 20 | −1.995 | −0.101 | −1.334 | −0.451 | −0.717 | 0.290 | 0.319 |
| France | 21 | −2.003 | −1.122 | −0.735 | 0.369 | 0.285 | −0.408 | −0.392 |
| United Kingdom | 22 | −2.243 | −0.399 | −1.063 | 0.139 | 0.418 | −1.130 | −0.210 |
| Spain | 23 | −2.334 | −1.787 | −0.288 | 0.019 | 0.194 | −0.237 | −0.235 |
| Hungary | 24 | −2.384 | 0.157 | −0.332 | −0.562 | −0.184 | −0.572 | −0.891 |
| Bulgaria | 25 | −2.591 | 0.030 | −0.421 | −0.663 | −0.718 | 0.094 | −0.914 |
| Poland | 26 | −2.605 | −0.230 | −0.933 | −0.797 | −0.205 | −0.284 | −0.155 |
| Lithuania | 27 | −3.337 | 0.347 | −0.105 | 0.017 | −1.933 | −0.803 | −0.860 |
| Estonia | 28 | −3.492 | −0.036 | −0.088 | −0.900 | −0.797 | −0.876 | −0.794 |
We find the Netherlands, Denmark, Sweden and Ireland in the first four positions; and Estonia, Lithuania, Poland and Bulgaria at the other end of the group. Within the European Union, two blocks stand out above the rest, the ex-soviet countries (Lithuania and Estonia have the worst rankings) and northern Europe (Denmark and Sweden are considered Nordic states and have the best scores together with Netherlands).
We are going to begin the analysis of the results, commenting first on the characteristics of the countries that have obtained the best results. The Netherlands is the country that obtains the highest score (2.095), obtains a result above the community average for the six existing dimensions and stands out in quality of life (first place) and health systems (second place). Denmark is number two in the overall ranking and in the dimensions working conditions and risk health factors, while is number one in the health system dimension.
Sweden is a case worthy of analysis. It is ranked third in the overall score and is top three in half of the dimensions (top one in working conditions and in risk health factors, and top three in general state of health). However, it ranks 27° out of 28 countries in the dimension of mental health and drug abuse. This result could be explained with many factors. First, there are a high number of people who have suffered symptoms of depression (9.2%), against a European average of 5.7%. Furthermore, Sweden has more than 100 deaths related to drug addiction per million inhabitants per year being one of the highest rates in the entire EU; finally, the number of suicides is quite high 12.7 per 100,000 inhabitants, exceeding by more than two percentage points the European average that is in 10.14. Therefore, its good position in the overall ranking is explained because of other dimensions’ good results (e.g. risk health factors where it obtains more than double the score of the Netherlands, the leader of overall ranking).
Now we are going to continue the analysis with the countries that obtain the worse results. This group is headed by Estonia that obtains the worst result (−3.49) of the 28 countries that form the EU, followed by Lithuania (−3.34), Poland (−2.61) and Bulgaria (−2.59). Surprisingly Estonia, ranks last but does not get the worst result for any specific dimension. It is in the bottom three for half of the dimensions (health system, quality of life and mental health and drug abuse).
Spain is also noteworthy, obtaining a low position in the index (23°) because of working conditions and risk health factors. The high rate of long-term unemployment and a high number of accidents at work cause Spain to obtain the worst result of all the countries analyzed. On the other hand, Spain has one of the highest life expectancies in the world; however, this makes the population more aged causing many indicators to be negatively impacted by the more delicate state of health of the population of a more advanced age.
On the other hand, we observe that the dimension referring to mental health and drug abuse penalizes in a notable way countries with good results in other dimensions. For example, countries such as France (21°), Germany (18°) and the United Kingdom (22°) are also at the bottom of Table 1.
Particularly noteworthy is the poor management of health risk factors, Eastern European countries have the worst results in alcohol consumption and some of the highest percentages of smoking in the EU. For example, Bulgaria has the highest smoking rate of the entire European community 28.20%, Estonia 23.5%, Poland 22.7% and Lithuania 20.4%.
On the other hand, the highest alcoholism rates in the EU are also among these countries, with Lithuania being the country with the highest consumption of alcoholic beverages, reaching 15.19L of alcohol per person per year. In addition to all this, access to safe sanitation is considerably lower than in the rest of the EU, in Estonia 18% of the population does not have access to fully safe and potable water sources.
The bottom two countries for the overall ranking are Baltic states (Lithuania and Estonia), while for working conditions the worst three countries are from western Europe (France, Portugal and Spain). It is noteworthy that for the quality of life dimension, the bottom three countries are the Baltic states of the European Union (Latvia, Lithuania and Estonia).
DiscussionThe countries located in Eastern Europe follow a similar pattern in general, this group consisting of six countries: Romania, Lithuania, Latvia, Estonia, Poland and Bulgaria. They are traditionally poorer countries than the countries of Western Europe and with relatively young democracies since they were subjected to communist regimes after the Second World War. They have experienced very high economic development in recent years as a result of economic liberalization and their integration into the EU. Mainly these countries present major problems in the control of risk factors for health mainly in alcoholism and tobacco presenting rates above the community average.
The countries that obtain the best results in the index are Northern European countries, this group that include the Netherlands, Sweden, Denmark or Finland. These countries have common characteristics such as high purchasing power, high quality of life, strong health systems (public or private) and health risk factors at levels lower than the European average.
The bottom two countries for the overall ranking are Baltic states (Lithuania and Estonia), while for working conditions the worst three countries are from western Europe (France, Portugal and Spain). It is noteworthy that for the quality of life dimension, the bottom three countries are the Baltic states of the European Union (Latvia, Lithuania and Estonia).
Conflict of interestsThe authors declare no conflict of interest.
This paper was partially written while Jose Maria Fernandez-Crehuet was Visiting Fellow at Harvard University, to which he would like to express his thanks for the hospitality and facilities provided. This paper has benefited from funding from FONDECYT, Chile (Grant 11180337).