

To analyse trends in the use of diagnostic test in breast cancer screening programs in Spain.
Materials and methodsRetrospective study of 542,695 women who had undergone at least one screening mammogram in any of the screening centres of three administrative regions in Spain, between 1996 and 2011. Process measures were: overall recall rate, overall invasive test rate, and rates of each type of invasive test (fine-needle aspiration biopsy, core-needle biopsy and surgical biopsy). As results measures were included detection of benign lesions rate, ductal in situ cancer rate and invasive cancer rate. Adjusted by age rates were estimated year by year for each measure and, also, the annual percent of change and its corresponding joint points.
ResultsCore-needle biopsy rates decreased between 1996 and 1999 and changed trends in 1999–2011 with an increase of 4.9% per year. Overall recall rate declined by 4.6% from 1999 to 2004, invasive test rate declined between 1996 and 2004 by 24.3%. Fine-needle aspiration biopsy rate changes were: a 22.4% declined per year (1996–1998), and 13.5% declined per year (1998–2005). Benign lesions rate decreased from 1996 to 2011, 21.4% per year (1996–2001) and 6.0% (2001–2011). Ductal carcinoma in situ and invasive cancer had no-statistically significant changes.
ConclusionThe introduction of core-needle biopsy was slow and not concurrent with the reduction in the use of other diagnostic tests, but also represented a reduction in the rate of overall diagnostic tests and in the detection rate of benigns lesions without affecting the cancer detection rates.
Analizar tendencias en el uso de pruebas diagnósticas en los programas poblacionales de cribado del cáncer de mama en España.
Materiales y métodosEstudio retrospectivo de 542.695 mujeres que habían sido sometidas al menos a una mamografía de cribado en tres regiones administrativas en España, entre los años 1996 y 2011. Medidas de proceso: tasa de recitación, tasa de realización de pruebas invasivas y tasas de cada tipo de prueba invasiva (punción-aspiración con aguja fina, biopsia con aguja gruesa y biopsia quirúrgica).
Medidas de resultadotasa de detección de lesiones benignas, carcinoma ductal in situ y cáncer invasivo. Se estimaron tasas ajustadas por edad, porcentaje anual de cambio y sus correspondientes puntos de inflexión.
ResultadosLa tasa de realización de biopsia con aguja gruesa disminuyó entre 1996 y 1999, y posteriormente aumentó un 4,9% por año. La tasa de recitación disminuyó un 4,6% (1999 y 2004), la tasa de realización de pruebas invasivas disminuyó un 24,3% (1996 y 2004). Las tasas de punción-aspiración con aguja fina disminuyeron un 22,4% por año (1996-1998) y un 13,5% (1998-2005). La tasa de detección de lesiones benignas disminuyó de 1996 a 2011: 21,4% por año (1996-2001) y 6,0% (2001-2011). Las tasas de detección de cáncer no se modificaron.
ConclusiónLa introducción de la biopsia con aguja gruesa fue lenta y no concurrente con el uso de otras pruebas diagnósticas, aunque sí hubo una reducción en la utilización de las mismas y de la tasa de detección de lesiones benignas, sin afectar la detección de cáncer.
The process of adoption of medical innovations may make differences in health results due to variations in the introduction, diffusion and acceptance of new practices. We have tried to explore the process of adoption of technologies, based on the introduction of the core-needle biopsy (CB) in population-based breast cancer screening programs in Spain.
Breast cancer diagnosis in population based screening context is challenging; the increased availability of population-based screening programs for breast cancer has been associated with a reduction in mortality of between 25% and 35% depending on the analysis methodology used.1–3 Women involved in breast cancer screening are a risk of overdiagnosis, overassessment or overtreatment, as well as underdiagnosis, underassessment or undertreatment.4
The standard for assessing breast lesions that are suspected of being malignant is the CB.5 Women with histopathologically confirmed breast cancer receive treatment and are included in specific follow-up protocol, that does not include further screening.6
The use of CB, introduced in 1990s,7 is not widespread in Europe8,9 and the effect of its introduction into the workup of lesions found in population-based screening programmes for breast cancer has not been analysed in Spain.
Compared with surgical biopsy (SB) the benefits of CB include lowered risk of disfigurement, shorter recovery time, lower incidence of complications, and lower immediate costs. Diagnosing the nature of non-palpable mammographic lesions that are suspected of being malignant by preoperative CB facilitates a more efficient diagnostic workup.10 In women with calcifications highly suggestive of malignancy, it has been shown that the use of stereotactic biopsy rather than SB decreases the number of procedures required.11 Because 60–90% of biopsies for mammographic lesions result in benign diagnoses that require no follow-up treatment, minimally invasive procedures that establish a definite diagnosis with minimal associated adverse effects are preferable.12
Other reasons for avoiding SB are that it creates unnecessary psychological distress in subjects with lesions that turn out to be benign, and the resultant scarring can complicate interpretation of subsequent mammograms.13–18 Thus, CB rather than SB should be used for histological confirmation of a radiologically suspicious or malignant lesion: they facilitate preoperative planning,19 and are associated with a lower likelihood of multiple breast surgeries.20
The objective of this paper was to analyse the timing of introduction of CB and others invasive test or diagnosed lesion in one cohort of women screened between 1996 and 2011.
MethodsThis time trends study included a retrospective cohort of 542,695 women who had undergone at least one screening mammogram between 1996 and 2011. In all, the study subjects had undergone 1,763,810 screening examinations in any of the screening centres of three administrative regions (Asturias, Cantabria and Catalonia), covering 21% of women explored in Spain in 2009.21
SettingIn Spain, a government-funded Breast Cancer Screening Program provides free biannual breast cancer screening to all women aged from 50 to 69 years. This programme started in 1990 and it was gradually implemented thereafter in different regions, becoming nationwide in 2000. It is conducted in accordance with the recommendations of the European Guidelines for Quality Assurance in Breast Cancer Screening and Diagnosis.6
Each of the 17 administrative regions in Spain is responsible for the programme in its jurisdiction and has several mammography units for screening. The same epidemiological criteria and screening test criteria are used by all of them. However, there are a high variability among programmes in the subsequent diagnostic workup of patients with detected abnormalities.22
The standard procedure for screening is biennial mammography with double projection (mediolateral-oblique and craniocaudally views) and double reading with consensus or arbitration, using the Breast Imaging-Reporting and Data System (BIRADS) scale to rate the probability of cancer.23 When a mammographic abnormality (equivalent to BIRADS 0, 3, 4, or 5) is detected, women are recalled for further diagnostic workup, comprising additional imaging and/or biopsy by a variety of procedures, including percutaneous fine-needle aspiration biopsy (FNAB), CB and SB. If cancer is not confirmed, participants are asked to resume regular screening two years later. For mammogram findings classified as BIRADS 3, alternative procedure is repeat mammography at shorter interval.
Sources of information, measures and definitionsA unique data base was constructed in which each episode of screening and its outcome was individually recorded. Characteristics of the cohort have been previously described.13
Benign lesions and invasive cancer, as well as ductal carcinoma in situ (DCIS), diagnosed as a result of screening, were identified from the information system of the screening programmes included.
Process and results measures were analyzed. As process measures, overall recall rate, overall invasive test rate were estimated, we also calculated the rate for each type of biopsy (FNAB rate, CB rate and SB rate). Result measures included were rates of detection of benign lesions, DCIS and invasive cancer.
The overall recall rate was defined as the number of women recalled for further assessment per 1,000 women who had undergone a screening examination. The overall invasive test rate was defined as the overall number of biopsies (FNAB, CB and SB) per 1,000 screening examinations. The rates of detection of benign lesions, DCIS and invasive cancer (IC) were expressed as the number per 1,000 screening examinations.6
Statistical analysisAdjusted rates to European Population by age (per 1,000) and their corresponding 95% confidence intervals (95% CI) were estimated year by year. Trends in diagnosis test rates and detection rates were analyzed based on the annual percent change (ACP) of the incidence rates, using JoinPoint Regression The software used was the JoinPoint Regression Program.24 It takes trend data (e.g. cancer rates) and fits the simplest joinpoint model that the data allow. The user supplies the minimum and maximum number of joinpoints. The program starts with the minimum number of joinpoint (e.g. 0 joinpoints, which is a straight line) and tests whether more joinpoints are statistically significant and must be added to the model (up to that maximum number). This enables the user to test that an apparent change in trend is statistically significant. The tests of significance use a Monte Carlo Permutation method. The models may incorporate estimated variation for each point (e.g. when the responses are age adjusted rates) or use a Poisson model of variation. In addition, the models may also be linear on the log of the response (e.g. for calculating annual percentage rate change). The software also allows viewing one graph for each joinpoint model, from the model with the minimum number of joinpoints to the model with maximum number of joinpoints.25 The ACP describes the rate of increase or decrease in rates per unit of time. We also analyzed the joint point in the study period. In this study, the maximum and minimum segments were free (not established).
The study protocol was approved by the institutional review boards at all participating institutions. Informed consent was not required because our analysis was based on anonymous retrospective data.
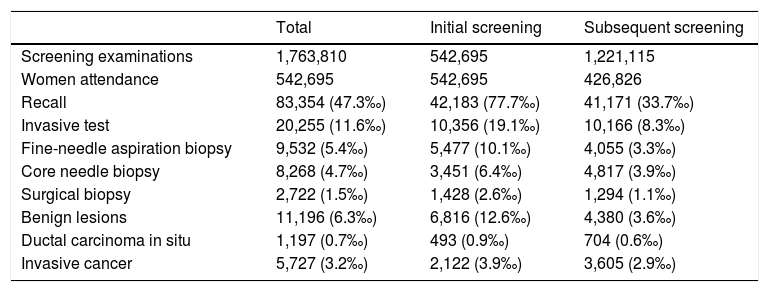
ResultsThe overall recall rate for additional examinations was 47.3 per 1,000 screening examinations (83,354); the biopsy test rate was 11.6 per 1,000 screening examinations (20,255). The most frequently performed biopsy was FNAB, with a rate of 5.4 per 1,000 examinations, CB was performed in 4.7 per 1,000 and SB in 1.5 per 1,000. All tests were more frequently performed following the initial screening than following subsequent screening. They were diagnosed 5,727 IC, 1,197 DCIS and 11,196 benign lesions. Characteristics of the study cohort, by initial or subsequent screening, are shown in Table 1. The percentage distribution of the invasive tests was in 1996 of 60% for the FNAC, 31% for the CB and 9% for the SB, while in 2011 the FNAC represented 39% of all the invasive tests, the CB 51% and the SB 10%.
Cohort of screened women with description of diagnosis workup and detected lesions. Absolute numbers and rate per 1000 screening examinations (1996–2011).
| Total | Initial screening | Subsequent screening | |
|---|---|---|---|
| Screening examinations | 1,763,810 | 542,695 | 1,221,115 |
| Women attendance | 542,695 | 542,695 | 426,826 |
| Recall | 83,354 (47.3‰) | 42,183 (77.7‰) | 41,171 (33.7‰) |
| Invasive test | 20,255 (11.6‰) | 10,356 (19.1‰) | 10,166 (8.3‰) |
| Fine-needle aspiration biopsy | 9,532 (5.4‰) | 5,477 (10.1‰) | 4,055 (3.3‰) |
| Core needle biopsy | 8,268 (4.7‰) | 3,451 (6.4‰) | 4,817 (3.9‰) |
| Surgical biopsy | 2,722 (1.5‰) | 1,428 (2.6‰) | 1,294 (1.1‰) |
| Benign lesions | 11,196 (6.3‰) | 6,816 (12.6‰) | 4,380 (3.6‰) |
| Ductal carcinoma in situ | 1,197 (0.7‰) | 493 (0.9‰) | 704 (0.6‰) |
| Invasive cancer | 5,727 (3.2‰) | 2,122 (3.9‰) | 3,605 (2.9‰) |
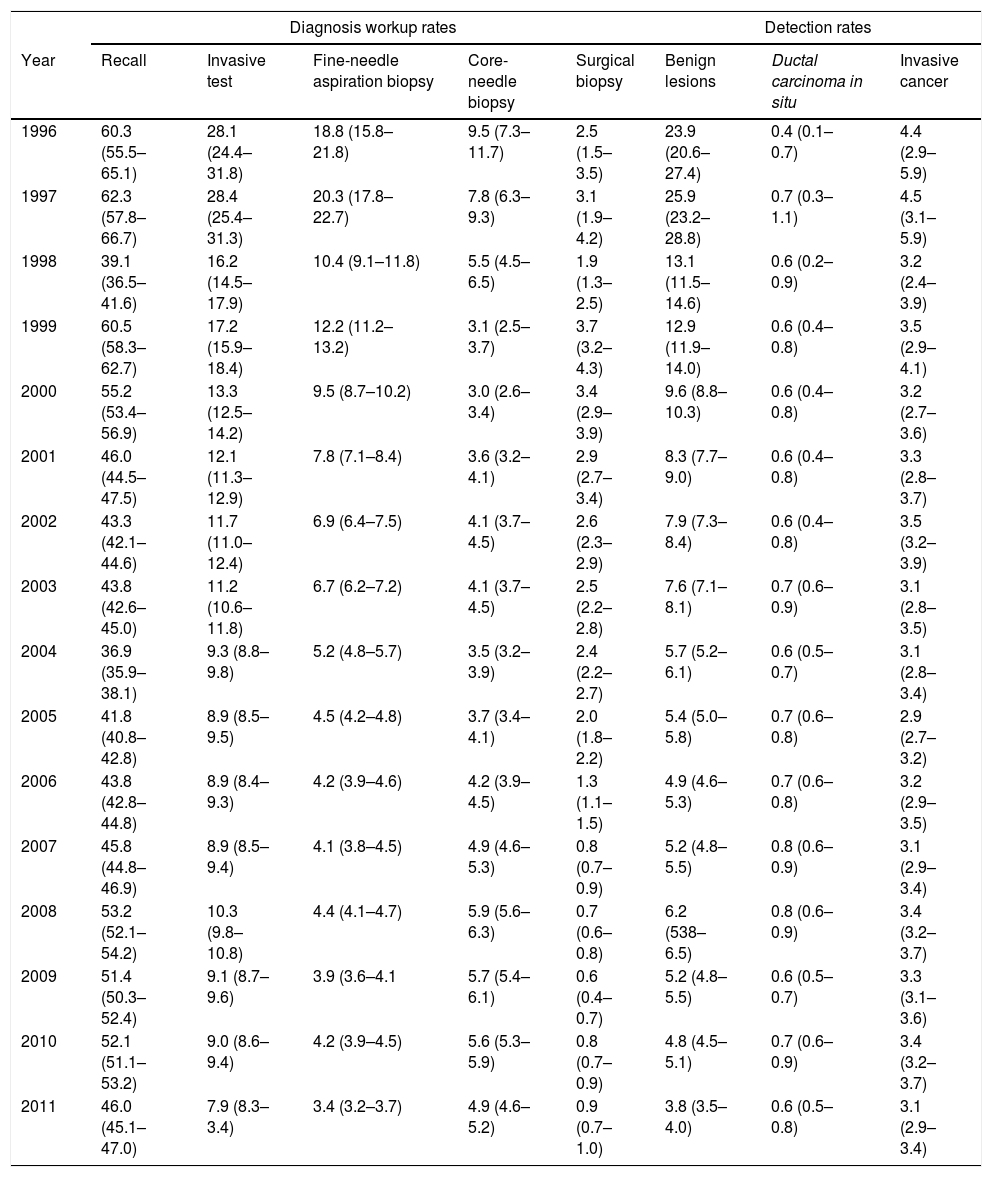
Table 2 and Fig. 1 present year-to-year age adjusted rates of overall recall, overall invasive test and by subtypes (FNAB, CB, and SB), and of benign lesions, DCIS and invasive cancer. Overall recall rates decreased in the period of study, being 60.3‰ and 46.0‰ in 1996 and 2011, respectively. The overall biopsy rate decreased from 28.1‰ in 1996 to 7.9‰ in 2011. The rates of every types of biopsy fell progressively, with the exception of CB; the lowest rate for CB was in 2000 (Rate=3.0‰, 95% CI: 2.6–3.4) the year in which widespread screening programmes began, and the rate stabilized in 2008 (Rate=5.9‰, 95% CI: 5.6–6.3).
Age adjusted rates of diagnostic workup and lesions detected per 1000 breast screening examinations and 95% CI (1996–2011).
| Diagnosis workup rates | Detection rates | |||||||
|---|---|---|---|---|---|---|---|---|
| Year | Recall | Invasive test | Fine-needle aspiration biopsy | Core-needle biopsy | Surgical biopsy | Benign lesions | Ductal carcinoma in situ | Invasive cancer |
| 1996 | 60.3 (55.5–65.1) | 28.1 (24.4–31.8) | 18.8 (15.8–21.8) | 9.5 (7.3–11.7) | 2.5 (1.5–3.5) | 23.9 (20.6–27.4) | 0.4 (0.1–0.7) | 4.4 (2.9–5.9) |
| 1997 | 62.3 (57.8–66.7) | 28.4 (25.4–31.3) | 20.3 (17.8–22.7) | 7.8 (6.3–9.3) | 3.1 (1.9–4.2) | 25.9 (23.2–28.8) | 0.7 (0.3–1.1) | 4.5 (3.1–5.9) |
| 1998 | 39.1 (36.5–41.6) | 16.2 (14.5–17.9) | 10.4 (9.1–11.8) | 5.5 (4.5–6.5) | 1.9 (1.3–2.5) | 13.1 (11.5–14.6) | 0.6 (0.2–0.9) | 3.2 (2.4–3.9) |
| 1999 | 60.5 (58.3–62.7) | 17.2 (15.9–18.4) | 12.2 (11.2–13.2) | 3.1 (2.5–3.7) | 3.7 (3.2–4.3) | 12.9 (11.9–14.0) | 0.6 (0.4–0.8) | 3.5 (2.9–4.1) |
| 2000 | 55.2 (53.4–56.9) | 13.3 (12.5–14.2) | 9.5 (8.7–10.2) | 3.0 (2.6–3.4) | 3.4 (2.9–3.9) | 9.6 (8.8–10.3) | 0.6 (0.4–0.8) | 3.2 (2.7–3.6) |
| 2001 | 46.0 (44.5–47.5) | 12.1 (11.3–12.9) | 7.8 (7.1–8.4) | 3.6 (3.2–4.1) | 2.9 (2.7–3.4) | 8.3 (7.7–9.0) | 0.6 (0.4–0.8) | 3.3 (2.8–3.7) |
| 2002 | 43.3 (42.1–44.6) | 11.7 (11.0–12.4) | 6.9 (6.4–7.5) | 4.1 (3.7–4.5) | 2.6 (2.3–2.9) | 7.9 (7.3–8.4) | 0.6 (0.4–0.8) | 3.5 (3.2–3.9) |
| 2003 | 43.8 (42.6–45.0) | 11.2 (10.6–11.8) | 6.7 (6.2–7.2) | 4.1 (3.7–4.5) | 2.5 (2.2–2.8) | 7.6 (7.1–8.1) | 0.7 (0.6–0.9) | 3.1 (2.8–3.5) |
| 2004 | 36.9 (35.9–38.1) | 9.3 (8.8–9.8) | 5.2 (4.8–5.7) | 3.5 (3.2–3.9) | 2.4 (2.2–2.7) | 5.7 (5.2–6.1) | 0.6 (0.5–0.7) | 3.1 (2.8–3.4) |
| 2005 | 41.8 (40.8–42.8) | 8.9 (8.5–9.5) | 4.5 (4.2–4.8) | 3.7 (3.4–4.1) | 2.0 (1.8–2.2) | 5.4 (5.0–5.8) | 0.7 (0.6–0.8) | 2.9 (2.7–3.2) |
| 2006 | 43.8 (42.8–44.8) | 8.9 (8.4–9.3) | 4.2 (3.9–4.6) | 4.2 (3.9–4.5) | 1.3 (1.1–1.5) | 4.9 (4.6–5.3) | 0.7 (0.6–0.8) | 3.2 (2.9–3.5) |
| 2007 | 45.8 (44.8–46.9) | 8.9 (8.5–9.4) | 4.1 (3.8–4.5) | 4.9 (4.6–5.3) | 0.8 (0.7–0.9) | 5.2 (4.8–5.5) | 0.8 (0.6–0.9) | 3.1 (2.9–3.4) |
| 2008 | 53.2 (52.1–54.2) | 10.3 (9.8–10.8) | 4.4 (4.1–4.7) | 5.9 (5.6–6.3) | 0.7 (0.6–0.8) | 6.2 (538–6.5) | 0.8 (0.6–0.9) | 3.4 (3.2–3.7) |
| 2009 | 51.4 (50.3–52.4) | 9.1 (8.7–9.6) | 3.9 (3.6–4.1 | 5.7 (5.4–6.1) | 0.6 (0.4–0.7) | 5.2 (4.8–5.5) | 0.6 (0.5–0.7) | 3.3 (3.1–3.6) |
| 2010 | 52.1 (51.1–53.2) | 9.0 (8.6–9.4) | 4.2 (3.9–4.5) | 5.6 (5.3–5.9) | 0.8 (0.7–0.9) | 4.8 (4.5–5.1) | 0.7 (0.6–0.9) | 3.4 (3.2–3.7) |
| 2011 | 46.0 (45.1–47.0) | 7.9 (8.3–3.4) | 3.4 (3.2–3.7) | 4.9 (4.6–5.2) | 0.9 (0.7–1.0) | 3.8 (3.5–4.0) | 0.6 (0.5–0.8) | 3.1 (2.9–3.4) |
.")
The rate of benign lesions also showed substantial variations (from 23.9‰ in 1996 to 3.8‰ in 2011). Finally, DCIS remained stable after 1997 with a detection rate of 0.7‰. IC reached a detection rate of 4.5‰ in 1997 decreasing to 3.2‰ in the following year and remaining stable until the end of the study.
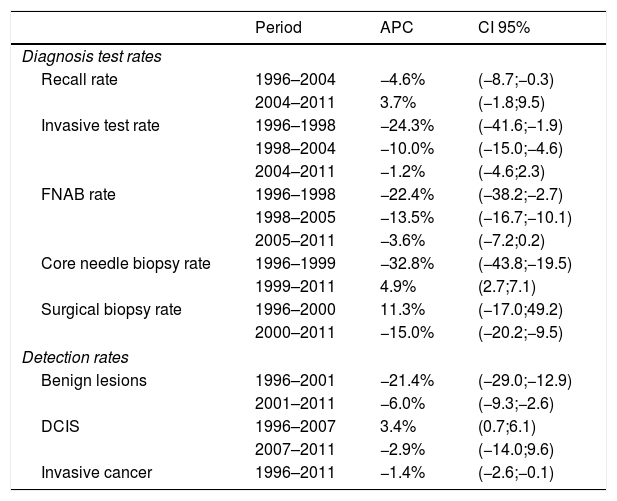
ACP and joint point in diagnosis test and detection rates are shown in Table 3. For each indicator, the periods included in each joint point and their corresponding ACP are presented. Recall rate declined by 4.6% from 1999 to 2004, invasive test rate declined between 1996 and 2004, with two joint point in the period. FNAB rates changed during 1996–2011: a 22.4% declined pre year during 1996–1998, a 13.5% declined per year during 1998–2005, and non-statistically significant 3.6% decreased per year during 2005–2011. CB rates decreased between 1996 and 1999 and changed trends in 1999–2011 with a rising of 4.9% per year. Benign lesions rate decreased from 1996 to 2011, 21.4% per year during 1996–2001 and 6.0% during 2001–2011. DCIS and IC had no-statistically significant changes.
Annual percent change (APC) of each diagnostic test rates and detection rates.
| Period | APC | CI 95% | |
|---|---|---|---|
| Diagnosis test rates | |||
| Recall rate | 1996–2004 | −4.6% | (−8.7;−0.3) |
| 2004–2011 | 3.7% | (−1.8;9.5) | |
| Invasive test rate | 1996–1998 | −24.3% | (−41.6;−1.9) |
| 1998–2004 | −10.0% | (−15.0;−4.6) | |
| 2004–2011 | −1.2% | (−4.6;2.3) | |
| FNAB rate | 1996–1998 | −22.4% | (−38.2;−2.7) |
| 1998–2005 | −13.5% | (−16.7;−10.1) | |
| 2005–2011 | −3.6% | (−7.2;0.2) | |
| Core needle biopsy rate | 1996–1999 | −32.8% | (−43.8;−19.5) |
| 1999–2011 | 4.9% | (2.7;7.1) | |
| Surgical biopsy rate | 1996–2000 | 11.3% | (−17.0;49.2) |
| 2000–2011 | −15.0% | (−20.2;−9.5) | |
| Detection rates | |||
| Benign lesions | 1996–2001 | −21.4% | (−29.0;−12.9) |
| 2001–2011 | −6.0% | (−9.3;−2.6) | |
| DCIS | 1996–2007 | 3.4% | (0.7;6.1) |
| 2007–2011 | −2.9% | (−14.0;9.6) | |
| Invasive cancer | 1996–2011 | −1.4% | (−2.6;−0.1) |
This study describes the process of technological changes in breast cancer diagnosis in population-based screening breast cancer programmes between 1996 and 2011, associated to adoption of CB. In this 15 years period, overall, 47 per 1,000 screening examinations resulted in additional examinations, and 11.6 per 1,000 underwent biopsy.
Considered de whole study period, additional examination rates fell 23% and invasive test rates 72%.
From overall invasive test rates de biggest drop was FNAB (82%), followed by SB (64%). Finally CB decreased 48%. Also, benign lesions fell 84% in the period, whereas DCIS and IC were not modified.
Nevertheless, the most relevant result is although the use of the CB has become more widespread within screening programmes for breast cancer, it has not been assimilated into routine in Spain until 1999; and its impact on the use of other diagnostic tests was unequal, with no change in surgical biopsy rates until the year 2000 and withdrawal of FNAB previously to the introduction of the CB. Recall rate, invasive test rate and FNAB rate decrease started in 1996, until 2004 in case of recall rate and invasive test rate, and until 2005 in case of FNAB rate.
The overall recall rate in this study was in the range of that of other published rates (1–11%),26 and meets the European Guidelines for Quality Assurance in Breast Cancer Screening and Diagnosis standards.6
The decrease in use of invasive tests and recall rates are also in agreement with those of other studies that report varying degrees of implementation of CBs, ranging from 62% to 90%.27
Decisions about how to make initial pathologic diagnoses are critical in terms of quality of life, for women with both, benign and malignant breast diseases. Limitations on the implementation of new technologies can greatly influence the quality of services provided. Overcoming these obstacles by supporting the deployment of new technologies is important, for example by making resources for diagnosis and treatment available within population screening programs and improving their acceptability; these factors have been recognized since screening was first introduced in the 1970s.28
There are certain limitations of the study. First, it has not made a stratified analysis by BIRADS because the number of cases dropped a lot in each BIRADS and would result in inconsistent results. Second, it was not possible to include cancer rates interval (tumours not diagnosed at screening that appearing before the next screening) which might have been affected by the diagnostic tests used, although rates reported by the programs included in this study meet the recommended standards.29–30 Finally, this study did not include all mammographic screening programmes in Spain, and extrapolation of the results may be limited.
The adoption of CB into practice in the context of breast cancer diagnosis was characterized by slowly introduction, which spend nearly ten years in become dominant practice and largely substitute technique, since other technologies such as FNAB have a notable decline in the period. A possible factor in the delay of the incorporation of the CB could be related to the incorporation of the explicit recommendation of use to the European guidelines from the fourth edition of the same, published in the year 2006.
The slowly adoption suggests that even in highly planned health interventions, such as population screening programs,31 the introduction of a new technology requires additional planning efforts, that involve identifying barriers and measures to overcome them, through the provision of resources, the training of professionals, the evaluation of the care process and the dissemination of clinical guidelines. This variation in the uptake of health technologies agree with other evaluations 32 for that reasons heath systems should to be able to measure and manage the diffusion process.
These results have some implications for the improvement of clinical practice: The aim of health technology assessment is to promote a secure and timely access to innovation for patient. The development, adoption, diffusion and abandonment of health technologies is heterogeneous and depends on a network of social, financial and professional causes, both in the abandonment of ineffective technologies and in the slowness with which some technologies are delayed in reaching the state of practice dominant. Professional preference is one of many factors which has been identified to be crucial in determining the adoption of a new health technology.33
To improve the timing of health technological changes it is important to see adoption and assimilation as part of an ongoing process rather than discrete events.34 Proposed measures to support the innovation adoption included to inform the design of a new technology; to identify technological solutions that have a limited chance of achieving large-scale, sustained adoption; to plan the implementation and to explain and learn from program failures.35
Conflict of interestsThe authors declare no conflict of interests.
IMIM (Hospital del Mar Medical Research Institute), Barcelona: Andrea Buron, Xavier Castells, Josep Maria Corominas, Laia Domingo, Ana Rodrıguez-Arana, Marta Roman, Sonia Servitja, Maria Sala, Isabel Tora-Rocamora, and Mar Vernet;
Corporacio Sanitaria Parc Taulı, Sabadell: Marisa Bareand Xavier Andreu;
Catalan Institute of Oncology, Barcelona: Llucia Benito and Carmen Vidal;
Hospital de la Santa Creu i Sant Pau, Barcelona: Maria Jesus Quintana and Judit Sola-Roca;
General Directorate of Public Health, Department of Health, Government of Cantabria: Mar Sanchez;
Principality of Asturias Health Service: Carmen Natal;
University of Oviedo, Oviedo. Spanish Consortium for Research on Epidemiology and Public Health (CIBERESP), Madrid: Adonina Tardón and Ana Fernandez-Somoano;
Institut d’Investigacions Sanitàries Pere Virgili, Reus: Jaume Galceran, Francina Saladie;
Hospital Santa Caterina, Girona: Joana Ferrer;
Catalan Cancer Plan, Catalan Health Government, Barcelona, Spanish Cancer Research Network (RTICC), Carlos III Health: Josep Alfons Espinas.