


Nowadays, Supply Chain success and competitiveness heavily depend on the integration of its components and adaptability to deal with a changing environment. This article suggests the integration of design and management of a Supply Chain from an outcome-driven perspective. We propose a two-phase decision-making support methodology: first suppliers are pre-screened by solving a multi criteria sorting problem, and then a design and management plan is generated by solving a Mixed Integer Linear Programming Model. Experimentally we showed that the proposed methodology can efficiently solve to optimality the most popular benchmark instances published in previous paper moreover our model also includes problem characteristics that have not been addressed together in previous published papers.
Actualmente, el éxito y competitividad de las cadenas de suministro depende en gran medida de la integración de sus componentes y la capacidad de adaptación a los cambios que se presenten. En este artículo se propone la integración del diseño y planeación de la cadena de suministro desde una perspectiva dirigida a resultados. Se propone una metodologia de apoyo a la decisión de dos fases: en la primera fase de preselección los proveedores son pre-seleccionados resolviendo un problema de ordenamiento y en la segunda fase de diseño y planeación un modelo lineal entero mixto es resuelto. Experimentalmente se muestra que la metodología propuesta puede resolver de manera óptima instancias publicadas en artículos previos, por otra parte nuestro modelo incluye características que no han tratado en conjunto en los trabajos publicados anteriormente.
A Supply Chain (SC) is a network of suppliers, manufacturing plants, warehouses, and distribution channels organized to acquire raw materials, convert them into finished products, and distribute these goods to customers [1]. Supply Chains are generally complex and are characterized by numerous activities spread over multiple functions and organizations. From a functional perspective a SC typically includes the following functions [2]: logistics, inventory, purchasing and procurement, production planning, intra and inter-organizational relationships and performance measures. Therefore, coordination between members of the SC is essential for achieving highest efficiency [2,3]. Specifically, an efficient coordination of logistics activities is very important for the SC [1,4], but is not enough for the success of modern supply chains [5,6].
Coordination in a SC involves decisions at a strategic, tactical and operational level in the organization such as selecting location and capacity of plants and warehouses (strategic decisions); selection of suppliers, products range and production as well as distribution channels and transportation modes (tactical decisions) and finally, selection of flows of raw materials, semifinished and finished products in the network (operational decisions) [1].
As stated by Melnyk et al. [5] benefits offered by a traditional SC (reduced costs, faster delivery and improved quality) are not enough to compete today. Moreover, they assure that, while traditional SC was strategically decoupled and price-driven, the modern supply chain should be strategically coupled and value-driven. In other words, SC should be designed and managed to be outcome-driven. A recent review [6] shows that the vast majority of published papers follow a demand-driven perspective, or delivery-driven perspective. However, there are only a few papers that try to address design and planning problems in a SC from an integrated perspective [6,7]. Many relevant tactical/operational decisions in Supply Chain Management (SCM) such as procurement, routing and choice of transportation modes, are far from being integrated with location decisions, and in the few papers including these aspects, the structure of the supply chain network is considerably simplified (e.g., a single product and a single location layer are usually assumed) [7]. The integration of supplier selection (sourcing) and other SC drivers is even scarcer in the related scientific publications [6,7,8,9]. In most recent publications, where suppliers selection is integrated with SC design and/or planning, only supplier costs are taken into consideration. However, Ho et al. [10] assert that the traditional single criterion approach based on lowest cost is not supportive and robust enough in contemporary supply management.
In this paper we address the problem of integrating design and management in a SC from an outcome-driven perspective. We propose a two-phase decision support methodology: First, suppliers are pre-screened by solving a multicriteria sorting problem and then, optimizing an integrated mixed integer linear programming model (MILM) for designing and planning SC, targeting costs, responsiveness, security, sustainability, resilience and innovation as outcomes. This model, for designing and planning a deterministic, single-period, multi-commodity SC, includes location decisions for plants and warehouses, suppliers selection, decisions about which products should be produced in each open plant, and the amount that should be produced, selection of transportation modes and channels; as well as other typical decisions found in the revised literature. Overall cost is to be minimized (fixed costs for opening plants/warehouses, transportation costs, production costs, suppliers' costs of raw materials).
Numerical experiment conducted with available benchmark instances from the revised literature [11] shows that the proposed model is both flexible and extremely efficient. Exact solutions were achieved in reasonable CPU time even for large instances.
The main scientific contributions of this paper are: a mathematical model that integrates design and planning of a three echelon, multi commodity supply chain which is both flexible and efficient, and a decision support methodology for helping the Decision Maker to carry out the process of design and planning from an outcome-driven perspective.
The paper is organized as follows. In the next section the problem is formulated and a mathematical model is presented; then, in section 3, the proposed decision support methodology is introduced. In section 4 numerical results are presented and discussed, and finally, the paper concludes with a few general remarks and future research directions (section 5).
2Problem statementThe problem we are tackling in this paper consists in an integrated design and planning of a SC from an outcome-driven perspective. Basic outcomes to take into consideration are:
- •
Cost: to reduce product costs, to ensure timely and reliable delivery and to maintain quality.
- •
Responsiveness: to quickly respond to changes in demand (volume, mix, location) and at a reasonable cost.
- •
Security: to ensure that supplies coming through the supply chain are protected from disruption because of external threats. To protect product integrity and consistency.
- •
Sustainability: To provide products through a supply chain that ensures controlled and minimal resource impact, both today and in the future.
- •
Resilience: To develop a system capable of identifying, monitoring and reducing supply chain risks and disruptions, as well as to react quickly and cost-effectively.
- •
Innovation: To provide critical customers with a stream of products and services that are not only new but also address needs that competitors have neglected or not served well.
Among the key design traits of a SC for achieving one or a blend of outcomes, the following ones are suggested in more than one outcome [5]:
- •
Integrated SC design, planning and management, involving close interaction and integration with immediate customers and first-tier suppliers (Cost, Responsiveness, Security, Sustainability, Resilience, Innovation).
- •
Extensive suppliers pre-qualification and assessment to ensure that the “right” suppliers are selected and that they understand what is required (Cost-indirectly, Responsiveness, Security-indirectly, Sustainability, Resilience, Innovation).
- •
Excess capacity -redundancy- in the SC (Responsiveness, Security, Resilience, Innovation).
- •
Supply planning to include not only production capacity but also logistics capacity (Responsiveness, Resilience).
From here we can observe that the two most important design traits are integration and suppliers pre-qualification. These two design traits are the core of the problem formulation we are proposing in this paper. Nevertheless, the other two design traits (redundancy and planning including production and logistics capacity) are also considered in the formulation, as well as classical assumptions and constraints reported in papers that address SC design and/or planning problems.
We have formulated the problem of designing and planning a SC as a three-echelon network in deterministic, single-period and multi-commodity contexts.
In the first echelon, suppliers deliver raw materials to plants, which produce certain products in certain amounts. There is a set of potential suppliers, potential manufacturing plants, and potential transportation modes. Decisions that should be made here are: to determine which suppliers met the standards or qualitative requirements of the organization (suppliers pre-qualification), to select which plants will be open (plan location), which products will be manufactured in the open plants and which quantity of units are to be manufactured, and to determine which suppliers will deliver what amount of raw materials to which plants (suppliers selection) using which transportation modes (transportation mode selection). It is considered that each plant has a fixed cost for opening. In each plant manufacture processes transform raw materials into finished products. It is assumed that the quantity of raw material required in the production of one unit of each product is known. Transportation modes have a limited capacity and a cost for each raw material. Finally, each plant also has a limited manufacturing capacity. It is supposed that there are no inventories on raw materials or finished products in plants.
In the second echelon once the products have been manufactured in plants, they are delivered from plants to warehouses using certain transportation modes. Each transportation mode has associated, as in the first echelon, a cost and limited shipping capacity for each product. Here, there is a set of manufacturing plants, a set of potential warehouses, and a set of potential transportation modes. Each warehouse has a fixed cost for opening and limited capacity. The decisions that should be made are: Which warehouses will be open (warehouses location)?, which amount of products will be delivered from which plants to which warehouses by which transportation modes (transportation mode selection)?.
In the third echelon, products are delivered from warehouses to distribution centers by certain transportation modes. There is a set of open warehouses, a set of distribution centers and a set of potential transportation modes. The decisions that should be made are: Which amount of products will be delivered from which warehouses to which distribution centers by which transportation modes (transportation mode selection)? Warehouses and distribution centers have a limited capacity for each product. It is considered that warehouses and distribution centers have zero Inventories. As in the first two echelons, transportation modes have a unit cost associated. Each distribution center has a known demand for each kind of product. The supply chain network is illustrated in Figure 1.

The objective of the problem can be a blend of the basic outcomes, for example to minimize costs, maximize responsiveness and sustainability. According to the design traits described above, this objective can be accomplished by carefully fulfilling the two most important design traits: to implement a supplier pre-screening mechanism where the requirements of the organizations should be clearly stated, and integrate the design and planning of the SC network. But the other two design traits should also be taken into account: considering production and logistic capacity and allowing for redundancy in suppliers of raw materials and in manufacturing of products. Independently of the blend of outcomes selected for designing and planning a SC network, if those traits are considered when constructing abstract models, it is guaranteed that the resulting SC network will be flexible and will quickly respond to any change or disruption in its environment [5].
2.1Mathematical formulationSetsR raw material set indexed by r finished products set indexed by f potential suppliers set indexed by s potential plants set indexed by i potential warehouses set indexed by j distribution centers set indexed by k transportation modes set indexed by l
CSsr Purchasing unit cost of raw material r of supplier s Transportation unit cost of raw material r from supplier s to plant i by transportation mode l Capacity for raw material r in transportation mode l from supplier s to plant i Required area per unit of raw material r in any transportation mode Positive constant with great value
CIi Fixed cost for opening plant i Manufacturing capacity of product f at plant i Manufacturing cost of product f at plant i Cost of transporting one unit of product f from plant i to warehouse j using transportation mode l Amount of raw material r needed by product f Capacity for product f in transportation mode l from plant i to warehouse j Positive constant with great value
CFj Fixed cost for opening warehouse j Unit cost for transporting product f from warehouse j to distribution center k using transportation mode l Capacity of transportation mode l for product f from warehouse j to distribution center k Required area per unit of product f in any transportation mode
Dkf Demand of product f at distribution center k
Vsir Amount of units bought from supplier s to plant i of raw material r Amount of units manufactured in plant i to product f Amount of units of product f sent in the transportation mode l from plant i to warehouse j Amount of units of product f sent in the transportation mode l from warehouse j to distribution center k
Ss Binary variable equal to 1 if supplier s is selected and equal to 0 otherwise Binary variable equal to 1 if the transportation mode l is selected to send the raw material r from supplier s to plant i Binary variable equal to 1 if the plant i is opened and equal to 0 otherwise Binary variable equal to 1 if plant i is used to manufacture the product f and equal to 0 otherwise Binary variable equal to 1 if transportation mode l is selected to send product f between plant i and warehouse j and equal to 0 otherwise Binary variable equal to 1 if the warehouse j is opened and equal to 0 otherwise Binary variable equal to 1 if the transportation mode l is selected to send product f between warehouse j and distribution center k, and equal to 0 otherwise.
If a supplier is selected, he should send raw material:


If a plant is opened, then it should be used:

Flow balance (plants):

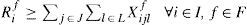
Manufacturing capacity:

Warehouse's capacity:


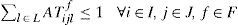
Only one transportation mode by product:

If a warehouse opened, then it should be used:

Flow balance (warehouses):

Demand:

Single sourcing:
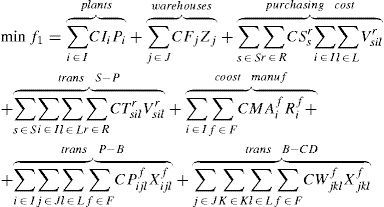
Objective function

The objective is to minimize the total cost. The total cost includes fixed costs for opening plants and warehouses, purchasing cost of supplies, transportation costs between suppliers and plants, manufacturing costs in plants, and transportation costs from plants to warehouses and from them to distribution centers.
In the next section, we present the decision support methodology that we propose for solving the stated problem.
3Proposed methodologyAs pointed out by Simon [12], decision-making is a process, consisting of three main stages: intelligence, design and selection. In the intelligence stage the problem formulation is built, while in the design stage the relevant alternatives are determined and their consequences are established by means of a set of criteria. In the selection stage a preference relationship is built in the consequences space and analyzed to rank, select or sort alternatives (ranking, selection or sorting multi criteria decision making problem [13]).
An alternative is defined as a SC network composed by selected suppliers, open plants, open warehouses, distribution centers and selected delivery channels for transporting raw materials from suppliers to plants and transporting products from plants to warehouses and from warehouses to distribution centers. For each delivery channel it is specified how many raw materials or products will be shipped and by which transportation mode. Also, for each plant it is established how many units of each product will be produced. Relevant alternatives are defined intensively by the constraints of the model presented in the previous section. This model also represents the problem statement so no further decision support is needed in the intelligence stage. As we are dealing with a single-objective optimization problem, at most one optimal point should be expected when solving an instance. Then, in this case, decision support for the selection phase involves the selection of a method for exploring the feasible region and the application of typical post-optimization procedures. This is the job of an operations research analyst, since special skills in mathematics are needed for doing these two activities.
In what follows we present a decision support methodology for the design stage of the decision process.
3.1Decision support for the design stageIn the problem here tackled, in the design stage, support is only needed for pre-screening suppliers, because the mathematical model presented in the previous section defines alternatives and their consequences.
Supplier selection is a well-known and popular problem among researchers [10,14]. Much effort has been devoted to rank or evaluate suppliers from a quantitative perspective as concluded by Prince et al. [15]. However, suppliers pre-selection is a critical activity for designing and planning an outcome-driven SC where qualitative and quantitative criteria should be taken into account to evaluate suppliers and even more important, to make explicit the supplier's profile required by the organization [5].
We formulate the pre-screening of suppliers as a multi criteria-sorting problem. It consists in assigning each alternative to one of a set of predefined categories [16]. As far as the authors know it is the first time that suppliers selection is formulated this way, as supported by recent reviews [10,15]. Formulating the pre-screening of suppliers as a multi-criteria sorting problem has the advantage of allowing making explicit the acceptance or rejection profiles of suppliers for the decision maker that represents the organization as well as for the suppliers. In our problem we define two categories: accepted and rejected, where the category accepted is preferred for the decision maker over the category rejected. Typical criteria for evaluating suppliers are: delivery time, cost of products, quality of service, and manufacturing capacity. Other criteria could be also considered.
There are several methods for solving multi criteria sorting problems. One of the most popular is ELECTRE TRI [16], because of simplicity behind the method and how the preference relationship over the set of categories {C_j} is built and represented through profiles {b_i}. Profiles are built in such a way that a preference relationship is defined among them. They represent boundaries between categories. Usually, a profile represents a boundary between two categories, but there may be more than one profile for defining the boundary between two categories. So, profiles induce a semi-order in the category set. A profile is composed by a combination of values of the criteria chosen by the decision maker to evaluate alternatives. ELECTRE TRI employs two assignment criteria, one optimistic and other pessimistic [17].
Next we illustrate how the multi-criteria sorting problem of suppliers pre-screening is formulated and solved by employing the Electre Tri method. To do that, we use a modification of an example presented by Wu [17].
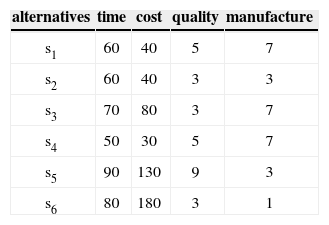
Example:Let us consider six suppliers (s1,s2,s3,s4,s5,s6) evaluated using four criteria (percentages of time (expressed by c1), cost (expressed by c2), quality (expressed by c3) and manufacture (expressed by c4)). The direction of preferences on c1 and c2 are decreasing while c3 and c4 are increasing. The performance matrix is given in Table 1.
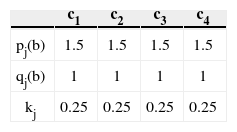
Let us suppose that the alternatives are compared to the profile b={60,80,5,7} using the preferential information given in Table 2 Here pj(b) represents the preference threshold, qj(b) the indifference threshold and kj, the importance coefficient (weight).
Comparison of s1 and b:- 1.
Computation of partial concordance indices
- 2.
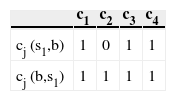
Computation of the concordance indices c(b,s1) and c(s1,b):
- 3.
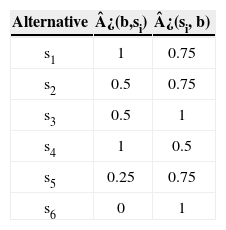
As there are no discordances, the indices dj(si,b) and dj(b,si) are equal to zero. Therefore, the credibility indices ¿(si,b) and ¿(b,si) are equal to the concordances indices which are shown in Table 4 for all alternatives.
- 4.
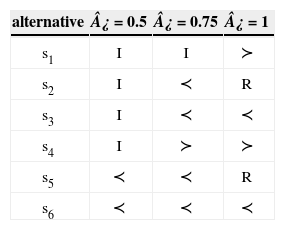
Determination of the preference relation between si and b (see Table 5): where I denote indifference, and ≺,≻ denote the preferences and R incomparability.
As it can be seen in Table 6 the suppliers that are pre-selected independently of the level of ¿ are s1 and s4. They should be pre-selected by the decision maker without hesitation. Even though supplier s3 is not as good as the profile on criteria c1 and c3, also he is a strong candidate. If the decision maker considers that these small differences are not significant, then he/she can select supplier s3 or alternatively, the decision maker could delay the decision for conducting more research in order to get more information about this supplier. On the other hand, suppliers s5 and s6 are, undoubtedly, less preferred than the profile, so the decision maker should not select them. In addition, this process helps suppliers identify their weaknesses in relation to the organization requirements, so they can work on it for a future chance of being pre-screened in a future selection process.
3.2Decision support for the selection stageThe selection stage of the decision process is where recommendations are actually built to help the decision-maker make a decision over the set of alternatives. Typically, a recommendation is a set of alternatives that best represent the preferences and expectations of the decision maker in a concrete decision situation. Alternatives are presented in such a way that is easy for the decision maker to derive an explanation of his (her) choice.
For this stage we are proposing to feed our model with required data from the specific decision situation and solve it. Only suppliers that were not rejected at the pre-screening stage are taken into account; only criteria expressed in ordinal scales can be taken into account. As a result, an optimal point is achieved (or near optimal) as well as one or more solutions related to this optimal point. After optimization is done, a post-optimization is carried out to get information about stability of solutions, scenario analysis, among other analysis. Finally, a recommendation report can be prepared with the information obtained in the optimization and post-optimization processes.
In the next section some numerical results are shown. First an experiment is conducted for validating our model against benchmark instances, in this case our model was adapted (dropping certain constraints and weakening our assumptions) to the problems proposed in some popular papers for designing and planning SC in an integrated way [11]. We ran some of their instances, which were gratefully supplied by Prof. Cordeau. Then, a group of instances were randomly generated to get insight into structural properties of the problem.
4Computational ExperimentsThis section describes the experiments carried out to evaluate the proposed mathematical model. The first experiment aimed to investigate if with the current advances in commercial software and the most advanced hardware platforms it is possible to solve real-life instances. To do that, we compared with benchmark instances from the literature. To use these instances, we needed to modify our model. The second experiment seeks to determine the complexity and scope of the model. For conducting it we generated a set of instances. We used Concert-CPLEX 12.4 on a processor Intel Pentium Dual-Core 2.70GHz with 4GB of RAM.
4.1Comparison with benchmark instancesTo our knowledge, the most complete set of instances (with varying degree of computational complexity and instance structural complexity) is the one proposed by Cordeau et al. [11] These instances are grouped in three categories according to computational complexity: small, medium, and large instances. Four instances were generated in each group with different structural complexity and there were two replicates for each instance structural complexity category. The size of each category is |S|=|I|=|J|=n/2, |R|=|F|=n/5, and |K|=n with n=100, 200, 300 (small, medium and large). For more details, please see [11].
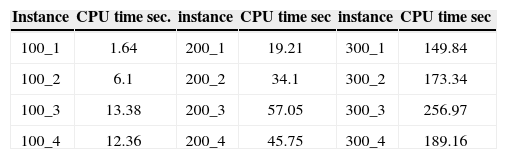
We present here the results obtained using 4 instances and one replicate for each category (small, medium, large), so in total we present results of 12 instances.
Columns 1, 3 and 5 in Table 7 display the instance name, where the first number indicates the number of distribution centers and the other number is used to identify the replicate. Columns 2, 4 and 6 present the CPU time elapsed for reaching optimal solutions.
The results of our experiments were very interesting because while Cordeau et al. [11] did not reach optimal solutions for any of the instances neither using branch and bound, nor using Bender decomposition, we obtained optimal solutions for all instances in a reasonable CPU time. Using our model, we obtained the relative gaps equal zero in all instances, while Cordeau et al. [11] reported gaps above 17%. The relative gap represents the relative deviation between the values of the linear relaxation and optimal integer value.
Nevertheless, we should point out that results reported in [11] were obtained using version 6.6.1 of CPLEX, while our results were obtained using version 12.04, which speeds up solution times by a factor of 10 in the vast majority of the cases against earlier versions of CPLEX. Note, also, that in the most recent papers dealing with the problem of integrated design and planning of a two or three echelon SC, meta-heuristic methods or data envelopment method have been employed [6,10] and in those cases, where mathematical programming is used, only very simple examples have been presented.
In addition, this experiment it is possible to deduce the influence of some parameters on the computing time, the objective value or the complexity of an instance among parameters like cardinality of plants, warehouses, and distribution centers, and amount of products and raw material, these last appears to be the most sensitive parameters. The influence of other model properties like the presence or absence of single sourcing constraints is explored in the next experiment.
4.2Analysis of the structure and complexity of the modelTo conduct this experiment, several instances were generated with different sizes. Different elements indicate the size of an instance: the number of potential suppliers, the number of potential plants, the number of potential warehouses, the number of distribution centers, the number of transportation modes, the number of raw materials, and the number of products. Each instance was randomly generated as in Olivares-Benitez [18]. We generated three groups of instances with 5 replicates, varying the number of suppliers, plants, warehouses, distribution centers, raw material, and products.
We investigated the influence that the presence or absence of the single sourcing constraint has on the computation time and instance complexity.
In Table 8 is presented the average CPU time for solving large instances without (column two) and with (column three) considering single source constraints.
As it can be observed in Table 8 single source constraints make the instances harder to solve. When single source constraints are activated the computing time increases by a factor between 10 and 100 times with regard to the computer times obtained when solving the same instances but without considering single source constraints.
5Conclusions and extensionsIn this paper we addressed the problem of integrated design and planning of a SC from an outcome-driven perspective. As found in the revised literature the two most important design traits in an SC outcome-driven design were integration among the module and participants and supplier prequalification, so they became key principles in our work. We presented in this paper a decision support methodology built around the two design principles mentioned above, and around others of second importance like redundancy in suppliers, SC flexibility and efficient reaction to changes or disruptions in SC environment.
Our methodology is aimed at the Decision and Selection stage of the decision process: First a suppliers pre-screening process is run by solving a multi criteria sorting problem, which from the authors' point of view is the decision problem that naturally allows the decision maker to represent in an explicit way the requirements of the organization related to the suppliers (through performance profiles defining decision categories and a preference relationship among them). This is a strategic advantage because it allows aligning the pre-qualification of suppliers to organization's strategies, and also serving the suppliers’ work to meet the standard imposed by those requirements.
We showed how our model could be easily adapted for addressing related benchmark problems and as an important remark, it should be noted that in our experiment optimal solutions were obtained for all test instances. It should also be noted that, based on an extensive literature review, there is no other publication, where real-sized instances are efficiently solved in terms of solution's quality and computation times, without imposing unrealistic simplifications of the real problem to the MILP model. The importance of this result is that it reactivates mathematical programming as an important solution tool in a field dominated by Data Envelopment Analysis and Meta-heuristics.
Some characteristics included in our model are not considered in previous papers dealing with integrated design and planning of a SC (among the ones revised by the authors): assignment of products to plants and partial capacities for products in the transportation mode.
As future work we recommend to develop, for the second phase of the methodology, a multi-objective optimization model, so multiple outcomes could be optimized at once to achieve a balanced design and management plan. We also recommend extending the proposed MILP model for including inventory management, for obtaining a more realistic model.
This work was partially sponsored by the Mexican National Council of Science and Technology (Grant CB 167019) and by the Universidad Autónoma de Nuevo León (Grants PAICYT IT 764–11 and PAICYT IT 1031–11). We are grateful to Dr. Cordeau who provided the instances for the problem.
These supports are gratefully acknowledged.