


This paper proposes the chaos synchronization-based XXY stage real-time extension fault detection; the main characteristic signal is extracted by filtering from the microvibration of stage. The chaos synchronization systems are used to extract the dynamical map of chaotic synchronization error. The Eigen value is extracted from the centroid value of phase plane plot, and the value is analyzed by extension theory, so as to determine the state of XXY stage. The stage states can be detected by the PC based real-time analysis; there are four fault statuses, including normal, X1 motor fault, X2 motor fault and Y motor fault. The dSPACE is used for signal acquisition and monitoring interface making. The real-time fault monitoring and diagnosis can be implemented at the computer side.
With technical development of various industries, product design tends to focus on compact size and portability. However, the unit mounting becomes more difficult as the size of internal components is reduced. In order to assemble the aforesaid micro components, higher accuracy is required. Therefore, the manual assembly is no longer applicable, and reducing the production speed. The registration stage improves the manual positioning in limited conditions (De Luca & Dominguez, 2011).
In terms of current requirement for registration, the unidirectional accuracy of registration stage is required, and the angle shall be corrected, so as to meet the present requirement for registration. Therefore, the XYustage is developed (Lin & Shieh, 2006) to provide better registration accuracy, but the defect is large height, so the demand for space is higher. In addition, the motor controls the rotation angle of stagecenter point, the weight capacity is limited, so the XXY stage is proposed in this paper (Lee et al., 2012). It uses three motors for positioning as XYustage, its uniaxial movement is similar to XYustage, the difference is that the X-axis is moved by X1 and X2 motors synchronously. In terms of angular rotation, the X1 and X2 motors are horizontally staggered to change the angle. Finally, the Y motor movement corrects the stagecenter point error, so as to rotate the angle.
Compared to XYustage, the XXY stage improves the large volume and low weight capacity of XYustage. However, there are few research data of XXY stage fault detection, it is more difficult to be detected compared with XYu stage. The constant faults in XXY stage are divided into three major types, motor fault, driver fault and stage fault. This study focuses on the XXY stage motor fault detection. Different papers of fault detection extract the characteristic signals of analysis faults, the vibration signal of analysis is extracted in (Ebrahimi & Faiz, 2012; Rivas et al., 2010; Immovilli et al., 2009; Barrón-Meza, 2010), mostly applied as detection signal to different mechanical faults. The current and voltage signals are used as electrical fault detection signals in (Gong & Qiao, 2012; Mohanty & Kar, 2006; Gong & Qiao, 2013). The plural signal sources are mixed for fault detection in (Watson et al., 2010). Most of detection methods use the aforesaid signals for analysis. There are multiple methods for signal analysis, for example, the wavelet analysis is used for fault detection in Teotrakool et al. (2009), and Yang et al. (2010), the spectral analysis is used for detection in Ishigaki et al. (2010), Zhang et al. (2012), and Arjona et al. (2011), and the neural is used for detection in Martins et al. (2007) and Tan and Huo (2005).
The fault diagnosis flow chart of this study is shown in Figure 1. This paper considers the quantity and installation of sensors, thus using fewer sensors for fault detection. Finally, in terms of signal selection, this study uses vibration signal as stage fault detection signal. The accelerometer is mounted on the mobile stage to extract the vibratory magnitude. Most of the aforesaid methods cannot cooperate with dSPACE, or are difficult to be used for real-time fault diagnosis. Therefore, this paper combines chaos synchronization with extension theory, and carries out spectral analysis of the stage vibration to determine the spectra of various motors, so as to extract the characteristic signals of motors from the measured vibratory magnitude. The extracted signals are imported into the chaos synchronization system to extract dynamic error amount. This can strengthen the micro features between normal status and fault status, making the features of various statuses more obvious for subsequent stage fault diagnosis. Finally, the dynamic error amount results E1, E2 and E3 obtained by chaos synchronization are used as characteristic quantity, and the characteristic quantity changing each status apparently is selected to calculate the centroid value. This calculated value is used as eigenvalue for reducing the utilization of characteristic quantity. The processed eigenvalue is used as matter-element model of each status. The correlation function between analysis and each status is calculated by the particular simple calculation of extension set. This function is normalized to recognize the status of stage rapidly. Finally, the chaos synchronization and extension theory are implemented on dSPACE. The analog-to-digital converter (ADC) of dSPACE reads the signals in the computer, the simulink makes chaos synchronization and extension theory implementation, and the dSPACE provides interface design. This interface is used for XXY stage diagnosis and monitoring and real-time stage detection.
2Chaos synchronization method
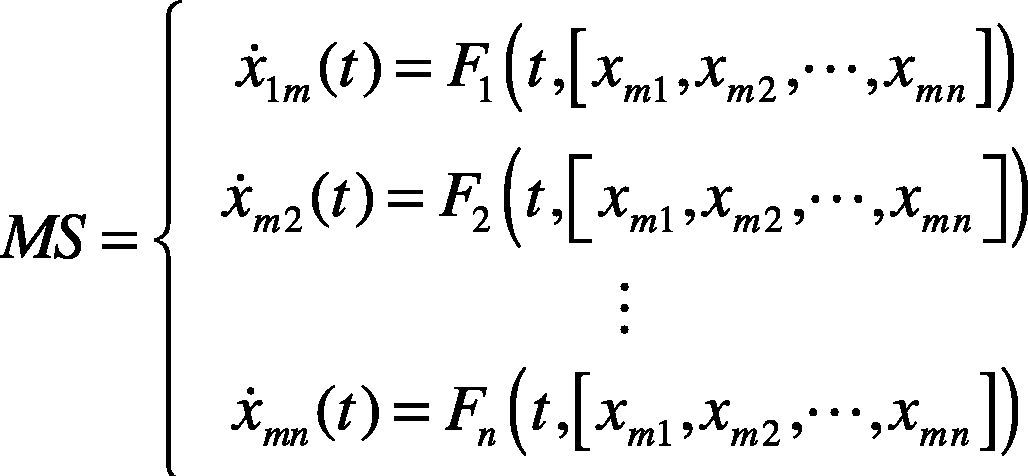
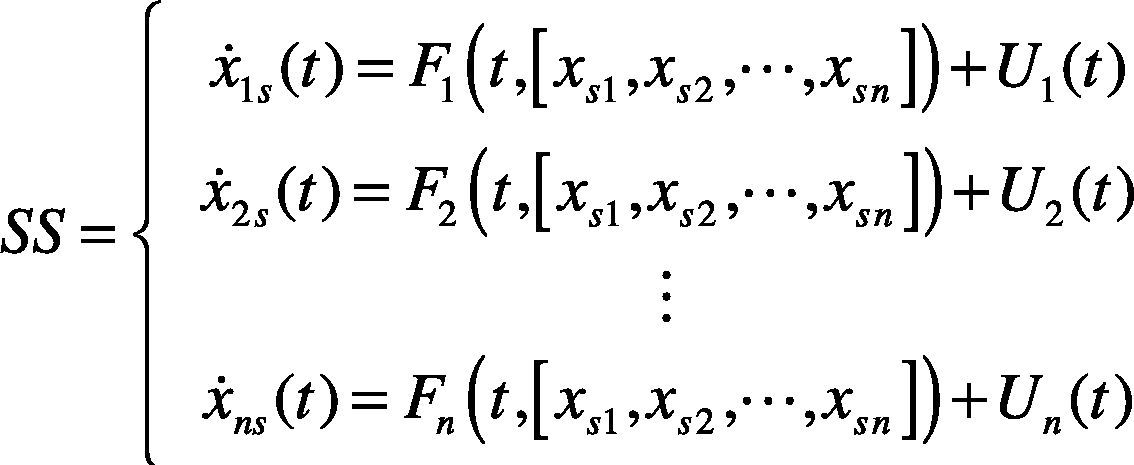
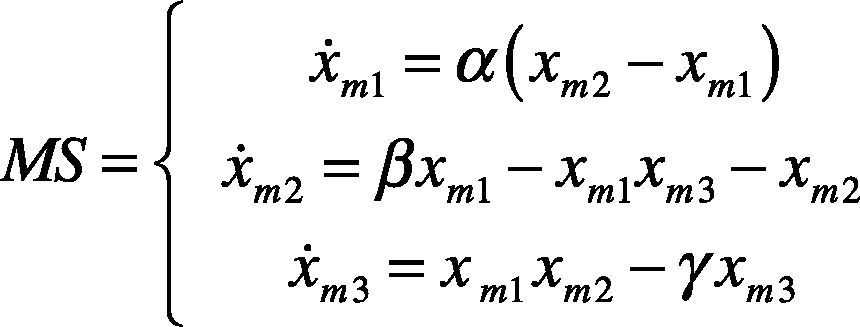
The chaos theory (Lorenz, 1963) is of nonlinear system theory. It is characterized by unpredictability and irregular motion. The chaos system makes dramatic change in micro variation. The chaos synchronization (Huang et al., 2011) synchronizes the kinematic trajectories of two chaos systems, the controller makes the error zero. In the chaos synchronization system, the two chaos systems are called Master System (MS) and Slave System (SS). When the two systems have different initial values, the kinematic trajectories of the two systems are different. However, when a controller is added to the SS to track the MS, and the MS and SS act synchronously, the kinematic trajectories of two chaos systems have the same change at the same time. The MS and SS are defined as follows:
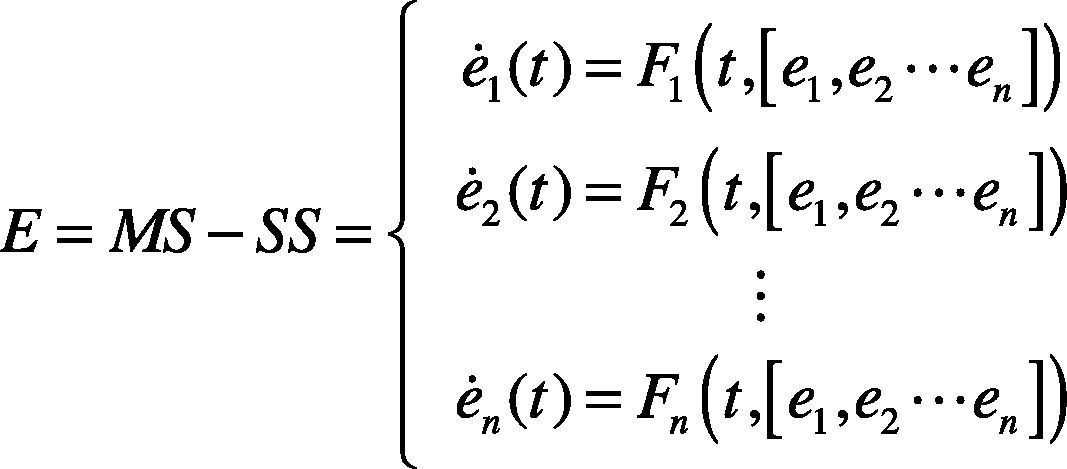
The characteristic quantity extracted in this paper is the naturally tracked dynamic error amount of MS and SS in the master-slave synchronization system. Therefore, there is no controller for the master-slave synchronization system in this paper, as long as the master and slave chaos systems are subtracted from each other, the dynamic error can be obtained.
where

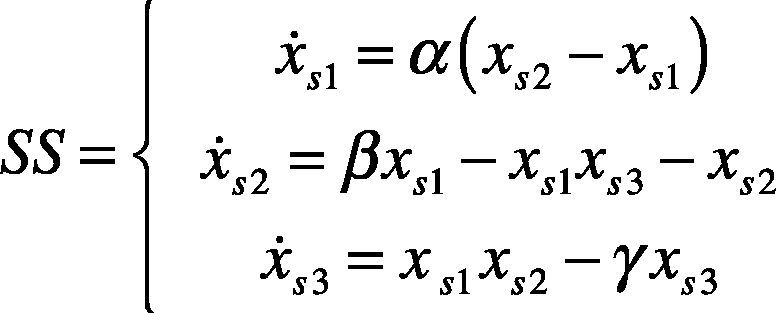
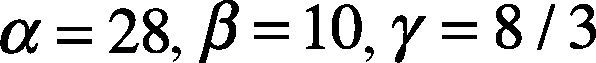
Finally, the dynamic error status also generates chaos phenomenon; this paper uses the kinematic trajectory of chaos phenomenon to increase the vibration signal differences among various stage statuses. The chaotic dynamic error equation is used as the basis of recognition. This paper uses Lorenz Chaos System (Posadas-Castillo et al., 2005). The two identical Lorenz systems are divided into MS and SS, expressed as equations (4) and (5).
where
The discrete normal signal S1 is extracted and imported into the MS. The tested signal S2 from ADC is extracted and imported into the SS as follows:


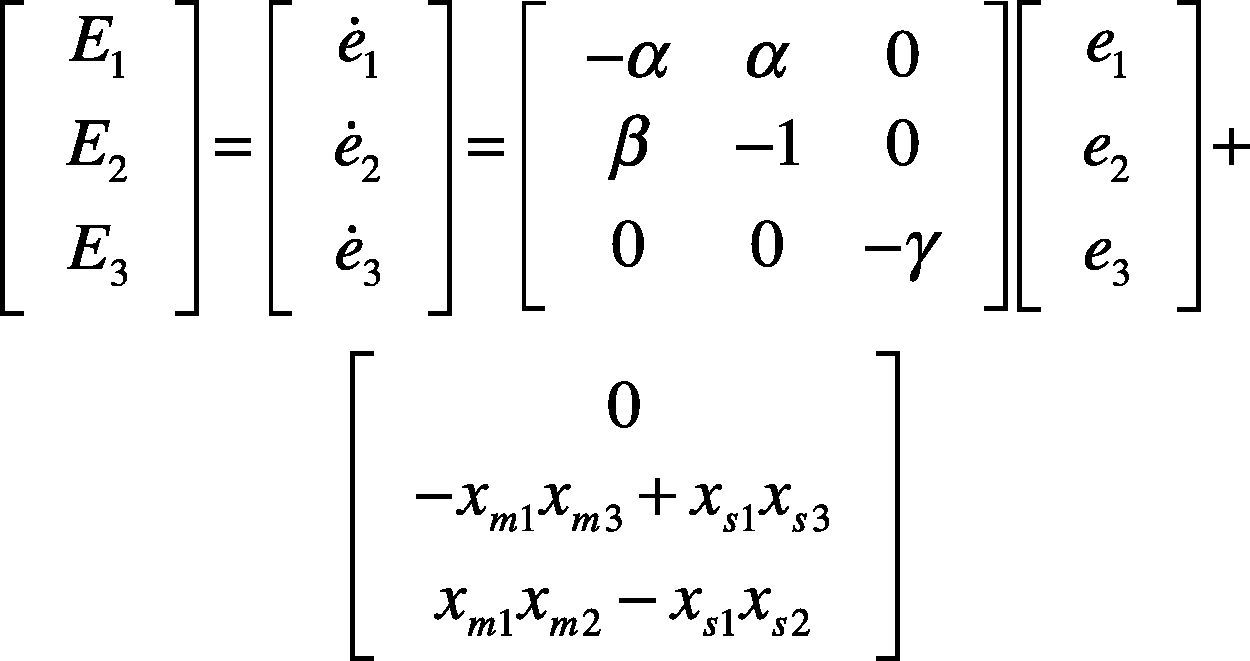
Finally, the dynamic error system in matrix form can be expressed as equation (8):
where

This paper uses the final dynamic errors E1, E2 and E3 to draw the dynamic error trajectory diagram for observation. This can obtain the centroid value of each dynamic error value, reduce the amount of computation, and increase the identifiability. Finally, the degree of correlation between analytic stage and each status is tested by extension theory.
3Extension theoryThe extension theory (Wang, 2004) determines the regularity from the extensibility of things’ statuses, and concludes the characteristics mathematically. The extension theory is divided into two major parts, matter-element theory and extension set. The matter-element theory and extension set are introduced as follows:
3.1Matter-elementThe matter-element theory can express the difference between matter-elements. The objects are distinguished by displaying the name of object, characteristic name and characteristic, representing the difference between objects. The matter-element model is defined as follows:

Where N is the name of matter-element, C is the matter-element characteristic, V is the matter-element eigenvalue. One object can have plural matter-element characteristics. If the eigenvalue is a region, this range is called classical domain, and all the classical domains shouldbe in the neighborhood domains.
3.2Extension setIn order to quantify and solve problems, the extension set is generated. The matter-element eigenvalue range is used as the set range, and the correlation function is used for calculation to obtain the matter-element extension relationship. The approximate characteristics of things are known from the extension relationship.
Figure 2 shows
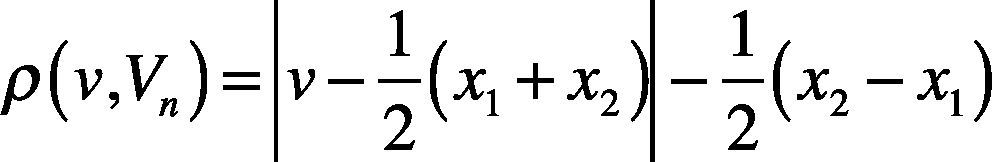
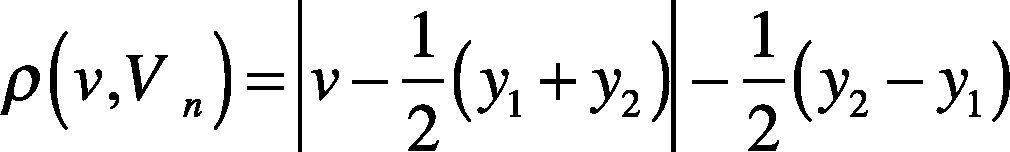

Equations (10) and (11) quantify the measured matter-element, v is the value of analysis, Vn is the classical domain, Vrn is the neighborhood domain. The relationship of analysis to classical domain and neighborhood domain can be obtained. The correlation function of analysis in the classical domain is calculated by equation (11):
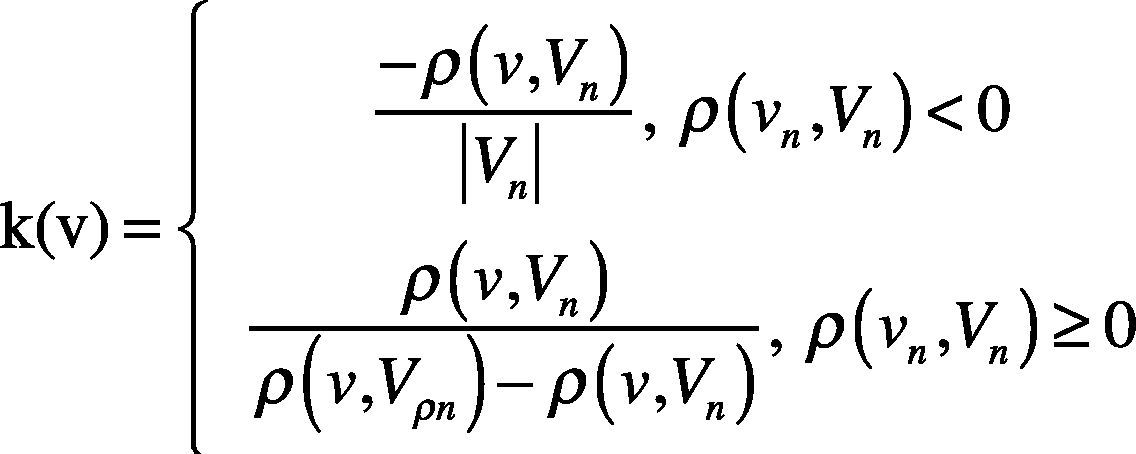
If the calculated correlation function k(v) is positive, the analysis is in classical domain. If it is negative, the analysis is outside the classical domain. In multiple matter-element model, the number of weights is adjusted as required, but the sum of various characteristic weights shall be1. Finally, the correlation functionsmin,k(v)max> after weight processing are normalized to <–1,1> for judgment. If the normalized status correlation function is1, then it means that this analysis is current state.
The status data are observed experimentally, the matter-element model of each fault status is built, and the correlation function of analysisstage to each fault status is calculated to know the fault status of analysis stage.
4Experimental resultsThe stage was XXY registration stage of Chiuan-Yan Tech. Co. Ltd. The fault detection platform is shown in Figure 3. The accelerometer was used as sensor to detect the stage vibration. The signal was sent by ADC via dSPACE to the computer. The computer processed and analyzed the signal, and displayed the stage waveform and fault status. The XXY stage in different statuses generated different vibratory magnitudes and frequencies. The signal was extracted and imported into the SS of chaos synchronization system, thus increasing the differences among various statuses, and enhancing the recognition of stage status. The matter-element model of each status was made using extension theory. The relationship to matter-element model was calculated, so as to identify the fault status. The motor was disconnected in this experiment, and the stopped motor was regarded as faulty motor, so as to simulate motor fault in the stage. The stage fault statuses that can be recognized by the chaos synchronization extension theory proposed in this paper included normal, X1 motor fault, X2 motor fault and Y motor fault.

The vibration signal of the stage in normal state is shown in Figure 4. This vibration signal is influenced by the vibration caused by three stepping motors. Therefore, the normal signal consists of the vibration signals of Y, X1 and X2 motors. The spectrum of normal signal was analyzed by FFT, as shown in Figure 5. The main frequency band and noise distribution is known by FFT. The main signal frequency band of three motors is 500-1000Hz. This frequency band is amplified, as shown in Figure 6. There are three prominent amplitudes in this frequency band. The experimental results showed that the prominent amplitudes represent the main frequency bands of vibration caused by X1 motor, X2 motor and Y motor from left to right.


This study extracted the stage vibration signal imported into the computer.The filter was established by simulink for filtering. The Butterworth filter was used for filtering, because it decays slowly and evenly compared with other types of filters.
The signals of various motor conditions were highlighted and extracted by band passfiltering, so as to obtain the signals of various motors, as shown in Figure 7. The signal was micro. Therefore, the characteristics of the extracted X1 motor, X2 motor and Y motor signals were amplified by Lorenz chaos synchronization system. The dynamic error values E1, E2 and E3 of motors are drawn on Figure 8. The graph of dynamic errors may have circles due to chaotic attractor.


When the motor has a fault, take X1 motor fault as an example, the change in vibration signal is shown in Figure 9. It is observed that the extracted signal is reduced and the frequency is changed. The change after the signal is transformed by FFT is shown in Figure 10. This frequency band of 500-1000Hz is amplified, as shown in Figure 11. The amplitude disappears at the spectrum of 600-650Hz, meaning the X1 motor has a fault. This change is also found in the X1 motor extraction, as shown in Figure 12, and the X1 motor extraction is imported into chaos synchronization system. It is observed when the motor has a fault, the dynamic error status difference from the signal extracted in normal state is enlarged. When other motors have faults, the chaos error of the corresponding motor extraction after chaos synchronization is shown in Figures 13. After chaos synchronization system, the dynamic errors of faulty motor and normal motor change, much larger than those without chaos synchronization. When the motor has a fault, the dynamic error values E1, E2 and E3 are reduced, they are more convenient than the original signal for observing the stage status and recognition, and the fault detection recognition rate is increased. The same change occurs in other motor fault statuses. When a fault occurs, the represented dynamic error graph shrinks.


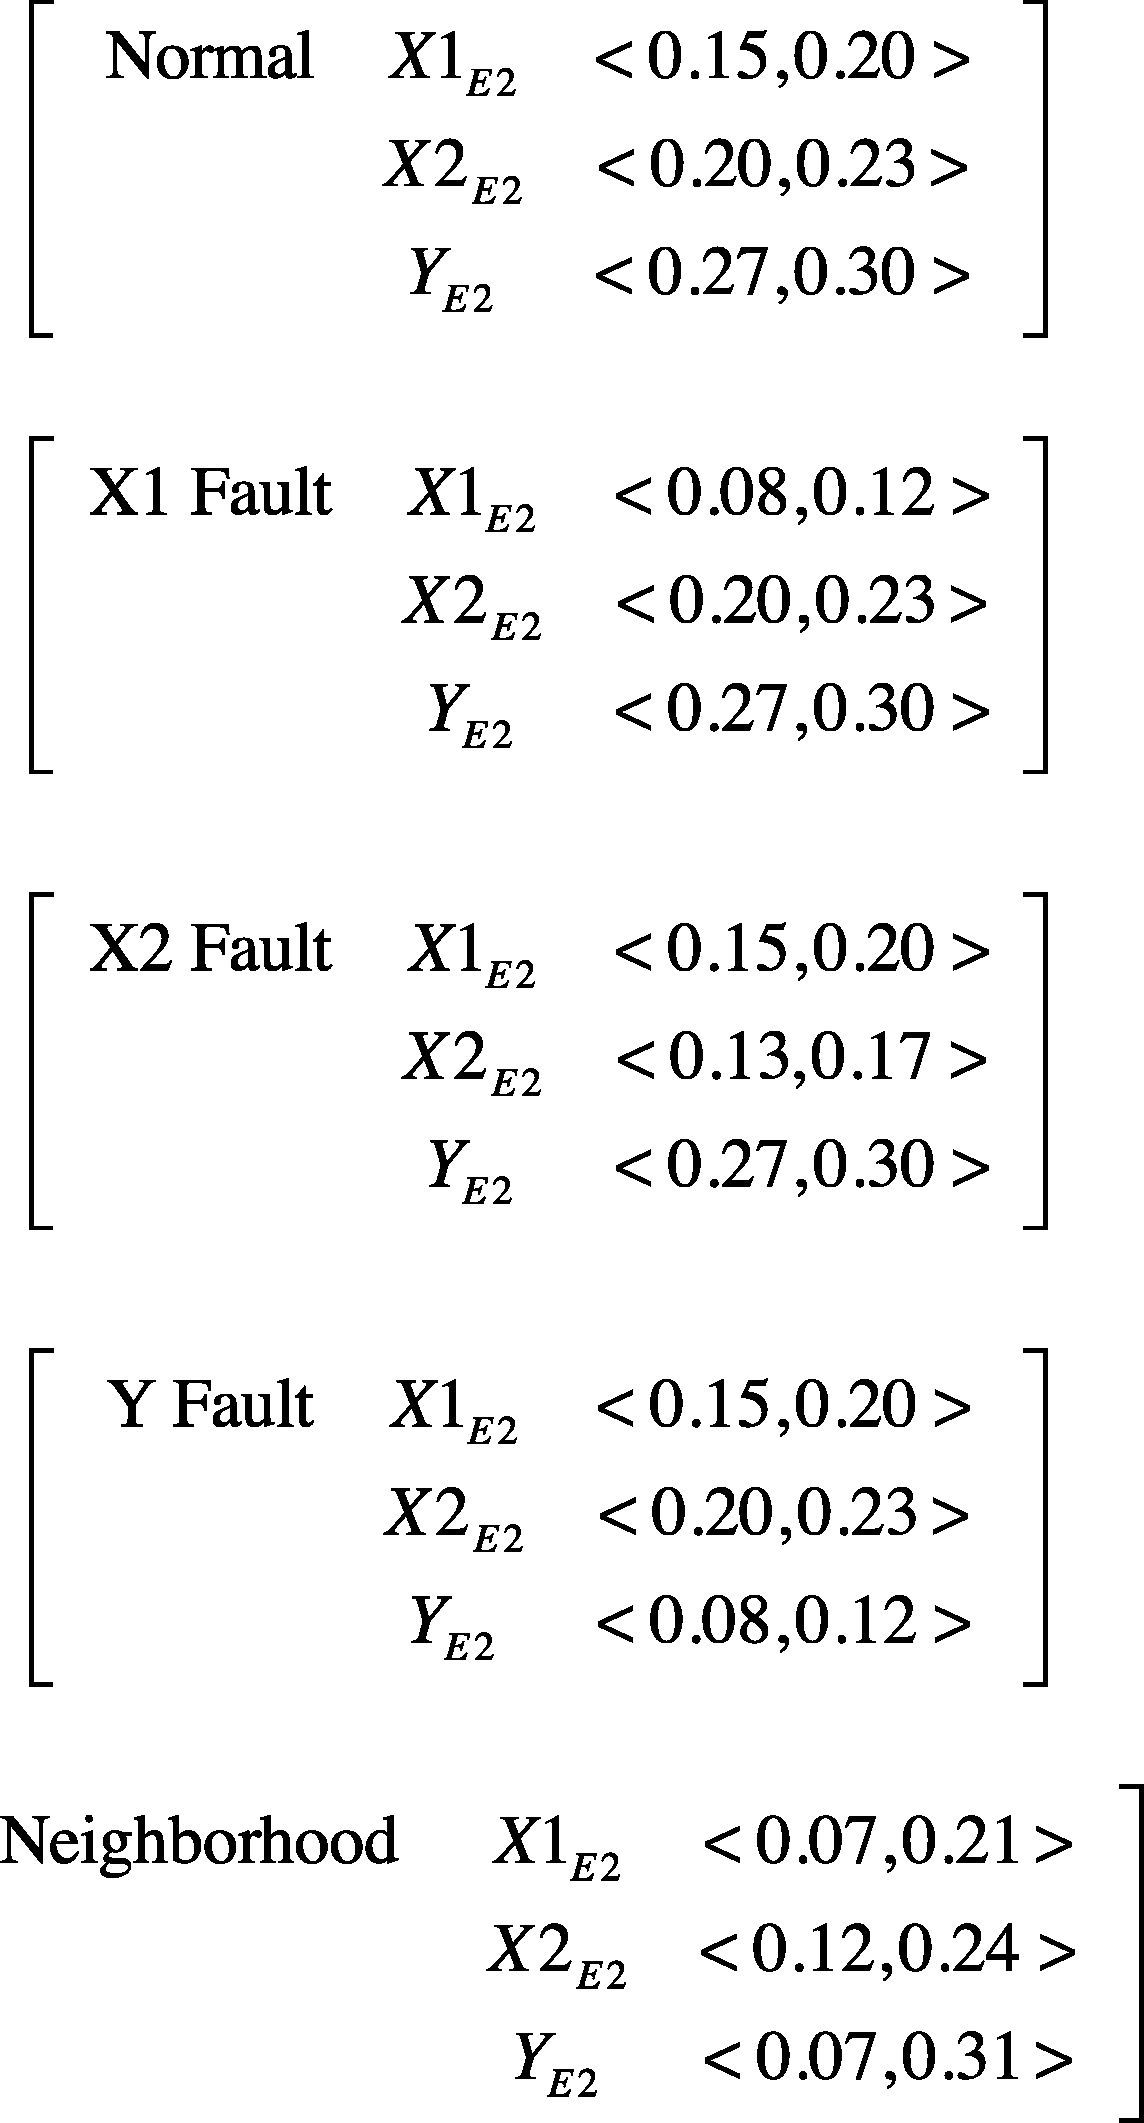
The reduction of E1, E2 and E3 was used as fault feature, and the centroid values of three dynamic error amounts were used as eigenvalues. It was observed that the dynamic error graph rotated centering on0, so the centroid value of each status approached to0. Therefore, the centroid of positive and negative dynamic error values was used as feature. Finally, the distance between positive centroid and negative centroid was used as judgment eigenvalue, so as to reduce the amount of calculation. It was observed that the error amount E2 was most sensitive to the stage fault statuses. Therefore, E2 was used as the matter-element model of fault status, the variation range of E2 in each status was used as classical domain range, and the maximum value and minimum value of classical domain in each status were used as the neighborhood domain range. The matter-element model and neighborhood domain of various faults are shown in Table 1. The weight of three eigenvalues was set as 1/3. Finally, the extension theory can be used to obtain the correlation function of analysis stage and matter-element models. The normalization result was used for judgment. The correlation function1 represents the state of stage.
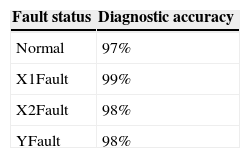
This study used the ADC of dSPACE to extract the stage vibration signal. The ADC extracted signals at frequency of 10kHz. This study also diagnosed the stage at intervals of 1000 data, namely, the stage status was judged per 0.1 sec, so as to implement real-time stage fault monitoring and diagnosis. The computer-side stage diagnosis dSPACE interface is shown in Figure 14. This interface displays the variance in oscillogram and correlation function. The signal map shows the stage vibration signal and the signals representing various motor conditions extracted from the input signals, as well as the normalized correlation function displayed by motors.The stage fault status is judged by this value. In terms of fault detection accuracy rate, there were 10,000 fault status data tested to check the accuracy rate of results. The stage status detection accuracy rate obtained by using the chaos synchronization extension theory proposed in this paper is shown in Table 2. As seen, the fault detection centroid accuracy rate of stage in various statuses is 98%. The results prove that the method proposed in this paper can diagnose four stage fault statuses effectively.
5Conclusions
This study discussed the XXY stage fault detection. The dynamic error amount was extracted from the stage vibration signal by chaos synchronization detection mode. The error amount extracted from each status was used as eigenvalue. The coefficient of correlation between statuses was distinguished by extension calculation, so as to shorten the computing and judgment time. This method is simple and fast, providing better real-time fault diagnosis environment. The experimental results showed that this method can detect stage faults in four statuses by using only one sensor, and the final accuracy rate is 98%, proving that the proposed detection method has good effect on XXY stage.