


Cyanide is a very toxic compound that is released into the environment through industrial effluents; therefore, it needs to be removed prior to wastewater discharge. Adsorption is one of the most widely used treatment methods for removing contaminants from water and wastewater. In present research work response surface methodology was successfully employed for optimization and analysis of the adsorption process. Batch mode experiments were performed to determine the adsorption equilibrium of cyanide in aqueous solution. At optimum condition initial concentration (10mg/l), contact time (1h), adsorbent dose (1g) and pH (8), 90.6% of cyanide adsorption was obtained. The factorial design and RSM analysis demonstrated that the experimental and the predicted values from the models were in agreement.
Organic pollutants have adverse effect on human health and environment. Cyanide is among one of them, and listed as toxic pollutants. It is a singly-charged anion containing unimolar amounts of carbon and nitrogen atoms triply-bounded together (Giraldo & Moreno-Piraján, 2010). Cyanide is a natural compound that is produced by living organisms including bacteria, fungi, algae and plants as part of a defence mechanism against predation (Mekuto, Jackson, & Ntwampe, 2013). However, these natural sources of cyanide are insignificant when compared to cyanide production by anthropogenic activities. Mostly mining, mineral processing, electroplating and plastics industries have significantly contribution to cyanide containing wastewater in the environment (US EPA, 1994). Uncomplexed cyanide, also called free cyanide, is the most toxic form of cyanide in wastewater because it is released as gaseous hydrogen (Osobamiro, 2012). The effects are so momentous to cause nerve damage and thyroid glands malfunctioning and established toxicity level (ASTM, 2006). As an environmentally protective measure, the Environmental Protection Agency (EPA) has placed rigorous limitations (0.1mg/l) on the permitted cyanide concentrations levels in industrial wastewater effluent streams (Abbas, Abbas, & Ibrahim, 2014).
To treat the cyanide contained industrial effluent generally chemical oxidation techniques has been used (Botz, 2001; Dash, Gaur, & Balomajumder, 2009; Parga, Shukla, & Carrillo-Pedroza, 2003). Some other treatment technologies have been also introduced to treat the cyanide-containing wastewaters (Abbas et al., 2014; Hanela, Durana, & Jacobob, 2015; Palmer, Breton, Nunno, & Sulivan, 1988). However, these methods are expensive and hazardous chemicals are used as the reagents processes involving sorption have received greater attention and most widely accepted method for toxic contaminated wastewater (Agarwal, Balomajumder, & Thakur, 2013; Singh, Agarwal, & Balomajumder, 2016). The adsorption shows remarkable performance, including low investment cost, simplicity of design and operation, insensitivity to toxicants and effectiveness with low concentration of adsorbent (Mohammad, 2013). In literature some agricultural waste and by product has been used as absorbent to treat the industrial effluent (Anastopoulos & Kyzas, 2014; Prasad & Santhi, 2012; Singh et al., 2016). The use of biosorbents shows high removal due to primary building block of plant cell walls, lignocellulose contains cellulose, hemicellulose, lignin including little amount of protein, vitamins, lipids, combined with ash (Jorgensen, Kristensen, & Felby, 2007). Since, cyanide is a toxic compound well-known as a metabolic inhibitor, cyanide-containing effluents cannot be discharged without being subjected to treatment in response to increasing health and environmental awareness.
The main aim of this research work is to analyze the efficiency of coffee husk (adsorbent) for the removal of cyanide from synthetic aqueous solution in batch reactors. The adsorption is used for low concentrations of cyanide. The optimization of initial concentration, contact time, mass loading and pH were deliberated via response surface method experimental design. Prepared bioadsorbent has been characterized by scanning electron microscopy (SEM) and Fourier transformed infra red (FTIR).
2Material and methods2.1ChemicalsAll laboratory grade chemicals sodium cyanide, sodium hydroxide, hydrochloric acid were used without further treatment and supplied by Himedia Laboratories Pvt., Mumbai, India.
2.2SampleTo avoid interference with other elements in wastewater, the experiments in this study were carried out using simulated synthetic aqueous solution of different cyanide ion concentrations. To prepare stock solution know amount weight of sodium cyanide dissolved in 1L of millipore water (Q-H2O, Millipore Corp. with resistivity of 18.2MX-cm). The cyanide ion concentrations were measured using UV-spectrophotometer.
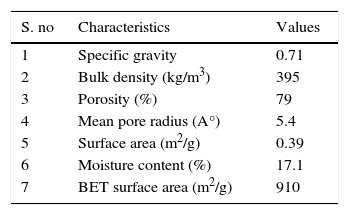
2.3Preparation of adsorbentThe coffee husk was collected from processing unit. It was clean by washing with distilled water. Dilute sulfuric acid, 2% (v/v) and diluted sodium hydroxide, 2% (v/v) were used to pretreat 20g of ground coffee husk biomass. Treatments were performed in triplicate at an autoclaved at 121°C with 15psi (103.4kPa) for 90min. Samples were neutralized with hot deionized water and dried at 60°C overnight to completely remove moisture, then cooled to room temperature and stored in polybags until further use. The adsorbent was used in its original piece size. The chemical property of coffee husk is mention in Table 1.
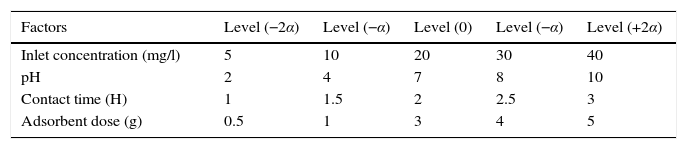
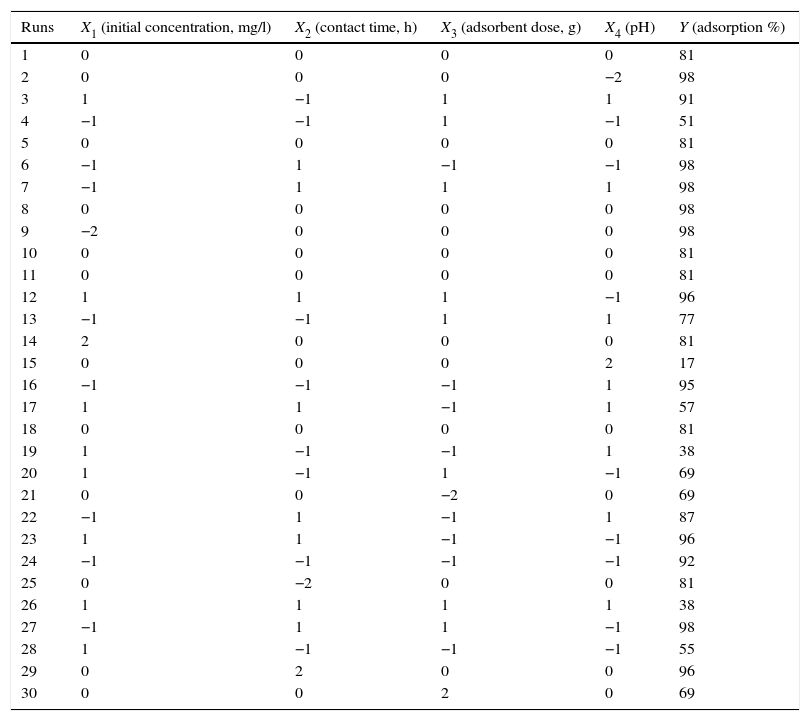
2.4Experimental designA total of 30 experiments have been employed in this work to evaluate the individual and interactive effects of the four main independent parameters on the cyanide adsorption efficiency (Montgomery, 2001). Percentage adsorption has been taken as a response (Y) of the system, while four process parameters, namely, initial concentration 5–40mg/l; pH: 2–10; contact time 1–3h and adsorbent dose 0.5–5g has been taken as input parameters. For statistical calculations, the levels for the four main variables X1(IC), X2(t), X3(g), X4(pH) were coded as xi according to the following relationship:
where X0 is value of Xi at the center point and δX presents the step change. The variables and levels of the design model are given in Table 2. The results of the Y (response) of adsorption were measured according to design matrix listed in Table 3. From experimental observations, it was assumed that the higher order interactions were small relative to the low order.
The different combination of the factors for the experimental design.
| Runs | X1 (initial concentration, mg/l) | X2 (contact time, h) | X3 (adsorbent dose, g) | X4 (pH) | Y (adsorption %) |
|---|---|---|---|---|---|
| 1 | 0 | 0 | 0 | 0 | 81 |
| 2 | 0 | 0 | 0 | −2 | 98 |
| 3 | 1 | −1 | 1 | 1 | 91 |
| 4 | −1 | −1 | 1 | −1 | 51 |
| 5 | 0 | 0 | 0 | 0 | 81 |
| 6 | −1 | 1 | −1 | −1 | 98 |
| 7 | −1 | 1 | 1 | 1 | 98 |
| 8 | 0 | 0 | 0 | 0 | 98 |
| 9 | −2 | 0 | 0 | 0 | 98 |
| 10 | 0 | 0 | 0 | 0 | 81 |
| 11 | 0 | 0 | 0 | 0 | 81 |
| 12 | 1 | 1 | 1 | −1 | 96 |
| 13 | −1 | −1 | 1 | 1 | 77 |
| 14 | 2 | 0 | 0 | 0 | 81 |
| 15 | 0 | 0 | 0 | 2 | 17 |
| 16 | −1 | −1 | −1 | 1 | 95 |
| 17 | 1 | 1 | −1 | 1 | 57 |
| 18 | 0 | 0 | 0 | 0 | 81 |
| 19 | 1 | −1 | −1 | 1 | 38 |
| 20 | 1 | −1 | 1 | −1 | 69 |
| 21 | 0 | 0 | −2 | 0 | 69 |
| 22 | −1 | 1 | −1 | 1 | 87 |
| 23 | 1 | 1 | −1 | −1 | 96 |
| 24 | −1 | −1 | −1 | −1 | 92 |
| 25 | 0 | −2 | 0 | 0 | 81 |
| 26 | 1 | 1 | 1 | 1 | 38 |
| 27 | −1 | 1 | 1 | −1 | 98 |
| 28 | 1 | −1 | −1 | −1 | 55 |
| 29 | 0 | 2 | 0 | 0 | 96 |
| 30 | 0 | 0 | 2 | 0 | 69 |
Experimental procedure batch experiments for optimization of process parameters were carried out in 250mL round bottom flasks with working volume of 100mL at 120rpm in an incubator cum orbital shaker. A measure amount of adsorbate was added in measure initial concentrated of cyanide solution. The experiment carried out in room temperature (21°C). The pH of solution was readjusted with 1N NaOH or HCl during operation. The amount of cyanide adsorbed per unit mass of the adsorbent was evaluated by the following mass balance equation:
where C0 is the initial pollutant concentration (mg/l) and Ct is the pollutant concentration (mg/l) at time t, V is the volume of the solution (L) and M is the mass of the adsorbent used (g).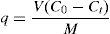
The adsorption efficiency was calculated by the following equation:
where C0 is initial concentration of cyanide in solution and Ct is finial concentration in time (t).2.5Analysis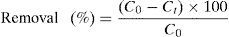
Fourier transform infrared (FTIR) spectroscopic analysis was performed (FTIR-2000, Perkin Elmer) to determine functional group in adsorbent. The spectra were measured from 4000 to 500cm−1. The surface area, total pore volume, and average pore diameter of the samples were determined from the adsorption isotherms of nitrogen at 77K using Autosorb I, supplied by Quantachrome Corporation, USA. The surface morphology of the sample was examined using scanning electron microscope (Model VPFESEM Supra 35VP). Proximate analysis was carried out using thermo gravimetric analyzer (TGA) (Model Perkin Elmer TGA7, USA).
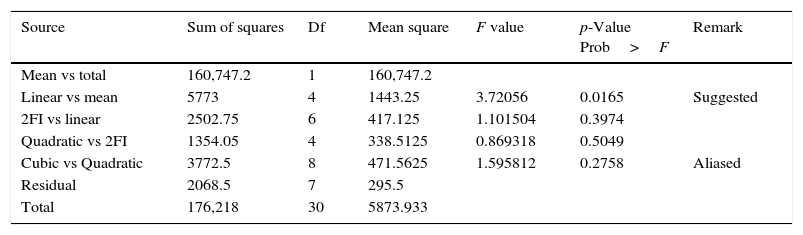
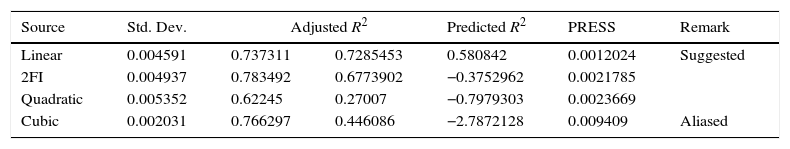
3Result and discussion3.1Model fitting and statistical analysisThe central composite design (CCD) was employed to fit a second-order polynomial model and to obtain an experimental error. The CCD was applied with four design factors and five levels, to study the affect of initial concentration, contact time, adsorbent dosage and pH on adsorption efficiency with coffee husk. The results of the Y (response) of adsorption were measured according to design matrix and the measured responses are listed in Table 3. Linear, interactive, quadratic and cubic models were fitted to the experimental data to obtain the regression equations. Two different tests namely sequential model sum of squares and model summary statistics were employed to decide about the adequacy of various models to represent adsorption with coffee husk. Results of these tests are given in Tables 4 and 5, for percentage adsorption removal respectively. Cubic model was found to be aliased. For quadratic and linear models, p value was lower than 0.02, and both of these could be used for further study as per sequential model sum of squares test. As per model summary statistics, the quadratic model was found to have maximum adjusted R2 0.73, and predicted R2 0.59 values excluding cubic model which was aliased. Therefore, quadratic model was chosen for further analysis. To determine whether or not the quadratic model is significant, it is crucial to perform analysis of variance (ANOVA) mention in Table 6. The probability (p-values) values are used as a device to check the significance of each coefficient, which also shows the interaction strength of each parameter (smaller the p-values bigger significance of the corresponding coefficient) (Mohana, Shrivastava, Divecha, & Madamwar, 2008).
Sequential model sum of squares.
| Source | Sum of squares | Df | Mean square | F value | p-Value Prob>F | Remark |
|---|---|---|---|---|---|---|
| Mean vs total | 160,747.2 | 1 | 160,747.2 | |||
| Linear vs mean | 5773 | 4 | 1443.25 | 3.72056 | 0.0165 | Suggested |
| 2FI vs linear | 2502.75 | 6 | 417.125 | 1.101504 | 0.3974 | |
| Quadratic vs 2FI | 1354.05 | 4 | 338.5125 | 0.869318 | 0.5049 | |
| Cubic vs Quadratic | 3772.5 | 8 | 471.5625 | 1.595812 | 0.2758 | Aliased |
| Residual | 2068.5 | 7 | 295.5 | |||
| Total | 176,218 | 30 | 5873.933 |
Model summary statistics.
| Source | Std. Dev. | Adjusted R2 | Predicted R2 | PRESS | Remark | |
|---|---|---|---|---|---|---|
| Linear | 0.004591 | 0.737311 | 0.7285453 | 0.580842 | 0.0012024 | Suggested |
| 2FI | 0.004937 | 0.783492 | 0.6773902 | −0.3752962 | 0.0021785 | |
| Quadratic | 0.005352 | 0.62245 | 0.27007 | −0.7979303 | 0.0023669 | |
| Cubic | 0.002031 | 0.766297 | 0.446086 | −2.7872128 | 0.009409 | Aliased |
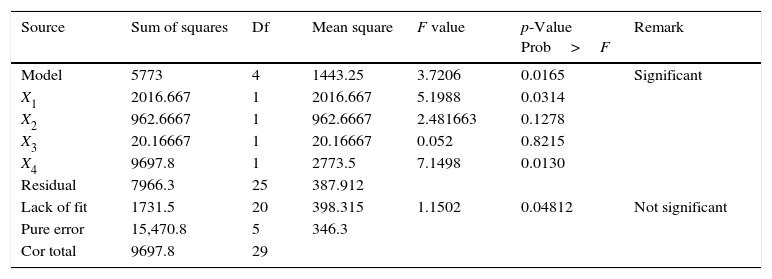
Analysis of variance.
| Source | Sum of squares | Df | Mean square | F value | p-Value Prob>F | Remark |
|---|---|---|---|---|---|---|
| Model | 5773 | 4 | 1443.25 | 3.7206 | 0.0165 | Significant |
| X1 | 2016.667 | 1 | 2016.667 | 5.1988 | 0.0314 | |
| X2 | 962.6667 | 1 | 962.6667 | 2.481663 | 0.1278 | |
| X3 | 20.16667 | 1 | 20.16667 | 0.052 | 0.8215 | |
| X4 | 9697.8 | 1 | 2773.5 | 7.1498 | 0.0130 | |
| Residual | 7966.3 | 25 | 387.912 | |||
| Lack of fit | 1731.5 | 20 | 398.315 | 1.1502 | 0.04812 | Not significant |
| Pure error | 15,470.8 | 5 | 346.3 | |||
| Cor total | 9697.8 | 29 |
In addition to analyzing the independent variables’ effects, this experimental methodology also generates a mathematical model. The graphical viewpoint of the mathematical model has led to the term RSM. The relationship between the responses and the inputs is given in the following equation:
where Y is the response; f is the unknown function of response; X1, X2, X3, …, Xn are the input variables, which can affect the response; n is the number of the independent variables, and ¿ is the statistical error that represents other sources of variability not accounted for by f.
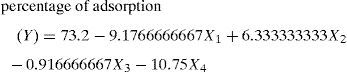
After selection of the design, the model equation is defined and coefficients of the model equation are predicted. Design summary for adsorption with five levels and four factors; the design model of the experiments is quadratic polynomial and the center point is zero using design expert 6.0.8 software. A manual regression method was used to fit the second order polynomial given by Eq. (5), respectively to the experimental data and to identify the relevant model terms. The final equation obtained in terms of coded factors is given below:
The statistical significance of the ratio of mean square variation due to regression and mean square residual error was tested using ANOVA (Myers, Montgomery, & Anderson-Cook, 2016). The Model F-value of 3.72 implies the model is significant. There is only a 1.65% chance that a “Model F-value” this large could occur due to noise. Values of “Prob>F” less than 0.05 indicate model terms are significant. In this case initial concentration and pH are significant model terms. Values greater than 0.10 indicate the model terms are not significant; this includes contact time and adsorbent dose. The “F-value” 1.15 of lack of fit implies that model is not significant relative to the pure error. There is a 4.81% chance that a “F-value” could occur due to noise. Non-significant lack of fit is good because the model has to fit. In summary, theANOVA analysis demonstrated that thequadratic regression model could effectivelypredict the adsorption process of phenolicwastewater.
3.2Effect of factors on the responseThe percentage adsorption of cyanide increased with an increase in contact time and the equilibrium time varied for different concentrations, which presented in Figure 1. The time required to attain equilibrium for 10 and 20mg/l of cyanide concentration was 2h. The maximum percentage adsorption are 99% for 5mg/l, 10mg/l; 98% for 20mg/l, 96% for 30mg/l and 89% for 40mg/l. This is fact that at the beginning no of vacant site are more with increase in time and concentration vacant site were disappeared. The same trend also observed when coconut husk was used at 30mg/l cyanide initial concentration (Singh et al., 2016), granular activated carbon at 100mg/l initial concentration (Agarwal et al., 2013) and eucalyptus bark for zinc at 70ppm initial concentration (Afroze, Sen, & Ang, 2016).

From Figure 2(a) it was observed that as the concentration increased from 5 to 40mg/l, the rate of adsorption decreased at low level from 93 to 47%. In this way cyanide concentration showed an inverse relation with adsorption, i.e. maximum adsorption occurs at minimum concentration of cyanide. It may be due to greater number of ions in the solution causes more number of collisions and thus leading to desorption of ions from the binding sites of adsorbent particles. Whereas with limited number of ions there are limited number of collision between the ions that is why low concentration showed higher rates of adsorption (Vedula, Dalal, & Majumder, 2013). The initial pH of sample play significant role on removal efficiency of cyanide solution, it was adjusted between pH 2 and 10 shown in Figure 2(b). Maximum adsorption of cyanide ion observed at higher pH of sample. It attributes the interactions of ions with adsorbed functional groups on the adsorbent surfaces those are weaker than interactions with the surface hydroxyls of the sorbent. At an optimum pH of 10, over 99% removal of 100mg/l cyanide was obtained for (adsorbent) pistachio hull wastes dose of 1.5g/l after a 60min contact time (Moussavi & Khosravi, 2010). In literature author found that the adsorption of sodium cyanide was increase from 45.2% to 61.7% at pH 4–11 and 100mg/l of initial concentration in commercial activated carbon. This may be due to pH of the solution, influence the adsorbent surface charge and the ionization degree with speciation of different pollutants (Dash, Dash, & Balomajumdar, 2014). At a low pH the de-protonation on coffee husk surface provides functional groups, for chemisorptions on its surface that can undergo ion exchange type of interaction with cyanide ions, due to that lower percentage of adsorption values observed. Solutes interact with sorbent surfaces because they have acquired an electrical surface charge (Stavropoulos, Skodras, & Papadimitriou, 2015).
 Effect of initial concentration of cyanide with contact time (3D). (b) Effect of initial concentration of cyanide with pH (3D). (c) Effect of initial concentration of cyanide with dose (3D).")
Effect of coffee husk dosage on adsorption was investigated by changing the sorbent dose from 0.5 to 5g with different initial concentration, shown in Figure 2(c). The removal efficiency of cyanide increased when sorbent dose increased from 1 to 3g for initial concentration of 5, 10 and 20mg/l and 4g dose for initial concentration of cyanide 30 and 40mg/l. At a low sorbent dose, e.g. 0.5g, the available sorption sites were quite insufficient compared with the large amount of cyanide ions in solution, resulting in low removal efficiency (Gupta, Balomajumder, & Agrawal, 2012). At a higher sorbent dose, e.g. 5g, the sorption sites were sufficient and a further increase in sorbent dose did not lead to a significant increase in the cyanide removal from aqueous solution. This may be due to accumulation of biosorbent particle resulting in decrease in surface area existing for biosorption (Kilic, Apaydin-Varol, & Pütün, 2011). Achievement of high cyanide removal percentage with a relatively low adsorbent dose indicates the high affinity and suitability of coffee husk for removal of cyanide from wastewater. The increasing adsorption efficiency with increasing coffee husk dose can be attributed to the increase in surface area and by extension the greater number of exchangeable sites available for interaction with cyanide ions (Moussavi & Khosravi, 2010). Similarly by using coffee husk (97% adsorption), coconut shell and commercial activated (99% adsorption) at initial cyanide concentration of 260mg/l, dose of 10g/l, and a pH of 11.0 was observed (Halet et al., 2015).
3.3OptimizationIn the present study, for numerical optimization, the optimum response result was 90.6%, percentage adsorption. The optimum processing conditions using numerical optimization were the coded levels (−1, −1, −1, −1) or initial concentration (10mg/l), contact time (1h), adsorbent dose (1g) and pH (8) and is shown in Figure 3(a). The response prediction desirability is found to be very good (0.976) as compared to the ultimate desirability of 1. The desirability is plotted using 3D plot as shown in Figure 3(b).
3.4Adsorption isotherm model desirability 3D plot (b) optimized percentage adsorption for sawdust.")
An isotherm equilibrium model represents the relationship between the cyanide adsorbed onto coffee husk (adsorbent) at given experimental conditions. The equation used for adsorption isotherm indicates the diffusion of adsorbate from liquid phase to the solid phase at equilibrium condition (Al-Asheh, Banat, Al-Omari, & Duvnjak, 2000). Thus the correlation of equilibrium data is required for interpretation. Different isotherm model namely the Langmuir, Freundlich, and Temkin, were applied to fit the experimental isotherm data of cyanide adsorption on activated carbons has been proposed (Adhoum & Monser, 2002; Dash et al., 2014). Among the entire model Langmuir is widely studied for adsorption and used for present study. The non-linear form of the Langmuir isotherm model is represented by the subsequent equation (Langmuir, 1918) mention in the following equation:
where ‘Ce’ is the equilibrium concentration and ‘qe’ is the amount of adsorbate adsorbed per gram of adsorbent at equilibrium; ‘Q0’ and ‘b’ are Langmuir constants related to the sorption capacity and intensity respectively. The experimental equilibrium data for cyanide adsorption on prepared activated carbons at 21°C, calculated from Eq. (6). By plotting Ce/qe versus Ce, b and Q0 can be determined when a straight line is obtained. The value of Q0 and b values were calculated from the slope and intercept of the straight line, respectively. The equilibrium of the adsorbent was fitted very well to the Langmuir isotherm shown in Figure 4. The Langmuir adsorption isotherm of cyanide on coffee husk gave the correlation coefficient was 0.975. The values were found to follow the Langmuir isotherm to some extent, depending on the pH mostly (Foo & Hameed, 2010). The feasibility of the Langmuir model was further assessed using the equilibrium dimensionless parameter separation factor (RL).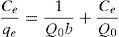
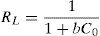

The values of RL define the favorability of adsorption process (Hall, Eagleton, Acrivos, & Vermeulen, 1966). If the RL=1 indicated linear, RL>1 indicates unfavorable, RL=0<RL<1 indicates favorable and RL=0 indicates irreversible. In this experiment all the value of RL was found to be less than one for initial concentration 5mg/l to 40mg/l of cyanide.
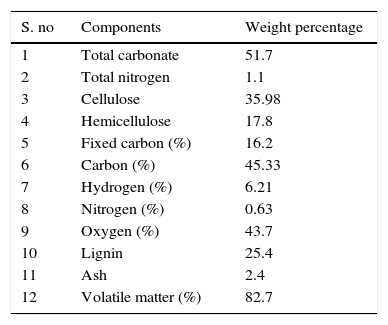
3.5Characteristics of the adsorbentThe percentage composition of coffee husk is mention in Table 7 and shown in Figure 5. The peak shows 35.98% of cellulose 17.8% hemicellulose, 25.4% lignin, ash 2.4% and other element. Due to this self developed biochemical property of coffee husk; cyanide accumulates from wastewater through metabolically mediated pathways of uptake. From Table 7 it can also see that hydrogen is available in relatively large percentage in comparison to nitrogen compounds indicates that carbon-hydrogen groups might be available for adsorption of cyanide. The relatively low percentage of nitrogen shows that very less percentage of protein might be present in the husks. This is advantageous over protein-rich adsorbents since portentous materials are likely to putrefy under moist conditions.
Physicochemical characteristic of coffee husk.
| S. no | Components | Weight percentage |
|---|---|---|
| 1 | Total carbonate | 51.7 |
| 2 | Total nitrogen | 1.1 |
| 3 | Cellulose | 35.98 |
| 4 | Hemicellulose | 17.8 |
| 5 | Fixed carbon (%) | 16.2 |
| 6 | Carbon (%) | 45.33 |
| 7 | Hydrogen (%) | 6.21 |
| 8 | Nitrogen (%) | 0.63 |
| 9 | Oxygen (%) | 43.7 |
| 10 | Lignin | 25.4 |
| 11 | Ash | 2.4 |
| 12 | Volatile matter (%) | 82.7 |

Scanning electron microscopy (SEM) is extensively used to study the surface morphology and characteristics of the biosorbent. In this present study, the surface morphologies of coffee husk before and after adsorbing cyanide were associated by SEM analysis. The smooth morphology and porous structure of CH shown in Figure 6(a) and (b) make it suitable biosorbent as it increases the biosorption capacity. The SEM micrographs Figure 6(a) indicates the occurrence of numerous pores on the biosorbent surface, pores size may be about 1–2μm of diameters and a uneven structure onto surface with a huge surface area. From Figure 6(b), it could evaluate that small particle adhere to the CH surface. This may be due to the occurrence of cyanide onto CH surface. This is assumed to be effective biosorption of phenol and cyanide onto coffee husk surface.
 before adsorption and (b) after adsorption process.")
Biomass has become a promising alternative source of materials for industrial applications (Xu, Yu, Tesso, Dowell, & Wang, 2013). The FTIR spectrum of the coffee husk show characteristics band of lignocellulosic materials, shown in Figure 7. A strong broad OH band in ∼3350cm−1 (lignin); a band in ∼2650cm−1 (lignin), revealed to a CH; a band in ∼1750cm−1 ketone group (hemicellulose), revealed to a CO; a band in ∼1582cm−1 revealed to a CC stretching vibrating in aromatics (cellulose, hemicellulose) and a band in ∼1100 to 950cm−1revealed to a CO of cellulose, hemicelluloses and lignin. These regions also indicate the presence of CN stretching vibrating. These bands indicate the possible involvements of these functional groups on the surface of coffee husk in cyanide adsorption process (Sathishkumar, Arulkumar, & Palvannan, 2006). Coffee husk surface chemistry were found to be different as some of the functional groups disappeared due to the activation process, which shows that these functional groups were thermally unstable. From Figure 7 after treatment curve, there is a decrease in the absorption band of aromatic group from CH due to oxidative degradation of aromatic rings during chemical impregnation and heat treatment stages.
4Conclusion
From the above result it may be concluding that activated coffee husk is effective for cyanide adsorption. On the basis of RSM approach for experimental design and fitness of polynomial equation, optimal conditions maximum 90.6% cyanide adsorption were found at 10mg/l initial concentration, 1h contact time, 1g adsorbent dose and pH 8. Analysis of variance showed a high coefficient of determination value (Ad-R2=0.73 and Pre-R2=0.59), thus, ensuring a satisfactory adjustment of the second-order regression model with the experimental data. The FTIR study shows reduction in functional group in coffee husk after application. Scanning electron micrograph shows high porous structure of coffee husk. The XRD spectra show the availability of cellulose, hemicellulose and other element on the surface of coffee husk. The outcome of this research work is that the present biosorbent (coffee husk) can be useful for the cyanide adsorption from effluents discharged at low concentration.
Conflict of interestThe authors have no conflicts of interest to declare.
Peer Review under the responsibility of Universidad Nacional Autónoma de México.