


El trastorno por déficit de atención con hiperactividad (TDAH) es uno de los trastornos que más condiciona el aprendizaje escolar, la calidad de la concentración y la capacidad de autorregulación y control. El DSM-IV-TR establece los criterios más comúnmente aceptados para su diagnóstico (Inatento: TDAH-I, Hiperactivo/impulsivo: TDAH-HI y Combinado: TDAH-C), pero actualmente diversos estudios discrepan si abordarlo como un continuo con diferentes grados de intensidad (estructura de subtipos) o como trastornos específicos (perfiles contrapuestos). Investigaciones previas, han contrastado la hipótesis de las categorías diferenciales con medidas de ejecución y activación cortical. Ahora, el objetivo que se plantea es confirmar estos resultados, incorporando una nueva medida, la aportada por el nir-HEG (hemoencefalografía), con el fin de controlar la activación cortical a partir de los niveles de oxigenación sanguínea. Para ello, se toma una muestra de 205 sujetos de entre 8 y 13 años (105 grupo control, 28 TDAH-I, 35 TDAH-HI y 37 TDAH-C), a los que se aplica un test de ejecución continua (TOVA), un EEG cuantificado (Q-EEG) y un hemoencefalograma (nir-HEG). Los resultados reflejan la contraposición de perfiles frente a la hipótesis de los grados de intensidad, aunque esta última sea la más habitual y generalizada.
Attention Deficit Hyperactivity Disorder (ADHD) is one of the disorders causing the greatest impact, conditioning academic learning, quality of concentration, and capacity for self-regulation and control. The Diagnostic and Statistical Manual of Mental Disorders-IV (DSMIV-TR) establishes the most commonly accepted criteria for diagnosis (Inattentive: ADHD-I, Hyperactive/impulsive: ADHD-HI, and Combined: ADHD-C), but currently, diverse studies disagree about whether to address it as a continuum with different degrees of intensity (subtype structure) or as specific disorders (counterposed profiles). Prior research has tested the hypothesis of differential categories with performance measures and cortical activation. The goal proposed herein is to confirm these results, incorporating a new measure, near-infrared hemoencefalography (nir-HEG), in order to control cortical activation through levels of blood oxygenation. For this purpose, we used a sample of 205 children between 8 and 13 years (105 control group, 28 with ADHD-I, 35 with ADHD-HI, and 37 with ADHD-C), administering a continuous performance test (TOVA), quantified electroencephalogram (Q-EEG), and nir-HEG. Results reflect the counterposed profiles hypothesis instead of the degrees of intensity, although the latter is more habitual and generalized.
Pagina nueva 1
Attention Deficit with Hyperactivity Disorder (ADHD) is frequent in childhood and is one of the disorders with the greatest impact on school performance. According to the Diagnostic and Statistical Manual of Mental Disorders-IV-TR (DSM-IV-TR, American Psychiatric Association, 2000), between 3 and 7% of school-aged children suffer this disorder, which is diagnosed approximately three times more frequently in boys than in girls. It is characterized by a persistent behavioral pattern of inattention, excess of activity (or hyperactivity), and difficulties to control impulses (or impulsivity), leading to the differentiation of three subtypes (American Psychiatric Association, 2000): subtype with predominance of attention deficit (ADHD-I), subtype with predominance of hyperactivity-impulsivity (ADHD-HI), and combined subtype (ADHD-C).
ADHD subtypes are currently known to differ according to age at onset, evolution of symptomatology, prevalence by gender, and comorbidity. The most marked differences among them involve behavior, attention, and social relations, suggesting the existence of differences in the underlying neurobiology, which can be assessed with specific neuropsychological tests performed to identify the neurobiological substrates of these differences (Solanto, Schulz, Fan, Tang, & Newcorn, 2009). Both ADHD subtypes (ADHD-C and ADHD-HI) have problems inhibiting responses, generally displaying higher levels of commission errors in continuous performance tests (CPT) (Hasson & Fine, 2012). However, it is unclear whether neuropsychological assessment can clearly differentiate ADHD subtypes or show evidence of different executive functioning profiles. ADHD is diagnosed through behavioral scales at best, and often by clinical criteria. In this vein, other studies support this idea, concluding that neuropsychological tests should be used with caution as ADHD tools, but that they hold promise for identifying core cognitive deficits and processes that can aid prevention, and age-dependent co-morbidities and intervention (Pineda, Puerta, Aguirre, Garcia-Barrera, & Kamphaus, 2007; Thome et al., 2012).
These findings indicate differential behavioral patterns in the subtypes, supported by reports derived from brain images showing atypical frontal activity during the inhibitory process in children with ADHD-HI (Rubia et al., 2010). Solanto et al. (2009) also used functional magnetic resonance imaging (fMRI) and an inhibitory control test (go/no-go) to provide evidence that the phenotypic differences between ADHD-C and ADHD-I are associated with differential activation of regions that had been previously implicated in the physiopathology of ADHD, and are believed to mediate executive and attentional processes.
Neurological methods in the study of ADHD, in particular, functional and structural neuroimaging techniques (PET, fMRI, SPECT, MEG), have allowed us to establish some basic principles for the design of specific studies. In this study, we will use quantitative analysis of the electroencephalogram (Q-EEG) and hemoencephalography (nir-HEG), due to its lower cost, duration and high correlation with blood flow (Toomin, 2002). In a previous investigation about Q-EEG, González-Castro et al. (2010) analyzed the existence of specific patterns of cortical activation (Q-EEG) and CPT (executive control) for ADHD subtypes. This study empirically showed that children diagnosed with ADHD-I, ADHD-HI, and ADHD-C obtained significantly different scores in the variables of central cortical (Cz) and left prefrontal (Fp1) activation, as well as in diverse variables of executive control.
By means of these techniques, Bresnahan, Anderson, and Barry (1999) associated hyperactivity with a decrease in the electrical activity or beta rhythm, and impulsivity with an increase of beta rhythm/theta activity in subjects with ADHD. Clarke, Barry, McCarthy, and Selikowitz (2001), however, found three different profiles: a) an increase of slow waves and a deficiency of fast waves (general level of brain activation), b) an increase of the amplitude of the theta wave (related to inattention) and a decrease of beta (impulsivity), and c) an excess of beta (high cortical activation). These profiles suggest the existence of heterogeneity in the electrophysiological components, perhaps due to a delay in brain electric maturation or to the existence of abnormal electroencephalographic patterns. Along this vein of investigation, various authors (Álvarez, González-Castro, Núñez, González-Pienda, & Bernardo, 2008; Angelakis, Lubar, & Stathopoulou, 2004; Clarke et al., 2001; Swartwood, Swartwood, Lubar, & Timmerman, 2003) use the beta/theta ratio as a measurement index, taking into account that this has the highest correlation with cerebral blood flow, measured by the Single Photon Emission Computed Tomography (SPECT). However, Snyder et al. (2008) do not recommend the use of the quantified Electroencephalograph (EEG) as an independent diagnosis, but rather as a complement to a more extensive clinical assessment (Millichap, Millichap, & Stack, 2011).
On the other hand, neuronal activity can be recorded by changes in the blood flow (hemodynamic changes) by using different procedures from specific neuroimaging, such as hemoencephalography (HEG) (Tinius, 2004; Toomim, 2002; Toomim et al., 2004). HEG is still an infrequent technique in the field of ADHD and, in any case, assigned to the field of neurofeedback therapy. However, the last 10 years have witnessed the development of a technique known as nir-HEG (Legarda, McMahon, Othmer, & Othmer, 2011; Serra-Sala, Timoneda-Gallart, & Pérez-Álvarez, 2012; Tinius, 2004). Nir-HEG allows the measurement of hemodynamic changes, which are translated into changes in neuronal cellular activity. There is a correlation between blood flow activity in an area of the brain and the activity of the cells dependant on the blood, a phenomenon known as ''neurovascular coupling.'' The aforementioned procedure measures changes in the relationship between the variable absorption of infrared light and the non-variable absorption of red light (Toomim, 2002; Toomim et al., 2004). Similarly, Rodríguez, Fernández-Cueli, González-Castro, Álvarez, and Álvarez-García (2011), compared the relationship between cortical activation (Q-EEG) and executive control (TOVA) with another indicator related to blood oxygenation (near-infrared hemoencefalography -nir-HEG-). Significant differences were observed in nir-HEG between ADHD-C and ADHD-I at Fp1. In order to value these nir-HEG recordings for a longer interval, a study was recently conducted in which the variables were recorded during the entire 20-minute duration of the TOVA (Cueli et al., 2013). Results showed a high degree of balance in the nir-HEG measures across the interval.
All things considered, our first goal was to analyze the differences in performance and activation measures (electrical activity and blood oxygenation) of children with ADHD compared with a control group. Our second goal is to attempt to reveal the different profiles of each subtype of the disorder in executive control, electrical activity, and blood oxygenation.
Concerning activation, the proposed hypothesis is that ADHD-I and ADHD-C subtypes will present significantly lower blood flow (nir-HEG ratio) at central prefrontal cortex (Fpz) than those observed in ADHD-HI subtype and controls. Furthermore, cortical activation measured with the beta-theta ratio (Q-EEG) will present similar profiles at Cz in ADHD-I and ADHD-C. ADHD-HI and ADHD-C subtypes will show a significantly lower blood flow (nir-HEG ratio) at Fp1 than those observed in ADHD-I subtype and controls. Cortical activation measured with the beta-theta ratio (Q-EEG) will present similar profiles at Fp1 in ADHD-HI and ADHD-C.
Concerning performance, ADHD-I and ADHD-C subtypes will present significantly higher levels of omissions and longer RT than those obtained by ADHD-HI subtype and controls. ADHD-HI and ADHD-C subtypes will present significantly higher levels of commissions and variability than those obtained by ADHD-I subtype and controls. ADHD-C subtype will present a significantly higher ADHD score than that obtained by ADHD-HI subtype, which, in turn, will be significantly higher than that obtained by ADHD-I subtype. The control group will obtain the lowest levels in this variable.
Method
Participants
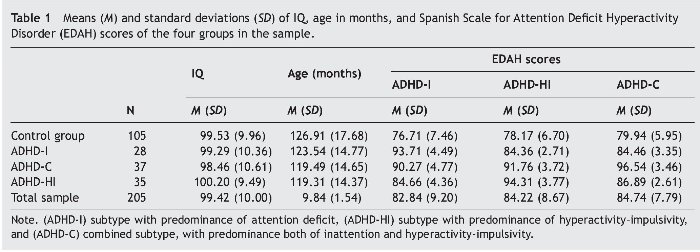
In this study, sample were 205 children, 83 females (40.5%) and 122 males (59.5%), aged between 8 and 13 years, classified into 4 groups according to their personal characteristics (Table 1): ADHD-I group (n = 28; 11 males and 17 females), ADHD-HI group (n = 35; 24 males and 11 females ), ADHD-C group (n = 37; 27 males and 10 females), and control group (n = 105; 60 males and 45 females).

All participants had an IQ higher than 80 (WISC-IV; Wechsler, 2004). They all attended public and subsidized schools in Asturias (Spain) and none were undergoing pharmacological treatment. ADHD participants had been previously assessed by their pediatrician or neuro-pediatrician of reference, according to the criteria of the DSM-IV-TR (American Psychiatric Association, 2000). ADHD subtype assessment included the Diagnostic Interview Schedule for Children DISC-IV (Shaffer, Fisher, Lucas, Dulcan, & Schwab, 2000) with the parents and the child. The interview included developmental history, playroom observation, and an extensive neuropediatric examination. All healthy controls underwent the same diagnostic assessment to rule out any psychiatric disorders.
To ensure the correct assignment of the students to their respective groups, Farré and Narbona's (1997) Spanish Scale for ADHD (EDAH) was administered to the participants' parents. In the next step, each student was assigned to an ADHD group when the clinic and subtype diagnoses of ADHD questionnaire (higher than 90%) coincided. We compared the variables of the subtypes classified by EDAH (Farré & Narbona, 1997), finding statistically significant differences in the multivariate contrasts (MANOVAs), Wilks' λ = .120, F9, 484 = 74.7, p = .000, η2 = .506. The tests for between-subject effects confirmed differences for the EDAH variable ADHD-I, F3, 205 = 80.0, p = .000, η2 = .544; ADHD-HI, F3, 205 = 108.81, p = .000, η2 = .619, and ADHD-C, F3, 205 = 111.23, p = .029, η2 = .624.
The results revealed no significant group differences as a function of IQ in the four groups. Although there were group differences as a function of age between control and ADHD-HI, t138 = 2.30, p = .023, and between control and ADHD-C, t140 = 2.29, p = .023. But there were no group differences between control group and ADHD-I (p = .355), ADHD-I and ADHD-HI (p = .257), ADHD-I and ADHD-C (p = .276), or ADHD-HI and ADHD-C (p = .260). There were also small but significant sex differences (c2 = 8.97, p = .030).
The study was conducted in accordance with The Code of Ethics of the World Medical Association (Declaration of Helsinki) for experiments involving humans. All subjects and their parents gave written informed consent after receiving a comprehensive description of the study protocol. The participants came from families of medium socioeconomic status and were Caucasian. Finally, all subjects who presented cognitive deficit, comorbidity with behavioral disorders, Asperger syndrome, Guilles de la Tourette syndrome, anxious depressive disorders or learning disabilities were eliminated from the study.
Instruments
— The nir-HEG (Toomim et al., 2004) is a tool used to measure blood oxygenation in expressly selected areas. The nir-HEG employs the translucent property of biological tissue, and low-frequency red and infrared lights with light emitting diodes (LED optodes). The source of light and the light receptor (optode) are mounted on a headband 3 centimeters apart. The band should be carefully placed so that no external light enters. It is important to highlight that, in contrast with the EEG method, low muscular tension or small subject movements do not affect nir-HEG measurements. Other possible sources of error were researched and were found to be minimal (Toomim, 2002). Only around 5 to 10% of nir-HEG readings come from the skull skin or tissue because these regions of the body have little blood flow in comparison with brain tissue. The depth of effective penetration in the highly vascular cortical tissue is approximately 1.5 cm below the midpoint between the optodes. The entrance and exit light areas are 0.052 cm2 at the skin surface. The light entrance and exit points and the refractive and scattering qualities of the tissue form a banana-shaped light field.
The lights are emitted alternately onto the surface of the skin. The emitted light penetrates these tissues and is scattered, refracted, and reflected. A small amount of light modified by absorption of the tissue returns to the surface and is measured. The ratio is calculated by comparing the red light (660 nm wavelength), which is not absorbed as much by oxygenated hemoglobin, with infrared light (850 nm wavelength), which is less affected by oxygenation (Toomim et al., 2004). Capillary oxygenation is barely affected by peripheral blood pressure and is mainly controlled by tissue demand for energy. The concentration of oxygenated hemoglobin is therefore a useful measurement of local blood flow. Thus, mathematically, the formula for the nir-HEG ratio is as follows: nir-HEG Ratio = Red light (variable)/infrared light (not much affected by oxygenation).
The nir-HEG Ratio or proportion between red and infrared light has a useful property. The numerator and denominator in the relationship are influenced in the same way by attenuation of the skin, the skull, and the length of the path. In this relationship, these variables are therefore discarded. The standardized reference value was established at 100 (SD = 20) and used to calibrate all new spectrophotometers (Toomim, 2002).
In addition to this measure, nir-HEG provides an Attention Index (AI), indicating malfunctioning of the intention to increase the HEG ratio; that is, the participant is incapable of increasing the ratio and, thereby, brain activation. This apparently indicates a lapse in attentional process, which, according to Toomin et al. (2004), is equivalent to a measure of sustained attention or capacity of concentration.
Blood oxygenation Variables (standardized mean) of nir-HEG Ratio and Attention Index (AI): nir-HEG Fp1, nir-HEG Fpz, AIFp1, AIFpz.
— We used the Biocomp 2010 (www.biocompresench.org) to record electrical activity. Q-EEG (quantified electroencephalogram) is a computerized EEG system, adapted by Toomin (The Biofeedback Institute of Los Angeles), which provides levels of cortical activation through the beta/theta ratio. It measures attention in general, independently of the task to be performed. For this purpose, an electrode is placed on the subject's corresponding cortical area (Cz, Fp1) to record the beta/ theta ratio, and two more control electrodes are placed on the subject's left and right earlobe. The Q-EEG is administered to each participant, with open eyes, for a maximum duration of 10 min and after receiving instructions of even abdominal breathing to carry out the test in the best possible performance conditions. Lastly, an EMG system is placed on the right forearm to identify the degree of movement. Once the electrodes are in place, participants are asked to remain relaxed, without moving, breathing slowly and evenly, concentrating exclusively on the computer screen on which the theta and beta waves emitted by them are displayed successively. After assessment, the results obtained are interpreted. When the beta/theta ratio is lower than 50% at Cz, there is an associated deficit of sustained attention and if the ratio is also lower at Fp1, then the attentional deficit is associated with a lack of executive control, attributable to hyperactivity (González-Castro et al., 2010).
Q-EEG Variables (standardized mean) of beta/theta ratio: Q-EEG Fp1, Q-EEG Cz.
— The Test of Variables of Attention (TOVA; Greenberg, 1996) is a test that presents two simple images. The first one presents the stimulus at the top of the screen and the second one at the bottom of the screen. The subject is given a push-button that should only be pressed when the first image appears. Subjects are trained for 3 minutes before testing, and the test lasts between 20 and 24 minutes. The following profile is obtained: omissions, RT, commissions, variability, D' (performance quality during the test) and ADHD score, attributable to a profile of attention deficit with hyperactivity, according to the test manual.
TOVA Variables (standardized means): omissions, commissions, variability, RT (Response time), D' (performance quality during the test) and ADHD score.
Procedure and data analysis
This research used an ex post facto prospective design with four groups with non-random and intentional sampling (Hartley, 2012). Data obtained were analyzed with MANCOVA to assess the usefulness of this type of measures for the differential diagnosis of ADHD subtypes (MANCOVA). Dependent variables were the measures of cortical activation (nir-HEG Fp1, AIFp1, nir-HEG Fpz, AIFpz), and the independent variable was group, with age, sex, and IQ as covariates. We used Wilks' λ to determine whether there were significant differences in all the dependent variables taken conjointly (p < .05) and we examined the results of the individual analysis of variance (ANCOVAs). We used η2 as an effect size index. We used Bonferroni's multiple comparison to determine the groups between which significant differences were found. Finally, we calculated the Effect Sizes (Cohen's d), following the same outline as the article by Thalheimer and Cook (2002).
Results
Hemoencephalographic measures (nir-HEG)
Table 2 presents the means and standard deviations corresponding to the two indicators of cortical activation by blood flow, represented by nir-HEG ratio and AI. MANCOVA showed that the effects as a function of subtype were statistically significant; Wilks' l = .093, F3, 205 = 16.07, p = .000, η2 = .547. The size of this relation is relevant, as 54% of the variability is attributable to differences among subgroups, after controlling for the effect of age, sex, and IQ. Concerning the covariations, whereas sex and IQ showed no effect, Wilks' λ = .893, F3, 205 = 1.58, p = .086, η2 = .107, and Wilks' λ = .946, F3, 205 = .75, p = .713, η2 = .054, respectively. Age had a statistically significant effect: Wilks' l = .875, F3, 205 = 1.89, p = .029, η2= .125.
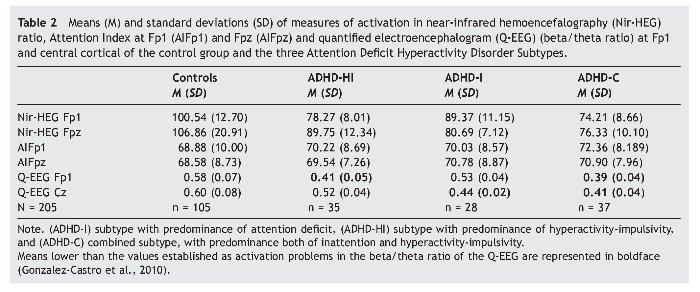
In the tests for between-subject effects within the ADHD subtype, statistically significant differences were obtained for the dependent variables nir-HEG Fp1, F3, 205 = 62.07, p = .000, η2 = .485, and the variable nir-HEG Fpz, F3, 205 = 37.86, p = .000, η2 = .365. However, variables involving AI revealed no statistically significant differences, either at AI Fp1, F3, 205 = 1.15, p = .327, η2 = .017, or at AI Fpz, F3, 205 = .86, p = .460, η2 = .013. Therefore, AI (Fp1 and Fpz) could not differentiate between subtypes or even between subtypes and control group.
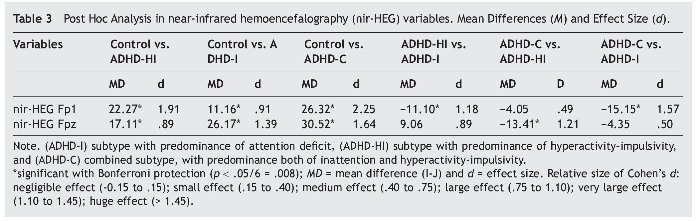
We then conducted ANCOVA on the dependent variables nir-HEG Fp1 and nir-HEG Fpz, which had previously been shown to be statistically significant. The results for nir-HEG Fp1 were F3, 205 = 68.74, p = .000, η2 = .506, showing that that this dependent variable accounts for 50.6% of the variance. The results for the variable nir-HEG Fpz were: F3, 205 = 41.30, p = .000, η2 = .381, showing that that this dependent variable accounts for 38.1% of the variance. Post hoc multiple comparison for each dependent variable, nir-HEG Fp1 and nir-HEG Fpz, with the four groups of the study (Control, ADHD-HI, ADHD-I, and ADHD-C) as shown in Table 3.

All results were statistically significant for the variable nir-HEG Fp1, except for the comparison of the ADHD-HI and ADHD-C subtypes. Concerning the nir-HEG Fpz variable, all results revealed statistically significant differences, except for the comparison of ADHD-HI and ADHD-I (these ADHD subtypes present some differences with regard to ADHD-C and the control group but not with each other). Nir-HEG Fpz results were also statistically significant for the comparison of control with ADHD-C and ADHD-HI but not compared with ADHD-I.
Measures of quantified electroencephalogram
Table 2 presents the means and standard deviations of the indicators of electrical cortical activation measured with Q-EEG (dependent variables: Fp1 and Cz). In the MANCOVAs, the independent variable was group (ADHD-I, ADHD-HI, ADHD-C subtypes and control group). Covariates were age, sex, and IQ.
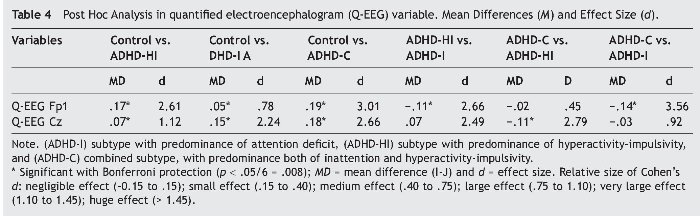
The data obtained (see boldface recordings) are coherent with the above-mentioned approach. Tests of between-subject effects of ADHD subtype provided the following results: Q-EEG Fp1: F3,205 = 105.29, p = .000, η2 = .615, and for Q-EEG Cz: F3, 205 = 82.38, p = .000, η2 = .555. ANCOVA results for variable Q-EEG Fp1 were: F3, 205 = 111.19, p = .000, η2 = .624, indicating that this variable explains 62.4% of the variance.
Results for the variable Q-EEG were: F3, 205 = 88.05, p = .000, η2 = .568, indicating that it explains 56.8% of the variance. Bonferroni's post hoc multiple comparisons for each dependent variable were conducted (see Table 4). For Q-EEG Fp1, all results were statistically significant, except for the comparison of ADHD-HI and ADHD-C (p = .830). For variable Q-EEG Cz, all results were statistically significant, except for the comparison of ADHD-I and ADHD-C (p = .227).
Measures of executive control (TOVA)
Table 5 presents the means and standard deviations of the TOVA indexes like dependent variables. Covariates were, again, age, sex, and IQ. The independent variable was group.
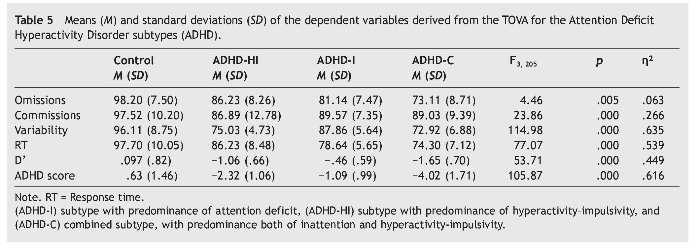
Post hoc multiple comparisons in the groups (ADHD-I, ADHD-HI, ADHD-C, and control group) revealed the following results. Firstly, concerning the omissions, all results were significant except for the comparison of ADHD-HI and ADHD-I (p = .69). In commissions, the comparisons of the control group with the ADHD subtypes were also significant, but the comparisons of the subtypes of the disorder were not (p = .940, ADHD-HI vs. ADHD-I; p = 1.000, ADHD-HI vs. ADHD-C; p = .068, ADHD-I vs. ADHD-C). All comparisons were highly significant for variability (p = .000) except for the comparison of ADHD-HI and ADHD-C (p = 1.000). All comparisons were significant for RT except for the comparison of ADHD-I and ADHD-C (p = .304). Lastly, all comparisons were significant for D' and ADHD score.
Discussion
This investigation aimed to verify whether each ADHD subtype is subject to a specific pattern of cortical activation and executive control and whether this pattern is different in children with and without ADHD (control group). Results confirm the data provided by prior research (González-Castro et al., 2010; Rodríguez et al., 2011), indicating that the four groups of children were significantly different in the two cortical activation variables (central and prefrontal) as assessed with Q-EEG, and in the six executive control variables assessed with the TOVA. Multiple comparisons of groups confirm the proposed hypotheses and support the aforementioned research (Solanto et al., 2009) in which differential profiles in the ADHD subtypes were proposed.
Such profiles were also contrasted with the assessment instrument nir-HEG, especially at Fp1. Specifically, these differences are observed between the ADHD-I and ADHD-HI subtypes and between the ADHD-I and ADHD-C subtypes. No differences were observed between ADHD-HI and ADHD-C subtypes, as initially proposed, because both groups present deficits related to self-control in this area (Hasson & Fine, 2012; Miranda et al., 2012). However, using the variable Fpz as reference, although there are differences between the subtypes, they are not statistically significant. Nevertheless, it can be observed that children with ADHD-I and ADHD-C obtain lower scores in this variable. These nonsignificant differences can be explained taking into account that the Q-EEG recording was carried out at Cz, whereas nir-HEG was performed at Fpz due to the impossibility of identifying levels of blood oxygenation through the scalp (Toomin et al., 2004). Logically, this placement could generate some disparity, which could be analyzed in a new investigation attempting to identify the correlation between Q-EEG and nir-HEG measures. Moreover, except for the limitations of the sample size of these groups, future research could be further strengthened by correlating neurophysiological measurements with performance in the TOVA test using regression analysis.
Patterns those are compatible with electrical activity (Q-EEG)
Regarding the hypotheses related to electrical activity, the first hypothesis stated that ADHD-I and ADHD-C subtypes would present significantly lower cortical activation at Cz than those observed in ADHD-HI and controls. The data confirm this hypothesis, indicating that low activation in this area could be associated with a specific attentional deficit.
The second hypothesis stated that subtypes ADHD-HI and ADHD-C would display significantly lower cortical activation at Fp1 than those observed in ADHD-I and controls. Results confirm this hypothesis, leading to the conclusion that a low activation pattern at Fp1 is indicative of a low capacity of self-control.
Patterns that are compatible with blood oxygenation (nir-HEG)
The first hypothesis stated that ADHD-I and ADHD-C subtypes would display significantly lower cortical activation at Fpz than those observed in ADHD-HI and controls. Results confirm that activation at this point is higher in children with some ADHD subtype than in the control group, but the differences between subtypes were nonsignificant (although the means of the inattentive individuals were lower). As mentioned, the problem could be that Fpz is not as accurate to detect attentional deficit as Cz, as it is conditioned by the capacity of self-control.
Moreover, it was proposed that subtypes ADHD-HI and ADHD-C would display significantly lower cortical activation at Fp1 than those observed in ADHD-I and controls. Results show that activation at Fp1 is clearly related to the capacity of self-control, and this aspect is confirmed both through electrical activity and blood oxygenation. We can conclude that the nir-HEG as an assessment instrument reveals clear oxygenation differences between ADHD-I, ADHD-HI, and controls.
This conclusion lends support to prior studies stating that the prefrontal area is essential in ADHD (Rubia et al., 2010) and crucial to establish not only differences between controls and ADHD but also between the subtypes of the disorder. This leads to a model of activation in which the central prefrontal and left prefrontal areas present lower activation in children with ADHD compared to controls, and this activation is even lower at Fp1 in ADHD-HI subtypes compared to ADHD-I subtypes.
Patterns compatible with executive control (TOVA)
Performance outcomes show that the control group displays an average performance in all the TOVA variables. The scores of ADHD subtypes are lower than those of the control group in all the variables, indicating that, in general, their performance is affected independently of the particular subtype. The performance of ADHD-C was worse in all variables than that of the ADHD-I and ADHD-HI subtypes. Children with ADHD-HI were expected to give correct responses in variables such as RT or stimulus detection, but their responses were affected by their hyperactive disorder, impairing their performance, although to a lesser extent than in specifically affected variables such as variability or performance quality during the test (D'). The same results are observed in the ADHD-I subtype. Contrary to our expectations of adequate performance in variability, their performance was affected by the inattention disorder itself.
Although commissions do not discriminate between ADHD subtypes, RT and variability clearly identify them. Therefore, research focused exclusively on inhibitory control is denying the existence of subtypes; this is logical, as they do not consider other variables that facilitate their discrimination.
To conclude, it can be stated that attention as a learning variable is conditioned by many other variables that either promote or inhibit it. When attention is affected by ADHD, it is important to appraise other determinants in the diagnosis in addition to behavior (Legarda et al., 2011), in order to identify the specific disorder and its intensity. As an objective aspect, we incorporated a new tool, the nir-HEG, which is reliable and easy to perform, and it initially differentiates between individuals with and without the disorder (controls). This is an essential line of research because, in most cases, pharmacological treatments are applied, and the prescription of such supports could be more precisely adjusted to each case, depending on the degree of activation.
Some limitations of the present study must be noted. When selecting the sample it would be recommendable to have two sources of information (as indicated by the DSMIV criteria), parents and teachers, to complete the diagnostic process. In view of our results, we propose an inverse process for future studies: Any child who is suspected of having ADHD could be first identified by measures of brain functioning, and subsequently diagnosed clinically and with observational measures (Coolidge, Starkey, & Cahill, 2007). In this way, we could verify whether or not ADHDs are really discontinuous categorical entities.
*Corresponding author at:
Departamento de Psicología,
Universidad de Oviedo, Plaza Feijoo, s/n, 33003 Oviedo, Spain.
E-mail address:mgcastro@uniovi.es (P. González-Castro).
Received November 26, 2012;
accepted March 14, 2013
References
Álvarez, L., González-Castro, P., Núñez, J. C., González-Pienda, J. A., & Bernardo, A. (2008). Assessment and control of cortical activation in sustained attention deficits. International Journal of Clinical and Health Psychology, 8, 509-524.
American Psychiatric Association (2000). Diagnostic and statistical manual of mental disorders (4h edition, revised). Washington DC: Author.
Angelakis, E., Lubar, J. F., & Stathopoulou, S. (2004). Electroencephalografic peak alpha frequency correlates of cognitive traits. Neuroscience Letters, 371, 60-63.
Bresnahan, S. M., Anderson, J. W., & Barry, R. J. (1999). Age-related changes in quantitative EEG in attention-deficit/ hyperactivity disorder. Biological Psychiatry, 46, 1690-1697.
Clarke, A. R., Barry, R. J., McCarthy, R., & Selikowitz, M. (2001). EEG-defined subtypes of children with attention-deficit/ hyperactivity disorder. Clinical Neurophysiology, 112, 2098-2105.
Coolidge, F. L., Starkey, M. T., & Cahill, B. S. (2007). Comparison of a parent-rated DSM-IV measure of attention-deficit/ hyperactivity disorder and quantitative EEG parameters in an outpatient sample of children. Journal of Clinical Neurophysiology, 24, 348-351.
Cueli, M., García, T., Rodríguez, C., González-Castro, P., Álvarez, L., & Álvarez, D. (2013). Examination of blood flow patterns in ADHD through a continuous performance test. Revista Iberoamericana de Psicología de la Salud, 4, 2069-2171.
Farré, A., & Narbona, J. (1997). Escala de Déficit de Atención e Hiperactividad (E.D.A.H.) [Scale of Attention Deficit and Hyperactivity]. Madrid: TEA Ediciones.
González-Castro, P., Álvarez, L., Núñez, J. C., González-Pienda, J. A., Álvarez, D., & Muñiz, J. (2010). Cortical activation y attentional control in ADAH subtypes. International Journal of Clinical and Health Psychology, 10, 23-39.
Greenberg, M. L. (1996). Test of Variables of Attention (TOVATOVA-A). Los Alamitos, CA: U.A.D.
Hartley, J. (2012). New ways of making academic articles easier to read. International Journal of Clinical and Health Psychology 12, 143-160.
Hasson, R., & Fine, J. G. (2012). Gender differences among children with ADHD on continuous performance tests: A meta-analytic review. Journal of Attention Disorders, 16, 190-198.
Legarda, S. B., McMahon, D., Othmer, S., & Othmer, S. (2011). Clinical neurofeedback: Case studies, proposed mechanism, and implications for pediatric neurology practice. Journal of Child Neurology, 26, 1045-1051.
Millichap, J. G., Millichap, J. J., & Stack, C. V. (2011). Utility of the electroencephalogram in attention deficit hyperactivity disorder. Clinical EEG Neuroscience, 42, 180-184.
Miranda, M. C., Barbosa, T., Muszkat, M., Rodrigues, C. C., Sinnes, E. G., Coelho, L. F. S., Rizzuti, S., Palma, S. M. M., & Bueno, O. F. A. (2012). Performance patterns in Conners' CPT among children with attention deficit hyperactivity disorder and dyslexia. Archivos de Neuro-Psiquiatría,70, 91-96.
Pineda, D. A., Puerta, I. C., Aguirre, D. C., Garcia-Barrera, M. A., & Kamphaus, R. W. (2007). The role of neuropsychologic tests in the diagnosis of attention deficit hyperactivity disorder. Pediatric Neurology, 36, 373-381.
Rodríguez, C., Fernández-Cueli, M., González-Castro, P., Álvarez, L., & Álvarez-García, D. (2011). Differences in cortical blood flow in ADHD subtypes. A pilot study. Aula Abierta, 39, 25-36.
Rubia, K., Cubillo, A., Smith, A. B., Woolley, J., Heyman, I., & Brammer, M. J. (2010). Disorder-specific dysfunction in right inferior prefrontal cortex during two inhibition tasks in boys with attention-deficit hyperactivity disorder compared to boys with obsessive-compulsive disorder. Human Brain Mapping, 31, 287-299.
Serra-Sala, M., Timoneda-Gallart, C., & Pérez-Álvarez, F. (2012). Evaluating prefrontal activation and its relationship with cognitive and emotional processes by means of hemoencephalography (HEG). Journal of Neurotherapy, 16, 183-195.
Shaffer, D., Fisher, P., Lucas, C. P., Dulcan, M. K., & Schwab, M. E. (2000). NIMH Diagnostic Interview Schedule for Children Version IV (NIMH DISC-IV). Description, differences from previous versions and reliability of some common diagnoses. Journal of the American Academy of Child & Adolescent Psychiatry, 39, 28-38.
Snyder, S., Quintana, H., Sexson, S., Knott, P., Haque, A. F., & Reynolds, D. (2008). Blinded, multi-center validation of EEG and rating scales in identifying ADHD within a clinical sample. Psychiatry Research, 159, 346-358.
Solanto, M. V., Schulz, K. P., Fan, J., Tang, C. Y., & Newcorn, J. H. (2009). Event-related fMRI of inhibitory control in the predominantly inattentive and combined subtypes of ADHD. Journal of Neuroimaging, 19, 205-212.
Swartwood, J. N., Swartwood, M. O., Lubar, J. F., & Timmerman, D. L. (2003). EEG differences in ADHD-combined type during baseline and cognitive tasks. Pediatric Neurology, 28, 199-204.
Thalheimer, W., & Cook, S. (2002). How to calculate effect sizes from published research articles: A simplified methodology. Available from: http://work-learning.com/effect_sizes.htm [retrieved 31 Nov 2002].
Thome, J., Ehlis, A. C., Fallgatter, A. J., Krauel, K., Lange, K. W., & Riederer, P., (2012). Biomarkers for attention-deficit/ hyperactivity disorder (ADHD). A consensus report of the WFSBP task force on biological markers and the World Federation of ADHD. World Journal of Biological Psychiatry, 13, 379-400.
Tinius, T. (2004). New developments in blood flow hemoencephalography. Binghampton, NY: Haworth Medical Press.
Toomim, H. (2002). Neurofeedback with hemoencephalography (HEG). Explore! For the Professional, 11, 19-21.
Toomim, H., Mize, W., Yeekwong, P., Toomim, M., Marsh, R., & Kozlowski, G. P., (2004). Intentional increase of cerebral blood oxygenation using hemoencephalography: An efficient brain exercise therapy. Journal of Neurotherapy, 8, 5-21.
Wechsler, D. (2004). The Wechsler Intelligence Scale for Children (4th edition). London: Pearson Assessment.
