


Assessments of health can be biased by response shift effects. One method for detecting such effects is the use of anchoring vignettes. The aim of this study was to analyze the relationship between participants’ self-assessed health state and their assessments of these vignettes.
MethodA total of 342 cardiovascular patients assessed their own state of health on a 0-100 visual analogue scale. The patients additionally assessed two vignettes featuring fictional persons suffering from specific complaints. A sample of the general population (N=1,236) served as controls.
ResultsThe participants rated the health state of the vignette character featuring physical problems as being significantly better than the general population did (effect size: d=0.53). The group difference in the assessment of the vignette featuring primarily mental health problems was lower (d = -0.17). Participants’ assessments of the vignettes were positively correlated with their assessments of their own health state (r=.26 and r=.10) and with several quality of life variables.
ConclusionsAnchoring vignettes are a useful tool for detecting response shift effects.
Las evaluaciones de la salud pueden estar sesgadas por efectos de cambio en la respuesta. Un método para detectar ese tipo de efectos es el uso de viñetas de caso. El objetivo de este estudio fue analizar la relación entre el estado autoinformado de salud y la evaluación de estas viñetas.
MétodoUn total de 342 pacientes cardiovasculares evaluaron su estado de salud personal en una escala analógica-visual de 0-100. Adicionalmente, debían evaluar dos viñetas describiendo personas ficticias que sufrían de algunas condiciones de salud. Una muestra de la población general (N=1.236) sirvió como grupo control.
ResultadosLos participantes evaluaron el estado de salud de los protagonistas de las viñetas como significativamente mejor que la población general (tamaño del efecto d=0,53). La diferencia entre grupos de la evaluación de la viñeta con problemas primariamente de salud mental fue más baja (d = -0,17). La evaluación de la salud de las viñetas muestra una correlación positiva con la evaluación del propio estado de salud (r=0,26 y r=0,10) y con varias variables de calidad de vida.
ConclusionesLas viñetas de caso son una herramienta útil para detectar efectos de cambio en la respuesta.
Quality of life (QoL) has become an important outcome criterion in medical research and treatment. One focus of QoL research is the patient’s subjective assessment of his/her health state. In recent years evidence has accumulated indicating that people, especially patients, can change their frames of reference for health-related variables, a phenomenon which is called response shift (Schwartz et al., 2006; Sprangers & Schwartz, 1999; Spuling, Wolff, & Wurm, 2017). The consequence of such response shift effects is that comparisons between the scores obtained at different time points or between groups of patients with different health histories can be biased. When patients suffering from an injury are asked to retrospectively assess their QoL prior to having been injured, those QoL assessments are generally higher than those of the general population, a phenomenon which can be interpreted as an example of a response shift effect (Scholten, Haagsma, Steyerberg, van Beeck, & Polinder, 2017). Moreover, when proxies are asked to rate the health state of their relatives suffering from a certain disease, the judgments of the patients themselves are often more positive than those of the proxies (Lapin, Thompson, Schuster, & Katzan, 2019).
Several statistical tools have been developed to detect and quantify such response shift effects. The most frequently used tools are the then-test method (Schwartz et al., 2006) and structural equation modeling (Oort, 2005). These two techniques require at least two measurement points. A further technique which is also applicable in cross-sectional studies is the use of anchoring vignettes. Vignettes are descriptions of fictional subjects featuring specific characteristics (e.g., health state). When patients are asked to assess the persons described in these vignettes concerning criteria such as health, it is possible to derive conclusions about the respondents’ frames of reference. Such anchoring vignettes have been applied in several specific domains such as alcohol consumption (Van Soest, Delaney, Harmon, Kapteyn, & Smith, 2011), physical capacity (Salomon, Tandon, & Murray, 2004), and emotional skills (Primi, Zanon, Santos, Fruyt, & John, 2016), but also in assessments of assessments of general states of health (Grol-Prokopczyk, 2017). In international studies on QoL and life satisfaction, these vignettes have been used to control for judgement differences among different countries (Angelini, Cavapozzi, Corazzini, & Paccagnella, 2014; Vonkova, Zamarro, & Hitt, 2018; Weiss & Roberts, 2018).
QoL studies with cancer patients have revealed a typical pattern of response: While patients report detriments in many specific domains, they nevertheless rate their general health state and their general QoL as being relatively good (Arndt, Merx, Stegmaier, Ziegler, & Brenner, 2005; Hinz, Mehnert et al., 2017). This indicates that response shift effects occur with greater magnitude when general assessments of a patient’s health state are studied. If patients indeed change their frames of reference when responding to questions concerning health, this should result in changes in their responses to the vignettes, assuming that the patients apply the same scales to themselves as they do to the vignettes (principle of response homogeneity). The hypothesis is that people experiencing a severe disease will rate vignette characters’ health states as being less problematic than people in the general population will. If this was really true, the difference between the assessments of their own health state and that of the vignette characters should provide additional information on the patient’s health state. A second hypothesis, also derived from the hypothesis of response shift, is that those patients who are in a poor health will assess the vignette characters as being in better health than patients in a good health will. This should result in a negative correlation between the assessment of a respondent’s own health and that of the vignette characters. In our study we intend to examine whether such a negative correlation does exist, and whether there are age and gender differences in the assessments of the vignettes.
Most of the studies that have been conducted using vignettes are cross-sectional studies. If an examination includes at least two measurements per person, it is possible to examine whether a change of the personal health state from t1 to t2 is negatively correlated with a corresponding change of the assessments of a vignette. Here we intend to test the hypothesis that an improvement in a person’s health situation results in a complementary change in the person’s frame of reference, and, therefore, more negative assessments of the vignette than before. In addition to that, the temporal stability of the vignettes’ evaluations is a matter of interest which has yet to be analyzed. Finally, to better understand the factors’ contribution to changes in the patients’ frames of reference, it is instructive to explore to what degree the tendency to change the frame of reference is related to variables of mental health and QoL.
In summary, the aims of this study were (a) to compare the self-assessed health state of patients with the assessments obtained in the general population, (b) to test the impact of several factors (patients vs. general population, sociodemographic factors) on the assessments of the anchoring vignettes, (c) to test the correlation between the respondents’ health states and those attributed to the vignettes, (d) to examine the temporal stability and the intra-individual relationship between self-rated health and the assessments of the vignettes, and (e) to analyze the relationship between the assessments of the vignettes and QoL variables.
MethodSample of patientsBetween June 2015 and July 2016, patients treated in a German cardiovascular rehabilitation clinic were asked to take part in the study. Exclusion criteria were: insufficient command of the German language and age under 18 years. The general duration of the rehabilitation treatment was three weeks. Participants who agreed to take part in the study were given several questionnaires within the first three days of the rehabilitation program (t1), and they were sent a letter with the t2 questionnaires by mail three month after discharge from the rehabilitation clinic. The study was approved by the Ethics Committee of the University of Leipzig. Informed consent was obtained from all participants who were willing to take part.
Sample of the general populationThe reference values were taken from a general population study. The sample included 2,409 persons which were representatively selected from the adult German general population (Hinz, Häuser, Glaesmer, & Brähler, 2016). The participants of this study assessed themselves and the vignettes concerning health states with the same 0-100 scale as the cardiovascular patients did. From this sample, we selected a subsample so that the mean age and the proportion of women were nearly exactly the same as in the patients’ sample. This subsample of the general population ultimately included 1,030 males and 206 females (16.7% females in this sample). The mean age of this sample was 55.8 years, very similar to that of the patients’ sample. This study was also approved by the Ethics Committee of the University of Leipzig.
InstrumentsThe participants were asked to assess their current health state on a 0-100 scale according to the Visual Analogue Scale of the QoL questionnaire EQ-5D (Brooks, 1996; Devlin & Brooks, 2017). The end points of this scale were labeled as worst possible health (0) and best imaginable health (100). Two additional vignettes of patients were also assessed with the same 0-100 scale. These vignettes were taken from a previous study (Hinz et al., 2016) and are characterized as follows:
“Patient A is handicapped in his mobility by a disease. He has problems using stairs, cannot perform his daily tasks (e.g., shopping) and occasionally has to use a wheel chair. He has hip and knee pain but considers it tolerable. Mentally he feels well. He is not anxious or depressed and does not see a reason to complain about his health.”
“Patient B has chronic back pain and physicians have been unable to figure out why. Although Patient B can move and fulfil his daily activities without help, he feels alienated by his pain, he mistrusts the physicians, and he perceives his future health situation as hopeless.”
Study participants (patients as well as participants of the general population study) were asked to assess their own health state and the health states of the characters described in these two vignettes using the same 0-100 scale.
The participants of the cardiovascular rehabilitation program also completed the following questionnaires: Life Orientation Test-Revised (LOT-R; Glaesmer et al., 2012; Hinz, Sander et al., 2017), a ten-item instrument measuring habitual optimism and pessimism, the Patient Health Questionnaire-4 (PHQ-4; Löwe et al., 2010), which measures anxiety and depression with four items, the General Self-Efficacy Scale (GSES; Damasio et al., 2016; Schwarzer & Jerusalem, 1995), and the QoL instrument EORTC QLQ-C30 (Aaronson et al., 1993; Nolte et al., 2019). The sum score of the EORTC QLQ-C30 was calculated according to a recommendation given by the EORTC QoL Group (Giesinger et al., 2016). The reliability coefficients (Cronbach’s alpha) of the scales, applied to the sample of this study, were as follows: LOT-R (sum score): alpha=.69, PHQ-4 (sum score): alpha=.86, GSES: alpha=.90, EORTC QLQ-C30 (general health/QoL scale): alpha=.90, and EORTC QLQ-C30 (sum score): alpha=.87.
Statistical analysisEffect sizes d were calculated to indicate the mean score difference between two groups, adjusted for the pooled standard deviations. Pearson correlations were used to describe the associations between the health assessments. Tests of mean score differences between groups were performed with t-tests. The impact of gender and age group on the health assessments was tested with 2-way ANOVAs, using the mean age of the sample as the cutoff for the two age groups. All statistical tests were performed with SPSS version 24.
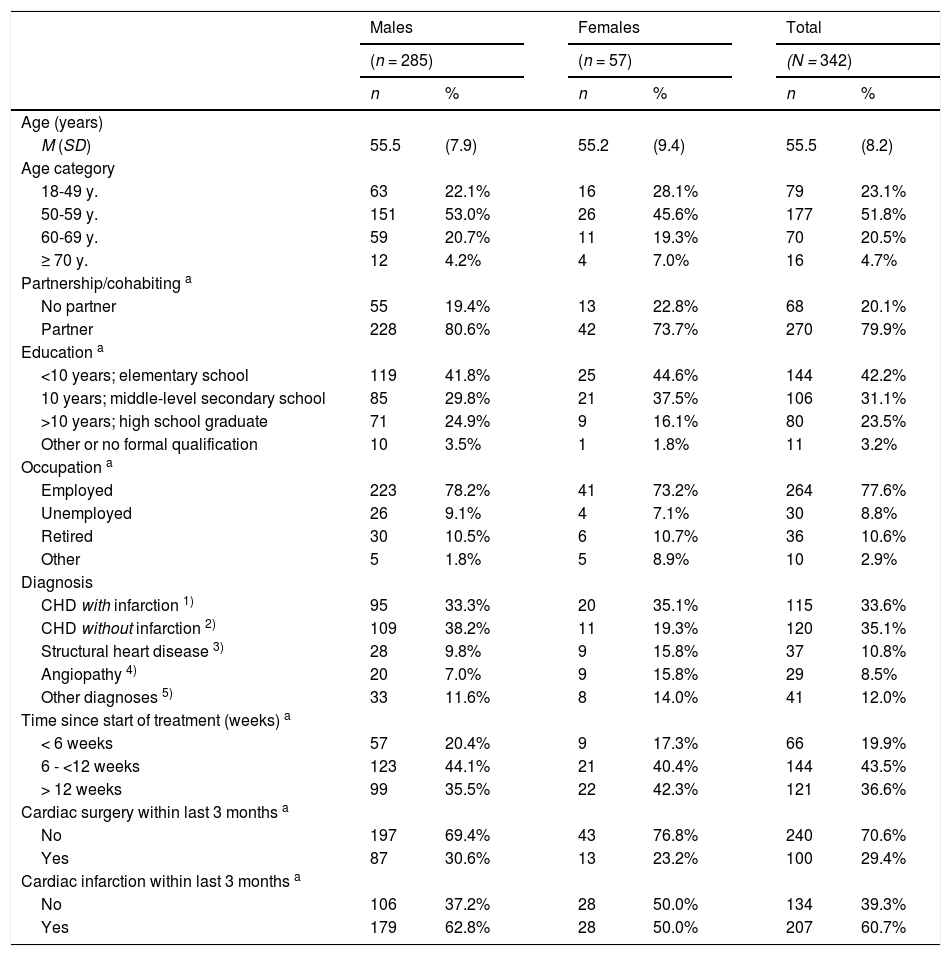
ResultsComparison between the patients and the general populationA total of 479 participants in the cooperating rehabilitation program were asked to take part in the study: 356 of them were willing to do so (response rate: 74%). Of these, 342 provided complete response sets at t1 concerning subjective assessments of their own health and that of the vignette characters. A subsample of 288 participants returned the t2 questionnaire three months after the first examination, 275 of these had complete data for the relevant variables. The final t1 sample consisted of 285 males and 57 females (16.7 %), the mean age was M=55.5 years (SD=8.2 years). Sociodemographic and clinical characteristics of the sample are given in Table 1.
Characteristics of the sample of patients.
| Males | Females | Total | ||||||
|---|---|---|---|---|---|---|---|---|
| (n = 285) | (n = 57) | (N = 342) | ||||||
| n | % | n | % | n | % | |||
| Age (years) | ||||||||
| M (SD) | 55.5 | (7.9) | 55.2 | (9.4) | 55.5 | (8.2) | ||
| Age category | ||||||||
| 18-49 y. | 63 | 22.1% | 16 | 28.1% | 79 | 23.1% | ||
| 50-59 y. | 151 | 53.0% | 26 | 45.6% | 177 | 51.8% | ||
| 60-69 y. | 59 | 20.7% | 11 | 19.3% | 70 | 20.5% | ||
| ≥ 70 y. | 12 | 4.2% | 4 | 7.0% | 16 | 4.7% | ||
| Partnership/cohabiting a | ||||||||
| No partner | 55 | 19.4% | 13 | 22.8% | 68 | 20.1% | ||
| Partner | 228 | 80.6% | 42 | 73.7% | 270 | 79.9% | ||
| Education a | ||||||||
| <10 years; elementary school | 119 | 41.8% | 25 | 44.6% | 144 | 42.2% | ||
| 10 years; middle-level secondary school | 85 | 29.8% | 21 | 37.5% | 106 | 31.1% | ||
| >10 years; high school graduate | 71 | 24.9% | 9 | 16.1% | 80 | 23.5% | ||
| Other or no formal qualification | 10 | 3.5% | 1 | 1.8% | 11 | 3.2% | ||
| Occupation a | ||||||||
| Employed | 223 | 78.2% | 41 | 73.2% | 264 | 77.6% | ||
| Unemployed | 26 | 9.1% | 4 | 7.1% | 30 | 8.8% | ||
| Retired | 30 | 10.5% | 6 | 10.7% | 36 | 10.6% | ||
| Other | 5 | 1.8% | 5 | 8.9% | 10 | 2.9% | ||
| Diagnosis | ||||||||
| CHD with infarction 1) | 95 | 33.3% | 20 | 35.1% | 115 | 33.6% | ||
| CHD without infarction 2) | 109 | 38.2% | 11 | 19.3% | 120 | 35.1% | ||
| Structural heart disease 3) | 28 | 9.8% | 9 | 15.8% | 37 | 10.8% | ||
| Angiopathy 4) | 20 | 7.0% | 9 | 15.8% | 29 | 8.5% | ||
| Other diagnoses 5) | 33 | 11.6% | 8 | 14.0% | 41 | 12.0% | ||
| Time since start of treatment (weeks) a | ||||||||
| < 6 weeks | 57 | 20.4% | 9 | 17.3% | 66 | 19.9% | ||
| 6 - <12 weeks | 123 | 44.1% | 21 | 40.4% | 144 | 43.5% | ||
| > 12 weeks | 99 | 35.5% | 22 | 42.3% | 121 | 36.6% | ||
| Cardiac surgery within last 3 months a | ||||||||
| No | 197 | 69.4% | 43 | 76.8% | 240 | 70.6% | ||
| Yes | 87 | 30.6% | 13 | 23.2% | 100 | 29.4% | ||
| Cardiac infarction within last 3 months a | ||||||||
| No | 106 | 37.2% | 28 | 50.0% | 134 | 39.3% | ||
| Yes | 179 | 62.8% | 28 | 50.0% | 207 | 60.7% | ||
Note. aMissing data not reported; 1)ICD-10: I21-I23 and I25.2; 2)IDC-10: I24-I25 except I25.2; 3)atherosclerosis, heart valve diseases, cardiomyopathy, unstable angina pectoris; 4)aneurysm, pulmonary hypertension, embolic disease, thrombosis, stenosis; 5)essential hypertension, stroke, arrhythmia, endocarditis, complications and others.
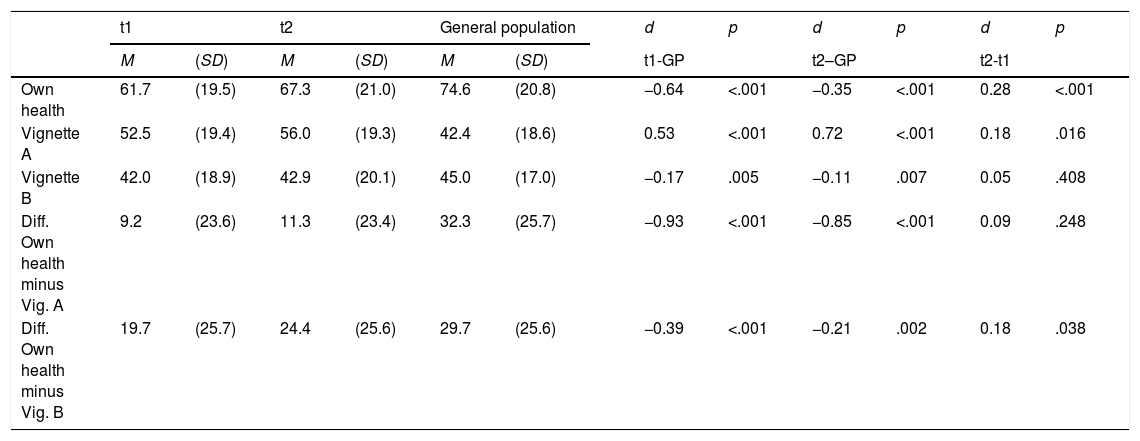
Table 2 presents the mean scores of the patients (t1 and t2) and the general population sample. The lower part of Table 2 shows the difference scores between respondents’ assessments of their personal health states and those of the vignette characters. The mean health state of the patients was worse than that of the general population (61.7 vs. 74.6). During the three-month period studied, the difference dropped from 12.9 to 7.3 points. There were also group differences in the assessments of the vignettes. The patients’ mean rating for vignette A (mainly physical problems) was significantly higher than the general population’s rating (effect size d=0.53 for the t1 comparison), but there were only small group differences for vignette B (mainly mental problems). While the patients at t1 considered themselves to be only 9.2 points healthier than vignette A, this difference was 32.3 points for the general population, resulting in an effect size of d = -0.93.
Mean scores and effect sizes of the health assessments.
| t1 | t2 | General population | d | p | d | p | d | p | |||||
|---|---|---|---|---|---|---|---|---|---|---|---|---|---|
| M | (SD) | M | (SD) | M | (SD) | t1-GP | t2–GP | t2-t1 | |||||
| Own health | 61.7 | (19.5) | 67.3 | (21.0) | 74.6 | (20.8) | −0.64 | <.001 | −0.35 | <.001 | 0.28 | <.001 | |
| Vignette A | 52.5 | (19.4) | 56.0 | (19.3) | 42.4 | (18.6) | 0.53 | <.001 | 0.72 | <.001 | 0.18 | .016 | |
| Vignette B | 42.0 | (18.9) | 42.9 | (20.1) | 45.0 | (17.0) | −0.17 | .005 | −0.11 | .007 | 0.05 | .408 | |
| Diff. Own health minus Vig. A | 9.2 | (23.6) | 11.3 | (23.4) | 32.3 | (25.7) | −0.93 | <.001 | −0.85 | <.001 | 0.09 | .248 | |
| Diff. Own health minus Vig. B | 19.7 | (25.7) | 24.4 | (25.6) | 29.7 | (25.6) | −0.39 | <.001 | −0.21 | .002 | 0.18 | .038 | |
Note. d: Effect size.
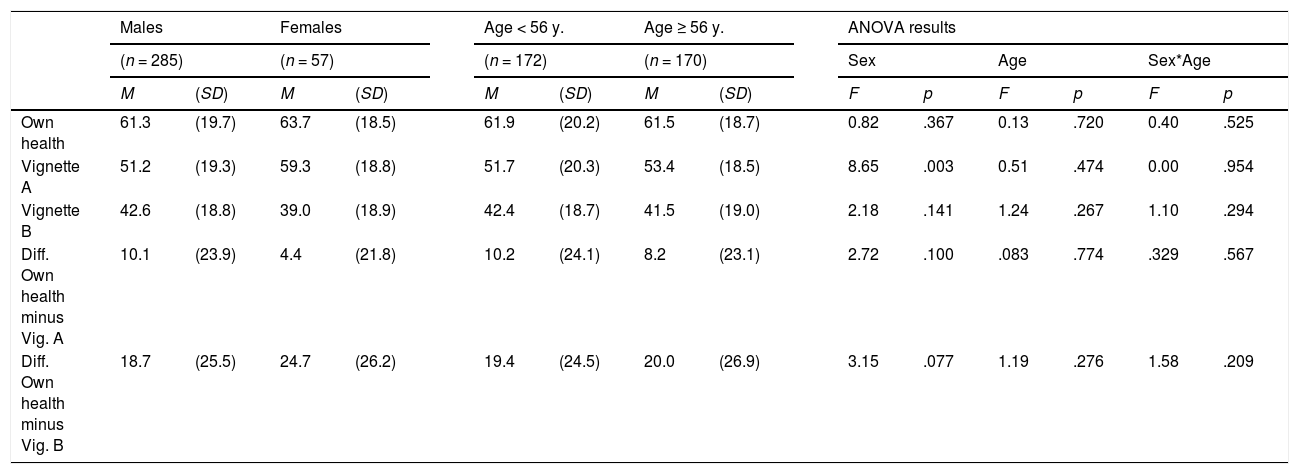
Table 3 presents the patients’ t1 health assessments separately for gender and age groups. The ANOVAs (Table 3) yielded only one statistically significant effect: Females rated vignette A as being significantly healthier than males did (59.3 vs. 51.2, d=0.42).
Mean scores of the patients’ health assessments, separately for age and gender groups.
| Males | Females | Age < 56 y. | Age ≥ 56 y. | ANOVA results | ||||||||||||
|---|---|---|---|---|---|---|---|---|---|---|---|---|---|---|---|---|
| (n = 285) | (n = 57) | (n = 172) | (n = 170) | Sex | Age | Sex*Age | ||||||||||
| M | (SD) | M | (SD) | M | (SD) | M | (SD) | F | p | F | p | F | p | |||
| Own health | 61.3 | (19.7) | 63.7 | (18.5) | 61.9 | (20.2) | 61.5 | (18.7) | 0.82 | .367 | 0.13 | .720 | 0.40 | .525 | ||
| Vignette A | 51.2 | (19.3) | 59.3 | (18.8) | 51.7 | (20.3) | 53.4 | (18.5) | 8.65 | .003 | 0.51 | .474 | 0.00 | .954 | ||
| Vignette B | 42.6 | (18.8) | 39.0 | (18.9) | 42.4 | (18.7) | 41.5 | (19.0) | 2.18 | .141 | 1.24 | .267 | 1.10 | .294 | ||
| Diff. Own health minus Vig. A | 10.1 | (23.9) | 4.4 | (21.8) | 10.2 | (24.1) | 8.2 | (23.1) | 2.72 | .100 | .083 | .774 | .329 | .567 | ||
| Diff. Own health minus Vig. B | 18.7 | (25.5) | 24.7 | (26.2) | 19.4 | (24.5) | 20.0 | (26.9) | 3.15 | .077 | 1.19 | .276 | 1.58 | .209 | ||
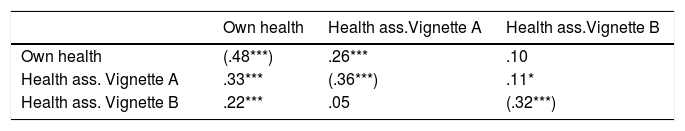
The correlations between the self-rated health and the assessments of the vignettes are given in Table 4. All correlations are positive, that is, higher self-rated health is associated with higher scores of the vignettes’ ratings, especially for vignette A (physical problems). The main diagonal in Table 4 shows the test-retest correlations. Though the vignettes remained unchanged from t1 to t2, the temporal stability of the ratings of the vignettes (r=.36 and r=.32) was lower than the stability of the personal health state ratings (r=.48).
Correlations between health assessments.
| Own health | Health ass.Vignette A | Health ass.Vignette B | |
|---|---|---|---|
| Own health | (.48***) | .26*** | .10 |
| Health ass. Vignette A | .33*** | (.36***) | .11* |
| Health ass. Vignette B | .22*** | .05 | (.32***) |
Note. Upper right triangle: t1 correlations; lower left triangle: t2 correlations; main diagonal: test-retest-correlations. ***: p < .001; *: p < .05.
The correlations between changes Δ (differences between t1 and t2) were as follows: r (Δ own health, Δ Vig. A)=.26 (p<.001), r (Δ own health, Δ Vig. B)=.04 (p=.540), and r (Δ Vig. A, Δ Vig. B)=.14 (p=.020).
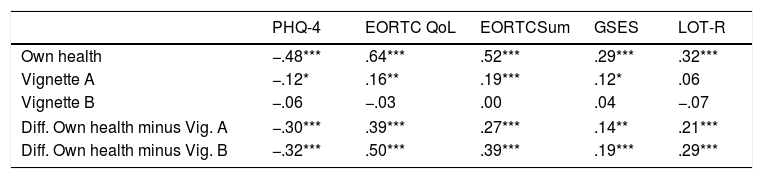
Correlations with other questionnairesTable 5 shows the correlations between the self-rated health states and the ratings of the vignettes with several other scales at t1. As was to be expected, the self-rated health was associated with all components of QoL and mental health. The assessments of vignette A were positively associated with participants’ own QoL (sum score and QoL subscale) and with self-efficacy (GSES), while the correlation with distress (PHQ-4) was negative. Vignette B was not significantly correlated with any of the other questionnaires. While all correlations in the row “difference between own health and vignette A” were in the same direction as those of the first row (own health), the coefficients were smaller than those of the first row.
Correlations between health assessments and other scales (N=342).
| PHQ-4 | EORTC QoL | EORTCSum | GSES | LOT-R | |
|---|---|---|---|---|---|
| Own health | −.48*** | .64*** | .52*** | .29*** | .32*** |
| Vignette A | −.12* | .16** | .19*** | .12* | .06 |
| Vignette B | −.06 | −.03 | .00 | .04 | −.07 |
| Diff. Own health minus Vig. A | −.30*** | .39*** | .27*** | .14** | .21*** |
| Diff. Own health minus Vig. B | −.32*** | .50*** | .39*** | .19*** | .29*** |
Note. *** p < .001; ** p < .01; * p < .05; PHQ-4: Patient Health Questionnaire-4; EORTC QoL: 2-item scale health/QoL; EORTC Sum: sum score; GSES: General Self-Efficacy Scale; LOT-R: Life Orientation Test-Revised (dispositional optimism).
The patients’ self-rated health was worse than that of the general population. The crucial question in the context of this study, however, was the difference in the ratings of the vignettes. In accordance with the first hypothesis, the patients rated the health state of the first vignette A as being significantly better than the general population did. For the second vignette B, however, there were no such group differences between the patients and the general population. It can be concluded that people suffering from a cardiovascular disease and attending a rehabilitation program change their frames of reference for evaluating physical health problems. The comparison of the effect sizes shows that the differences between the patients and the general population in the assessment of vignette A (d = 0.53) is nearly as high as the difference in self-rated health (d = −0.64), and that at t2, the assessment of vignette A (d=0.72) discriminates even better between the groups (patients vs. general population) than the self-rated health state itself does (d = −0.35). The criterion that discriminates best between the groups is the difference between self-rated health and vignette A at t1: While the patients rated their health state as being only 9 points better than vignette A, the people from the general population rated themselves as being 32 points healthier. Since this only applies to vignette A (physical problems) and not to vignette B (mental problems), this cannot be a mere general judgement effect. These results are in line with studies conducted in samples of breast cancer patients (Hinz, 2017) and patients with urologic cancer (Preiß, Friedrich, Stolzenburg, Zenger, & Hinz, 2019).
We did not detect an age effect on the assessment of the vignettes. Females rated vignette A (physical problems) as being significantly healthier than males did. This effect was also observed in an American general population study (Grol-Prokopczyk, Freese, & Hauser, 2011). However, in vignette B (mental problems) this gender effect did not occur. This indicates that female patients (in comparison with male patients) might assess physical problems as being less problematic than mental problems. However, due to the relatively low sample size (57 female patients) we cannot generalize this finding.
There was no negative correlation between participants’ assessments of their own health and that of the vignettes in the patients group. While the expected relationship between the own health state and the assessments of the vignettes was found on the group level, at least for vignette A (patients vs. general population, with higher ratings in the patients’ group), this could not be confirmed on an individual level. Here the correlation between respondents’ assessments of their own health state and that of the vignettes was even slightly positive. Two other studies (Angelini et al., 2014; Hinz et al., 2016) also failed to find such negative correlations. This may be due to certain acquiescence effects (Rammstedt, Danner, & Bosnjak, 2017): While some people tend to give positive answers to all questionnaires, other people prefer more negative answers, which contributes to a positive correlation between the assessments irrespective of the content.
A new approach for examining the relationship between respondents’ assessments of their own health and those described in vignettes is to consider the correlations of individual changes. Contrary to our expectations (and in accordance with the cross-sectional results), we found positive correlations between these changes, especially for the association between self-rated health and the ratings of vignette A (r=.26). During the three month period, the patients did not only experience changes in their health and changes in their frames of reference underlying the vignettes’ assessments, they obviously also underwent changes in their judgment styles. The tendency to give affirmative answers is not only a matter of inter-individual but also of intra-individual differences.
The temporal stability of the assessments of the vignettes was low in magnitude (r=.36 and r=.32 for vignettes A and B, respectively). These coefficients were smaller than those of respondents’ personal health states (r=.48). This is surprising since the respondents’ health states could have changed over the three-month study period, while that of the vignettes did not change at all. Obviously, there is much insecurity or random error in the assessments of the vignettes, a factor that limits the reliability of the ratings. On a group level, averaging across many participants, these error components may rule one another out, resulting in stable group differences between patients and the general population. On the individual level, however, we cannot advise using the assessments of the vignettes as correcting factors for a bias-free assessment of patients’ personal health state.
Some limitations of this study should be noted. The study was performed with cardiovascular patients who generally show heightened levels of physical health problems, mental health problems, and exhaustion (Balog & Konkolÿ Thege, 2019), and it is unclear to what degree the findings can be generalized to other diseases. Health state was measured with a single item. Instruments with more items are generally more reliable. However, single-item instruments can also provide reliable information (Bowling, 2005), at least for research questions on the group level. We used only two specific vignettes. The use of other vignettes with more or less severe health problems might have yielded different results. We used a 0-100 scale, while many studies with anchoring vignettes prefer five answer options, e. g., poor, fair, good, very good, excellent (Grol-Prokopczyk et al., 2011), or very poor, poor, neither good nor poor, good, and very good (Crane, Rissel, Greaves, & Gebel, 2016). The advantage of our scale lies in the metric character which allows us to avoid sophisticated nonparametric statistics. The respondents were asked to assess their own health state and that of the vignette characters. Health state is a rather complex construct. If the focus was on more specific dimensions of health, e.g., physical functioning, the impact of the judgment effects might have been weaker. Several examinations have shown that judgment adaptation processes are more pronounced when a relatively general or broad construct is being evaluated, compared to specific assessments (Finck, Barradas, Zenger, & Hinz, 2018).
The most relevant finding of this study was that there are response shift effects on the group level, which means that patients’ self-assessments of their health state may underestimate the patients’ health problems. Anchoring vignettes are useful tools for detecting such effects.
We acknowledge support from the German Research Foundation (DFG; Grant Number: HI 1108/5-1) and Universität Leipzig within the program of Open Access Publishing.
