
Critical care Area (CCA) is one of the most complex in the hospital system, requiring a high number of interventions and handling of amounts of information. Therefore, these areas are likely to experience more incidents that compromise patient safety (PS).
AimTo determine the perception of the healthcare team in a critical care area about the patient safety culture.
MethodCross-sectional descriptive study, September 2021, in a polyvalent CCA with 45 beds, 118 health workers (physicians, nurses, auxiliary nursing care technicians). Sociodemographic variables, knowledge of the person in charge in PS and their general training in PS and incident notification system were collected. The validated Hospital Survey on Patient Safety Culture questionnaire, measuring 12 dimensions was used.
Positive responses with an average score ≥75%, were defined as an area of strength while ≥50% negative responses were defined as an area of weakness.
Descriptive statistics and bivariate analysis: X2 and t-Student tests, and ANOVA. Significance p ≤ 0.05.
Results94 questionnaires were collected (79.7% sample). The PS score was 7.1 (1.2) range 1−10. The rotational staff scored the PS with 6.9 (1.2) compared to 7.8 (0.9) for non-rotational staff (p = 0.04). A 54.3% (n = 51) was familiar with the incident reporting procedure, 53% (n = 27) of which had not reported any in the last year. No dimension was defined as strength. There were three dimensions that behaved like a weakness: security perception: 57.7% (95% CI: 52.7−62.6), staffing: 81.7% (95% CI: 77.4−85.2) and management support: 69 .9% (95% CI: 64.3−74.9).
ConclusionsThe assessment of PS in the CCA is moderately high, although the rotational staff has a lower appreciation. Half of the staff do not know the procedure for reporting an incident. The notification rate is low. The weaknesses detected are perception of security, staffing and management support. The analysis of the patient safety culture can be useful to implement improvement measures.
El área de críticos (AC) es una de las más complejas dentro del sistema hospitalario, se requiere un elevado número de intervenciones e información, por tanto, son susceptibles de padecer más incidentes que comprometan la seguridad del paciente.
ObjetivoDeterminar la percepción de la cultura de seguridad del paciente del equipo asistencial en un área de críticos.
MétodoEstudio descriptivo transversal, septiembre 2021, en un AC polivalente con 45 camas, 118 sanitarios (médicos, enfermeras, técnicos en cuidados auxiliares de enfermería). Se recogieron variables sociodemográficas, conocimiento del responsable en seguridad del paciente (SP), formación en SP y en el sistema de notificación de incidentes. Se utilizó el cuestionario validado Hospital Survey on Patient Safety Culture que evalúa 12 dimensiones. Se consideró una dimensión como fortaleza con ≥75% respuestas positivas y debilidad con ≥50% respuestas negativas. Estadística descriptiva y análisis bivariante: prueba de X2 y t-Student, y ANOVA. Significación estadística p ≤ 0,05.
ResultadosSe recogieron 94 cuestionarios (79,7% muestra). La valoración del grado de SP fue 7,1 (1,2) sobre 10. El personal polivalente la puntuó con 6,9 (1,2) frente al 7,8 (0,9) del personal sin rotación (p = 0,04). El 54,3% (n = 51) conocía el procedimiento para notificar un incidente, de los cuales el 53% (n = 27) no notificó ninguno en el último año. Ninguna dimensión alcanzó grado de fortaleza. Fueron detectadas como debilidad: percepción de seguridad: 57,7% (IC95%:52,7-62,6), dotación de personal: 81,7% (IC95%:77,4-85,2) y apoyo de gerencia: 69,9% (IC95%:64,3-74,9).
ConclusionesLa valoración del grado de SP en el AC es moderadamente alta, aunque el personal polivalente tiene una apreciación inferior. La mitad del personal no conoce cómo notificar un incidente. La tasa de notificación es baja. Las debilidades detectadas son percepción de seguridad, dotación de personal y apoyo de gerencia. El análisis de la cultura de seguridad puede ser útil para implementar medidas de mejora.
Measuring safety culture is an indicator of best practice and promoting it reduces the incidence of adverse events. Safety culture in critical care areas is an underexplored topic after the COVID-19 crisis, and tackling this issue again offers an opportunity for further improvement.
Implications of the studyDetecting weaknesses enables activities to promote safety in the critical care area. We need to optimise staffing, improve adverse event reporting, implement safety training for healthcare staff, and improve the perception of safety and management support.
Client safety has been a concept of concern to all types of companies since the last century.1 In 1999, the US Institute of Medicine published the study "To Err is Human: Building a Safer Health System",2 which revealed that adverse events (AE) in the healthcare system, understood as unintentional harm caused to the patient by the healthcare intervention and not by the underlying pathology,3 were leading causes of death.
As a result of the US study, actions related to patient safety were initiated worldwide.4 ENEAS,5 the national study on adverse events and SYREC,6 the study on safety and risk among critically ill patients, were conducted in Spain, which established an AE incidence of 9.3% and 33.8% respectively, of which a high percentage, 42.8% and 60%, were potentially avoidable.
Meanwhile, AE reporting systems were started in the healthcare system, with the aim of learning from errors, because their analysis enables measures for improvement. Furthermore, in 2013, the Department of Health of the Government of Catalonia launched the digital platform termed the TPSC Cloud (The Patient Safety Company), a tool for reporting all types of incidents related to patient safety, which is voluntary, confidential, non-punitive, and anonymous.
Safety culture is defined as the product of individual and group values, attitudes, perceptions, competencies, and patterns of behaviour that determine the commitment to an organisation's safety management system,7,8 aimed at minimising the risks of harm to the patient arising from healthcare practice.9,10 Therefore, systematic analysis is crucial to initiate changes in the philosophy of individuals, groups, and institutions.
Intensive care units (ICU) are among the most complex in the hospital system due to their high degree of technification. Patients are increasingly complex, requiring a great many interventions and the handling of large amounts of data. Therefore, these characteristics, intrinsic to the critical patient, are not modifiable and predispose them to undesirable events.4,6,11
Research into safety culture can be considered the first step towards improvement in patient safety. Following the COVID-19 crisis it needs to be talked about again, because few assessments were made during this period in our setting. Therefore, the aim of this research study was to determine the care team’s perception of patient safety culture in a critical care area (CCA).
MethodA cross-sectional descriptive study conducted in an adult CCA in September 2021. The area consists of two ICU units with 20 beds and a semi-critical unit with 25 beds. The sample size was not calculated using a mathematical formula, because the entire population was included due to its accessibility. The sample comprised 118 professionals from the area's healthcare team: nursing staff comprising 78 nurses and 22 auxiliary nursing care technicians (ANCTs), and 18 doctors, regardless of their employment contract, years of work experience, or experience in critical care. Those who did not wish to participate were excluded.
The self-administered questionnaire on patient safety, the Spanish version of the Hospital Survey on Patient Safety Culture developed by the Agency for Healthcare Research and Quality (AHRQ),12 validated in Spanish by the Ministry of Health and Consumer Affairs and the University of Murcia in 2005,13 was used as the measuring instrument.13
This questionnaire consists of 42 items grouped into 12 dimensions and divided into three sections:
- •
Section A. Service/Unit: 22 questions with Likert scale responses ranging from strongly disagree, disagree, indifferent, agree, strongly agree.
- •
Section B. Hospital: 11 questions with Likert scale responses ranging from strongly disagree, disagree, indifferent, indifferent, agree, strongly agree.
- •
Section C. Communication in the service: 9 questions with Likert scale responses ranging from never, almost never, sometimes, almost always, always.
The questionnaire also includes a final section with complementary information, with a total of 12 closed questions and one open question. One question on assessment of the degree of patient safety in the CCA, with a Likert scale of 10 points, 0 being minimum and 10 maximum safety. Eleven questions on socio-demographic and occupational characteristics: profession (doctor/nurse/ANCT), service (ICU/semi-critical care/multi-skilled (multi-skilled being defined as an individual who works in the CCA as well as other hospital services), contact with the patient (yes/no), and number of incidents reported in the last year. The questions from the original questionnaire on years in the profession, years of work in the hospital, and years of work in the department, not affecting the validation or construct of the questionnaire, were merged into one question: total years of professional experience. Age/gender and other questions relevant to the setting in which the study was conducted were added, such as training on the TPSC Cloud platform (yes/no), knowledge of how to report via the TPSC Cloud (yes/no), knowledge of the person responsible for safety in the department (yes/no), and general training in patient safety (yes/no).
A section was included at the beginning of the survey with information on the time required to complete the questionnaire and informed consent, which had to be given to access the questionnaire.
The questionnaire was distributed digitally in Google Forms format via two systems: the service's WhatsApp group and with a QR code enabled in the area through information posters. A reminder was sent after 15 days using the same system. As it was a digital form, it was possible to design it in such a way that all the questions, except for the open question, were obligatory. In this way, the form could only be submitted once all the answers had been completed.
The items of the questionnaire with five response options were coded into three categories: positive, neutral, and negative response, considering that the questionnaire has both positive and negative questions. The coding was made as follows:
- •
In the questions formulated in the positive, the following were considered a positive response: strongly agree/agree/almost always/always; neutral response: indifferent/sometimes and; a negative response: strongly disagree/disagree/never/almost never.
- •
For questions formulated in the negative, a positive response was considered: strongly disagree/disagree/never/almost never; a neutral response: indifferent/sometimes; and a negative response: strongly agree/agree/almost always/always.
This enabled calculation of each dimension using the following formula:

The dimensions were classified as strengths or weaknesses of the safety culture according to the criteria used and recommended by AHRQ, where a strength is considered:
- •
≥75% positive responses (strongly agree/agree, or always/almost always) to questions formulated in the positive.
- •
≥75% negative responses strongly disagree/disagree, or never/almost never) to questions formulated in the negative.
And an opportunity for improvement or weakness:
- •
≥50% negative responses (strongly disagree/disagree, or never/almost never) to questions formulated in the positive.
- •
≥50% positive responses (strongly agree/agree, or always/almost always) to questions formulated in the negative.
The responses to the open-ended question were grouped into four recurrent themes: questionnaire, feelings, training, and working conditions.
Descriptive statistics with mean (standard deviation), absolute, and relative frequencies. The percentage of both negative and positive responses was expressed with a 95% confidence interval (CI).
Bivariate analysis with Student's t-test to determine the relationship between the assessment of the degree of safety and socio-occupational variables (service, training, professional category).
We used χ2 to determine the relationship between the dimensions classified as weakness and profession (nursing staff/medical staff), sex (male/female), service (ICU/semi-critical/multi-skilled), and training (yes/no).
ANOVA was used to determine the difference between dimensions categorised as weakness and years of experience or age.
The level of statistical significance was considered p ≤ .05.
SPSS® version 19 Windows® (IBM Corp., Armonk, NY, USA.) was used for the statistical analysis.
The study was approved by the institution’s ethics and research committee.
ResultsA total of 94 questionnaires were collected, representing 79.7% of the sample. The response rate for each group was 83.3% for nurses, 78.8% for doctors, and 68.2% for ANCT.
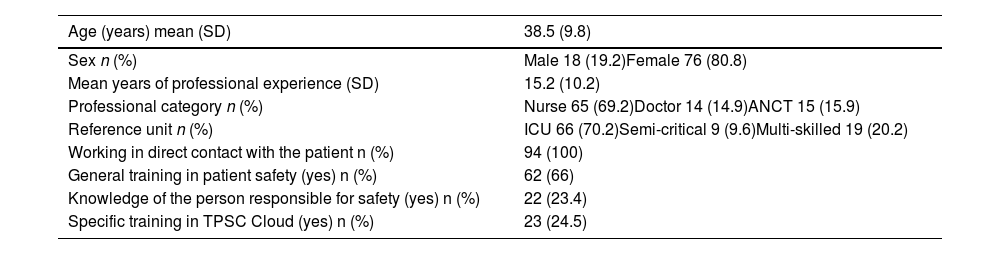
The socio-occupational data are shown in Table 1.
Socio-demographic characteristics and complementary data of the sample (n = 94).
| Age (years) mean (SD) | 38.5 (9.8) |
|---|---|
| Sex n (%) | Male 18 (19.2)Female 76 (80.8) |
| Mean years of professional experience (SD) | 15.2 (10.2) |
| Professional category n (%) | Nurse 65 (69.2)Doctor 14 (14.9)ANCT 15 (15.9) |
| Reference unit n (%) | ICU 66 (70.2)Semi-critical 9 (9.6)Multi-skilled 19 (20.2) |
| Working in direct contact with the patient n (%) | 94 (100) |
| General training in patient safety (yes) n (%) | 62 (66) |
| Knowledge of the person responsible for safety (yes) n (%) | 22 (23.4) |
| Specific training in TPSC Cloud (yes) n (%) | 23 (24.5) |
ANCT: Auxiliary nursing care technicians; TPSC: the Patient Safety Company.
The degree of patient safety in the CCA scored an average of 7.1 (1.2) points. Multi-skilled staff scored it with a mean of 6.9 (1.2) points vs. 7.8 (.9) (p = .04) scored by staff with an assigned position in the area.
There were no statistically significant differences between the safety rating and whether or not they had training, years of experience in the CCA, or professional category (doctor/nurse).
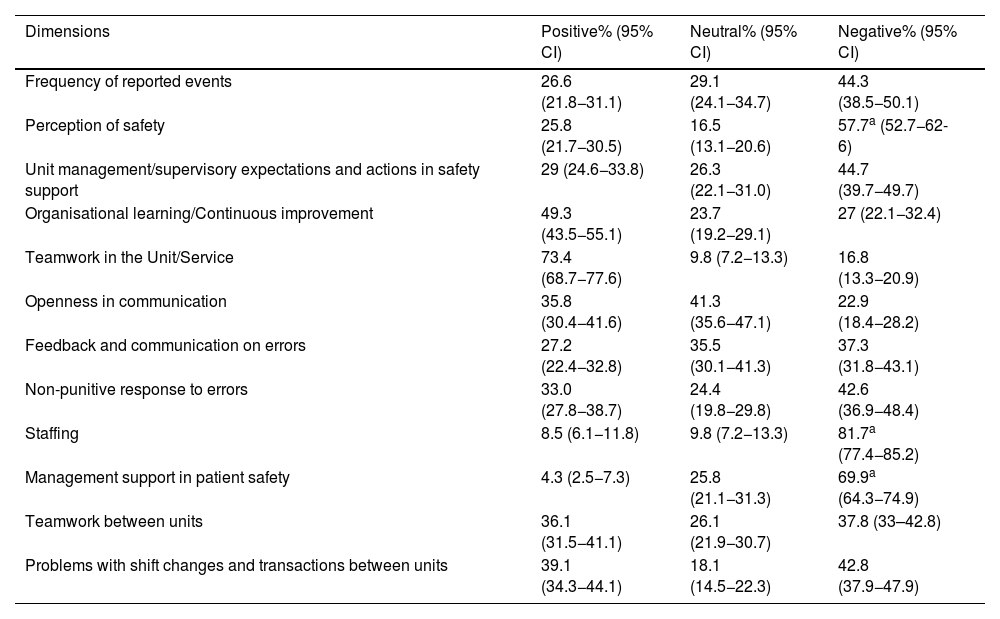
Analysis of strengths and weaknessesIn the scores for each dimension (Table 2), the perception of teamwork within the CCA obtained the highest percentage of positive responses at 73.4% (95% CI: 68.7−77.6), although according to AHRQ criteria, no dimension reached the level of strength in safety culture.
Positive, negative, and neutral scores for each dimension of the AHRQ questionnaire.
| Dimensions | Positive% (95% CI) | Neutral% (95% CI) | Negative% (95% CI) |
|---|---|---|---|
| Frequency of reported events | 26.6 (21.8−31.1) | 29.1 (24.1−34.7) | 44.3 (38.5−50.1) |
| Perception of safety | 25.8 (21.7−30.5) | 16.5 (13.1−20.6) | 57.7a (52.7−62-6) |
| Unit management/supervisory expectations and actions in safety support | 29 (24.6−33.8) | 26.3 (22.1−31.0) | 44.7 (39.7−49.7) |
| Organisational learning/Continuous improvement | 49.3 (43.5−55.1) | 23.7 (19.2−29.1) | 27 (22.1−32.4) |
| Teamwork in the Unit/Service | 73.4 (68.7−77.6) | 9.8 (7.2−13.3) | 16.8 (13.3−20.9) |
| Openness in communication | 35.8 (30.4−41.6) | 41.3 (35.6−47.1) | 22.9 (18.4−28.2) |
| Feedback and communication on errors | 27.2 (22.4−32.8) | 35.5 (30.1−41.3) | 37.3 (31.8−43.1) |
| Non-punitive response to errors | 33.0 (27.8−38.7) | 24.4 (19.8−29.8) | 42.6 (36.9−48.4) |
| Staffing | 8.5 (6.1−11.8) | 9.8 (7.2−13.3) | 81.7a (77.4−85.2) |
| Management support in patient safety | 4.3 (2.5−7.3) | 25.8 (21.1−31.3) | 69.9a (64.3−74.9) |
| Teamwork between units | 36.1 (31.5−41.1) | 26.1 (21.9−30.7) | 37.8 (33–42.8) |
| Problems with shift changes and transactions between units | 39.1 (34.3−44.1) | 18.1 (14.5−22.3) | 42.8 (37.9−47.9) |
AHRQ: Agency for Healthcare Research and Quality.
In reference to negative responses, the dimension of safety perception at 57.7% (95% CI 52.7−62-6), staffing at 81.7% (95% CI 77.4−85.2), and management support at 69.9% (95% CI 64.3−74.9) had the highest percentages of negative safety perception.
There was no statistically significant difference between dimension 2 (perception of safety) and having or not having training, either in relation to professional category – doctor/nurse – or in relation to years of experience in the service.
Nor were statistically significant differences established between dimension 9 (staffing) and socio-occupational variables such as years of experience, training, or professional category – doctor/nursing staff.
Nursing staff, at 90.0 vs. 57.2% of medical staff (p < .01), and women, at 89.5 vs. 66.7% for the men (p = .04) had a more negative perception of dimension 10 (management support).
Notification of eventsOut of all the respondents, 51 care team members (54.3%) stated that they knew the procedure for reporting an incident in the TPSC Cloud, of these 27 (53%) reported no incidents in the last year, 22 (43%) reported between one and five incidents, and 2 (4%) between 6 and 10. The medical professionals reported on average 1.5 (2.7) errors per year vs. .4 (1) for the nursing staff (p < .01). Although no statistically significant differences were found in knowledge of how to report an error among the medical staff at 71.4% vs. 51.3% of the nursing staff.
A total of 64.3% of the doctors said they were aware of the role of the safety officer vs. 16.3% of the nursing staff (p < .01).
The open-ended question received a total of 18 responses (19.14%). It was classified into four categories for exploration. Perception of high workload was most commented with eight responses (44.4%), followed by insufficient training with seven responses (38.8%), complexity of the TPSC Cloud form with two responses (11.3%), and fear of reporting errors with one response (5.5%).
DiscussionThe CCA care team detected weaknesses in PS culture, with low reporting of AEs. The staff's rating of the degree of PS in the CCA was moderately high, as in several studies carried out recently in different hospital contexts7,14,15 and slightly lower compared with the study conducted in a Spanish ICU16 after the third wave of the COVID-19 pandemic, which obtained a score of eight out of ten, and where the more senior professionals had a higher perception than new recruits. Although it is difficult to know the impact of the coronavirus crisis on this score, in this study it was not the years of experience but the multi-skilled professionals who scored almost one point lower. This may be because staff turnover prevents knowledge of aspects specific to each unit that directly influence the perception of safety.17
Although no dimensions were found that reached the level of strength, as in other studies,8,14,18 the dimension of teamwork within the same service achieved the highest rate of positive responses, and a healthy working environment, with good collaboration between doctors and nurses, or having experienced nurses, as reported in the literature review by Al Ma’mari et al.,19 improves the perception of quality of care.4,18,20
The weaknesses detected were perception of safety, staffing, and management support. With regard to the perception of safety, understood as the professional's belief that they work in a way that may compromise patient safety to an extent, which may be due to the intense work rhythm of an ICU4,21 and to factors such as fatigue, emotional exhaustion, and workload, because physical and mental tiredness may alter neurocognitive functions such as attention and concentration.19 Indeed, staffing was another dimension identified as a weakness. There are consistent studies on workload, which conclude that areas with higher patient/healthcare staff ratios are more at risk of AEs.22,23 Specifically, in the study by Neuraz et al.,24 conducted in eight French ICUs, the risk of death was found to increase by 3.5 (95% CI 1.3–9.1) when the patient-to-nurse ratio was higher than 2.5 patients and by 2.0 (95% CI 1.3–3.2) when the patient-to-doctor ratio was higher than 14 patients. Similarly, in the study by Khanna et al.,25 they observed that ICU stay was prolonged when the patient-nurse ratio increased, with a hazard ratio of .96 (95% CI .94–.98, p < .001). It can be stated, therefore, that the ratio influences the care team's perception of safety.26
It is surprising, therefore, that the CCA team members’ assessment of the degree of safety was high yet the perception of safety dimension, which includes the questions specific to this concept, was detected as a weakness. This potential contradiction may be due to a lack of knowledge of all the parameters encompassed under the concept of patient safety,27 although we cannot rule out the influence of the great care pressure to which the ICUs of the Spanish health system have been subjected, which even had to readapt all the Zero projects to this new scenario due to the difficulty in maintaining its recommendations.28
Management support was another area identified for improvement, as in other studies.16,29 Levine et al.30 concluded that the nursing supervisor is an essential figure in fostering a favourable climate to encourage reporting errors, providing support, and responsiveness. In a qualitative study conducted by Souza et al.17 in Brazilian ICUs, the sources of institutional or system error were perceived as excessive staff turnover, care overload, undervaluing of professionals, and poor working conditions, and the fact that when an error occurs, changes are slow and impermanent or, as Varallo et al.31 report, there is no feedback between care staff and managers. In fact, more than three quarters of the professionals were unaware of the person responsible for safety in the CCA, which may increase the perception of remoteness and lack of support.
Belonging to the nursing team or being female are factors that significantly influence the perception of lack of support from management. This could be due to the difference between nursing and medical management in the context studied, and because there is high nursing staff turnover, constant shift changes, and new recruits, which could lead to the impression that management does not value these professionals.17
The low rate of incident reporting is striking, almost half of the participants had not reported any incident in the last 12 months and, although this is not classified as a weakness of the system, the existence of a punitive culture in the event of error was perceived, as in the review by Batista et al.7 It is known that error produces guilt, stress, fear, anger, and shame,32 which can be highlighted as potential causes of under-reporting, and more than half of the population studied stated that they were not aware of the reporting system, which reveals shortcomings in training.
In the area studied, doctors report more compared to nursing staff, unlike other studies, where exactly the opposite occurs.29 This could be related to the characteristics of the area where the study was conducted, since the person responsible for safety is also the department’s head physician, who is present at daily meetings, visiting hours, and on-call duty, and therefore these professionals may be invited or encouraged to make a report. Varallo et al.31 point out that nurses cite lack of knowledge, guilt in making an error or in reporting the error of others, lack of time, and increased workload as justification for under-reporting, since they are at the bedside 24 h a day, and prioritise caring for the needs of patients and relatives.
Data collection being in a single hospital and the introduction of new questions without a prior pilot may be limitations of the study, and therefore the results should be viewed with some caution. However, the high participation gives a broad view on the perception of safety in a CCA and the new questions do not interfere with the construct of the questionnaire, are specific to the context studied, easy to understand, and were considered important as they have been little explored in the past.
It is also not possible to determine what impact the COVID-19 pandemic may have had on these results. However, the results were similar to studies prior to this pandemic, and therefore it appears that these are endemic weaknesses that have not been resolved over time and need to be addressed.
Although there are other ICU-specific surveys to assess safety culture, we used the AHRQ because it has been validated in our setting.
ConclusionsThe assessment of the degree of patient safety in the CCA is considerable, although multi-skilled staff working in different units have a lower perception.
No strengths were found. The weaknesses detected were perception of safety, staffing, and management support.
Many staff are unaware of who the person responsible for safety is in the service or how to report an incident, and the reporting rate is low, which suggests the need for new training proposals and improvements in communication and dissemination strategies.
Analysis of the safety culture is crucial to diagnose the area and offers the opportunity to implement improvement plans.
With results such as these, it should be mandatory for organisations to react and lead projects to strengthen the safety culture.
FundingNo funding was received for this study.
Conflict of interestsThe authors have no conflict of interests to declare.