


To analyse and compare the ability of procalcitonin (PCT), C-reactive protein (CRP) and leukocytes to differentiate true bacteraemia from contaminated blood cultures in patients seen in the emergency department (ED) for an episode of infectious disease.
MethodsObservational, retrospective and descriptive analytical study of all blood cultures with positive growth extracted in an ED in adult patients (≥18 years) during 2016 and 2017. The follow-up was carried out over a 30-day period to calculate the predictive power and the prognostic performance for true bacteraemia.
ResultsA total of 266 blood cultures with positive growth were included in the study. Out of these, 154 (57.9%) were considered true bacteraemia and 112 (42.1%) were considered to be contaminated blood cultures. The area under the Receiver Operating Characteristic curve (AUC-ROC) for PCT to predict true bacteraemia was 0.983 (95% CI: 0.972–0.994; p<0.001) and, considering a cut-off value of ≥0.43ng/ml, PCT achieved 94% sensitivity, 91% specificity, positive predictive value of 94%, and negative predictive value of 92%. The AUC-ROC obtained for CRP was 0.639 (95% CI: 0.572–0.707, p<0.001), for leukocytes of 0.693 (95% CI: 0.630–0.756, p<0.001) and for immature leukocytes (>10% bands) of 0.614 (95% CI: 0.547–0.682, p<0.001). The mean values for PCT were 3.44 (SD 6.30)ng/ml in true bacteraemia vs 0.16 (SD 0.18)ng/ml in contaminated blood cultures (p<0.001).
ConclusionsIn blood cultures with positive growth extracted in an ED, PCT achieves the best prognostic performance of true bacteraemia vs contaminated blood cultures, better than CRP and leukocytes.
Analizar y comparar la capacidad de la procalcitonina (PCT), proteína C reactiva (PCR) y leucocitos para diferenciar la bacteriemia verdadera de los hemocultivos (HC) contaminados en los pacientes atendidos en el servicio de urgencias (SU) por un episodio de infección.
MétodosEstudio observacional, retrospectivo y analítico de todos los HC con crecimiento positivo extraídos en un SU en los pacientes adultos (≥18 años) durante los años 2016 y 2017. Se realizó seguimiento durante 30 días y se calculó el poder y rendimiento pronóstico de bacteriemia verdadera.
ResultadosSe incluyeron 266 casos de HC con crecimiento positivo. De ellos se consideraron como bacteriemias verdaderas 154 (57,9%) y como HC contaminantes 112 (42,1%). Para la predicción de bacteriemia verdadera la PCT obtiene un área bajo la curva Receiver Operating Characteristic (ABC-ROC) de 0,983 (IC 95%: 0,972-0,994; p<0,001) y con un punto de corte de PCT≥0,43ng/ml se consigue una sensibilidad del 94%, una especificidad del 91%, un valor predictivo positivo de 94% y un valor predictivo negativo de 92%. El ABC-ROC obtenida para la PCR fue de 0,639 (IC 95%: 0,572-0,707; p<0,001), para el recuento de leucocitos de 0,693 (IC 95%: 0,630-0,756; p<0,001) y para las formas inmaduras (>10% cayados) de 0,614 (IC 95%: 0,547-0,682; p=0,001). Los valores medios al comparar la PCT en las bacteriemias verdaderas y los HC contaminados fueron de 3,44ng/ml (DE 6,30) frente a 0,16ng/ml (DE 0,18), p<0,001.
ConclusionesEn los HC con crecimiento positivo extraídos en el SU la PCT consigue el mejor rendimiento pronóstico de bacteriemia verdadera diferenciándola de los HC contaminados, mayor que la PCR y los leucocitos.
14.3% of patients who attend hospital emergency departments (HEDs) are diagnosed in the end with an infectious process. In their assessment, samples are taken for microbiological testing in 43% of them, in whom the drawing of blood cultures (BC), which is carried out in 14.6% of patients with infection in the HED, predominate.1
Despite new rapid detection techniques,2 BCs continue to be the main technique for the aetiological diagnosis of bacteraemia. They provide information on the sensitivity of the isolated microorganism and promote optimisation of antimicrobial therapy.2–4 Diagnostic yield is highly variable (2–20%),3 while those considered “contaminated BCs” (ideally <3%)2,3 may reach rates of 30–50%.5–7 This fact is a real problem, as it tends to involve an increase in diagnostic tests, length of hospital stay, in costs and the administration of unnecessary antibiotic treatments.2,8 At present, the incidence of community-acquired bacteraemia has increased up to 1–2/1000 cases of HED care.3 The aetiology is due to gram-positive bacteria in 30–35% of cases, gram-negative bacteria in 65–70% and anaerobic bacteria in around 1%.3,5,6 This ratio can change depending on contaminated BC rates in favour of gram-positive bacteria (coagulase-negative staphylococci [CoNS], Bacillus spp., Streptococcus viridans, Micrococcus spp., Propionibacterium spp., Corynebacterium spp. and other gram-positive bacilli). Regarding true bacteraemia (TB), in terms of the focus, urinary tract infection with 45–55% and respiratory focus (10–25%) are the most common. The most frequently isolated bacteria are Escherichia coli, Staphylococcus aureus and Streptococcus pneumoniae.3
Crude mortality rate at 30 days of patients with positive BCs in the HED have been estimated at between 10 and 25%,3 in relation to the severity of the clinical situation (existence of sepsis-septic shock), the primary focus, consideration of TB and the patients’ characteristics (age, comorbidity, etc.).3,9,10
The suspicion and detection of bacteraemia is therefore very important, as this has a diagnostic and prognostic significance and makes it necessary to change some of the most important decisions (discharge-admission, draw BC, administer the appropriate antimicrobial and at an early stage, etc.).11–14 However, being able to have access to objective tools, such as biomarkers, which could predict both the existence of bacteraemia in the HED and which would have clinical relevance (TB), would also be relevant.15,16 Therefore, this secondary objective would have an added value for the confirmation of bacteraemia, as the existence of contaminated BCs may be an obstacle for the true clinical-microbiological diagnosis and the diagnostic-therapeutic management of these findings. In this way, the clinician would be able to make urgent decisions safely by predicting that, in the event of a hypothetical situation of positive BCs being related to contamination in the technique of obtaining them.15,16
The objective of this study was to analyse and compare the ability of procalcitonin (PCT), C-reactive protein (CRP) and a white blood cell count to differentiate TB from contaminated BCs in patients seen at the HED due to an episode of infection.
Material and methodsDesign and study siteAn observational, retrospective and analytical study of the microbiological characteristics of all BCs with positive growth drawn in the HED from adult patients (≥18 years of age). Patient follow-up was performed for 30 days. It was conducted in a tertiary university hospital with 786 beds belonging to the Castilla La Mancha Health Service.
Study periods and population includedAll BCs from patients diagnosed clinically with an infectious process in the HED in whom analytical samples were also obtained to perform a blood count, biochemistry and biomarkers (PCT and CRP) from January 2016 to December 2017 were included consecutively. Paediatric and obstetric-gynaecological patients were excluded. The indication for a BC request was carried out according to the criteria of the responsible physician. The study followed all the protocols and standards of our centre and also international ones (Declaration of Helsinki) for the use of patients’ data. The data were encoded to ensure confidentiality of the same, and the approval of the Independent Ethics Committee was not required due to the descriptive nature of the study. The computerised medical record and primary care record were reviewed when required.
Definitions, techniques and methods established for the samplesThe drawing of BCs was performed by the standard percutaneous venepuncture technique. Two separate draws were carried out in each patient, with 20min between each draw. For each of them, two bottles (corresponding to the aerobic and anaerobic medium: BD BACTEC®) were inoculated, respectively. The BCs were transported manually to the microbiology department for immediate processing with the automated reading system Bactec/Alert® (bioMérieux, Durham, NC, USA). The inoculation time of the BCs was five to seven days, except in cases of suspicion of endocarditis, brucellosis or at the request of the responsible physician, when it was extended to up to 30 days. True bacteraemia was defined as the isolation of normally pathogenic bacteria in one or two BCs with a compatible clinical picture. And contaminated BC was defined as the isolation in a single BC bottle of CoNS, Bacillus spp., S. viridans, Micrococcus spp., Propionibacterium spp., Corynebacterium spp. and other gram-positive bacilli when the absence of clinical significance was interpreted in these cases (confirmed according to the history and/or criteria of the responsible physician and/or microbiology). In other cases, when there were two positive BCs and a clinical significance attributed to them (especially in immunosuppressed individuals or in those with vascular catheters inserted or after invasive tests) TB was considered and was treated with antibiotics.
The reference values of our laboratory were adopted for the biomarkers. For CRP: 0–8mg/l. Method of determination: quantitative enzyme immunoassay (VITROS CRP® slides) with a sensitivity of 1mg/l. For PCT, the following reference values were used: <0.5ng/ml. Method: quantitative electrochemiluminescence immunoassay ELECSYS (BRAHMS PCT®) with a sensitivity of 0.02ng/ml.
Recorded variablesSociodemographic variables (age, gender, institutionalisation), the taking of antibiotics in the previous 72h and/or the previous three months, admission in the previous three months and the existence of comorbidities (solid tumour or oncohaematological disease, liver disease, nephropathy, diabetes, chronic heart disease or cerebrovascular disease, chronic obstructive pulmonary disease, peripheral arterial disease or connective tissue disease and infection due to human immunodeficiency virus [HIV]) were recorded. The Charlson Comorbidity Index17 weighted by age (and dichotomised ≥3 points) and the functional status (Barthel Index18 and dichotomised ≤60) were calculated. Clinical and severity data were recorded: temperature in degrees, altered level of consciousness defined as <15 points on the Glasgow Coma Scale, systolic blood pressure (SBP), sepsis, severe sepsis or septic shock criteria and their defining variables according to the 2001 International Sepsis Definitions Conference,19 a qSOFA sepsis score ≥2 and its constituting variables according to the Third International Consensus Definitions for Sepsis and Septic Shock (SEPSIS-3).20 Progression and destination variables were included: number of previous days in the clinic, initial destination of the patients, number of hospital stay days, re-consultation in the HED, hospital mortality and 30-day mortality. In relation to the blood tests, the white blood cell count (as well as the existence of leukocytosis >12,000/mm3, leukopenia <4000/mm3 or bands >10%), CRP concentration in mg/l (and dichotomised ≥9mg/l) and that of PCT in ng/ml (and dichotomised for ≥0.5ng/ml, for ≥1ng/ml) and for the cut-off point obtained with the best yield were recorded.
Statistical analysisFor the association between the confirmation of TB and independent variables, means and their standard deviations were used for quantitative variables and percentages for qualitative variables. The chi-square test, Fisher's exact test, Student's t-test and Mann–Whitney U test were used, as applicable, to investigate the correlation between the existence of TB vs contaminated BCs and the independent variables (and the dichotomised variables). A p value <0.05 was considered significant. The contrasts were bilateral. A descriptive analysis (absolute numbers and percentages) of both groups (TB vs contaminated BCs) was performed in relation to the type of pathogen found overall and differentiated according to whether it was the isolation of gram-positive, gram-negative or anaerobic bacteria, as well as depending on the focus or clinical diagnosis performed in the HED.
The efficacy and ability of PCT, CRP, white blood cell count and percentage of bands to differentiate TB from the contaminated BCs was studied by analysing the Receiver Operating Characteristic (ROC) curve with the 95% confidence interval (CI) of the area under the ROC curve (AUC) and it was compared against the neutral value (0.5). The standard errors of the AUC were calculated by non-parametric methods. Youden's index was used to determine the cut-off points (CP) in the CRP and PCT values with the greatest diagnostic ability that maximised the difference between the true positive rate and the false positive rate. The sensitivity, specificity, positive predictive value (PPV), negative predictive value (NPV), positive likelihood ratio (LR+) and negative likelihood ratio (LR−) were found for all the results studied. Their 95% CIs were found by exact binomial methods and by the Taylor series method in the case of the likelihood ratios. The statistical analysis was performed using the IBM-SPSS® Statistics 22 package for Windows.
ResultsDuring the study period, 240,336 patients were seen at the HED. A total of 8404 BCs were drawn, which means 34.96 BCs for every 1000 patients seen at the HED. The mean age of patients in whom BCs were obtained was 63 (19) with a range between 18 and 99. Of these, 4828 were males (57.44%) and 3576 (42.56%) were females. From these patients, 1604 isolations (19.08%) were recorded. Of these positive BCs, 907 (56.55%) were considered as TB (seven of them polymicrobial) and 697 (43.45%) as contaminated BCs. Therefore, the diagnostic yield ([no. of cases of true bacteraemia/no. of BCs performed]×100) was 10.79% and the contamination rate ([no. of contaminated BCs/no. of BCs performed]×100) was 8.29%. Therefore, the incidence of TB was 3.77/1000 patients seen at the HED. Out of the cases of TB, 23 (2.53%) were discharged directly from the HED (“occult bacteraemia”). The inclusion of episodes flow diagram is shown in Fig. 1. Out of these 1604 positive BCs, only 266 cases (16.58%) with positive growth in which PCT and CRP drawn in the HED were available were included by chance in the study. A total of 154 (57.9%) of these were considered as true bacteraemia and 112 (42.1%) as contaminated BCs.

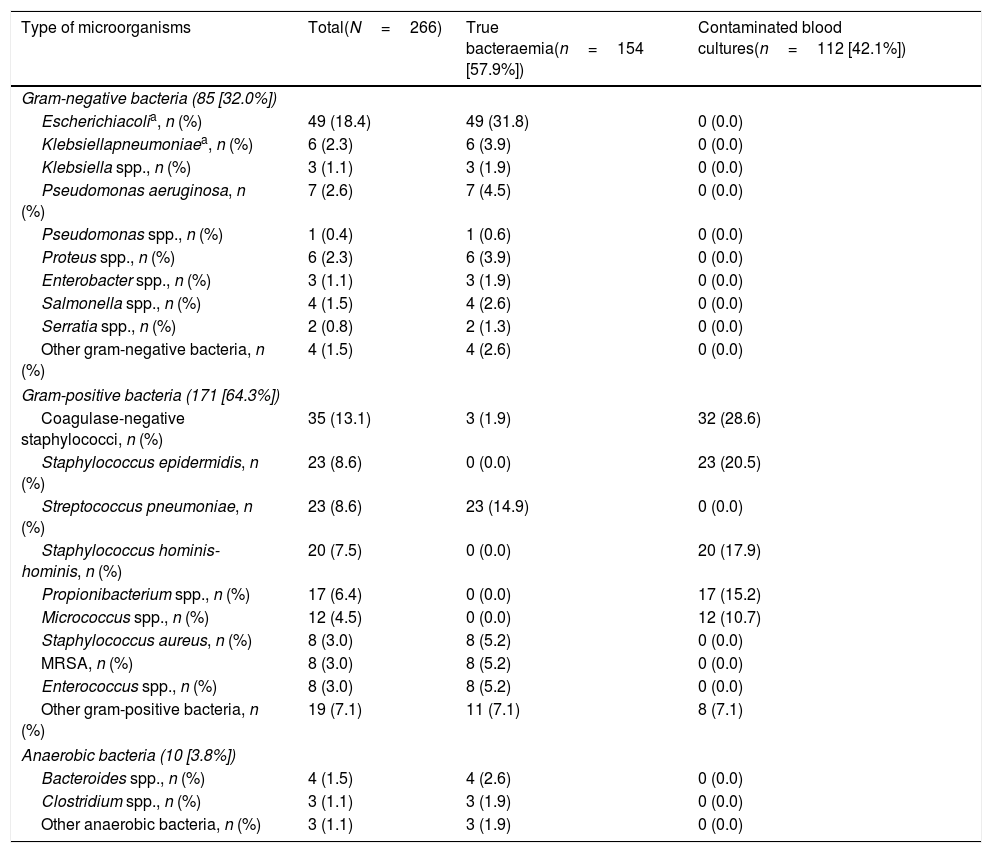
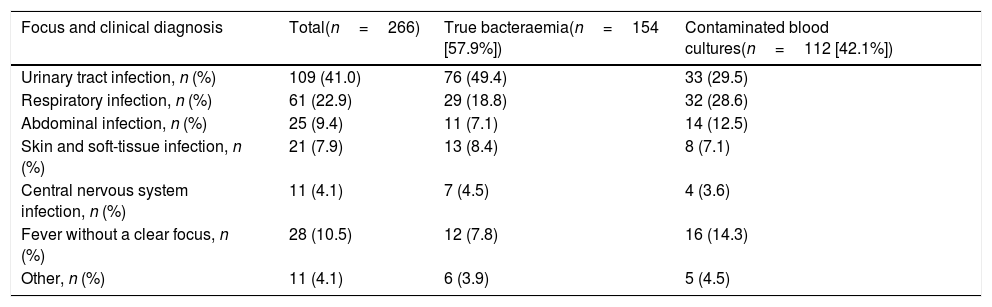
Aetiology grouped by microorganisms of the TB is shown in Table 1. The most common isolations were E. coli with/without extended-spectrum beta-lactamases (ESBL) on 346 occasions (38.14%), methicillin-susceptible/resistant S. aureus on 73 (8.04%) and S. pneumoniae on 34 (3.74%). E. coli was also the most common pathogen in cases of occult bacteraemia on 12 occasions (52%). Regarding contaminated BCs, the most common bacteria were: (1) CoNS: 318 (21.07%); (2) Staphylococcus epidermidis: 126 (7.85%); (3) Staphylococcus hominis-hominis 116 (7.23%); (4) Propionibacterium spp. 57 (3.55%); and (5) Micrococcus spp. 32 (3.52%). The focus or presumptive clinical origin in the HED of cases of true bacteraemia and contaminated BCs is shown in Table 2. Furthermore, the final diagnoses in cases of contaminated BCs after direct discharge from the HED or from hospitalisation are indicated in Table 3.
Microbiological characteristics of the overall sample according to the type of isolation (true bacteraemia vs contaminated blood cultures).
| Type of microorganisms | Total(N=266) | True bacteraemia(n=154 [57.9%]) | Contaminated blood cultures(n=112 [42.1%]) |
|---|---|---|---|
| Gram-negative bacteria (85 [32.0%]) | |||
| Escherichiacolia, n (%) | 49 (18.4) | 49 (31.8) | 0 (0.0) |
| Klebsiellapneumoniaea, n (%) | 6 (2.3) | 6 (3.9) | 0 (0.0) |
| Klebsiella spp., n (%) | 3 (1.1) | 3 (1.9) | 0 (0.0) |
| Pseudomonas aeruginosa, n (%) | 7 (2.6) | 7 (4.5) | 0 (0.0) |
| Pseudomonas spp., n (%) | 1 (0.4) | 1 (0.6) | 0 (0.0) |
| Proteus spp., n (%) | 6 (2.3) | 6 (3.9) | 0 (0.0) |
| Enterobacter spp., n (%) | 3 (1.1) | 3 (1.9) | 0 (0.0) |
| Salmonella spp., n (%) | 4 (1.5) | 4 (2.6) | 0 (0.0) |
| Serratia spp., n (%) | 2 (0.8) | 2 (1.3) | 0 (0.0) |
| Other gram-negative bacteria, n (%) | 4 (1.5) | 4 (2.6) | 0 (0.0) |
| Gram-positive bacteria (171 [64.3%]) | |||
| Coagulase-negative staphylococci, n (%) | 35 (13.1) | 3 (1.9) | 32 (28.6) |
| Staphylococcus epidermidis, n (%) | 23 (8.6) | 0 (0.0) | 23 (20.5) |
| Streptococcus pneumoniae, n (%) | 23 (8.6) | 23 (14.9) | 0 (0.0) |
| Staphylococcus hominis-hominis, n (%) | 20 (7.5) | 0 (0.0) | 20 (17.9) |
| Propionibacterium spp., n (%) | 17 (6.4) | 0 (0.0) | 17 (15.2) |
| Micrococcus spp., n (%) | 12 (4.5) | 0 (0.0) | 12 (10.7) |
| Staphylococcus aureus, n (%) | 8 (3.0) | 8 (5.2) | 0 (0.0) |
| MRSA, n (%) | 8 (3.0) | 8 (5.2) | 0 (0.0) |
| Enterococcus spp., n (%) | 8 (3.0) | 8 (5.2) | 0 (0.0) |
| Other gram-positive bacteria, n (%) | 19 (7.1) | 11 (7.1) | 8 (7.1) |
| Anaerobic bacteria (10 [3.8%]) | |||
| Bacteroides spp., n (%) | 4 (1.5) | 4 (2.6) | 0 (0.0) |
| Clostridium spp., n (%) | 3 (1.1) | 3 (1.9) | 0 (0.0) |
| Other anaerobic bacteria, n (%) | 3 (1.1) | 3 (1.9) | 0 (0.0) |
MRSA: methicillin-resistant Staphylococcus aureus.
Other gram-negative bacteria (4): Citrobacter freundii+Haemophilus influenzae+Providencia stuartii+Morganella morganii.
Other gram-positive bacteria (11 true bacteraemia): Listeria monocytogenes, Streptococcus agalactiae, Streptococcus mitis.
Other gram-positive bacteria (8 contaminants) Viridans group streptococci, Staphylococcus hominis, Staphylococcus capitis, Staphylococcus capitis-capitis, Corynebacterium spp.
Focus/presumptive clinical diagnosis in the emergency department of the overall sample according to the type of isolation (true bacteraemia vs contaminated blood cultures).
| Focus and clinical diagnosis | Total(n=266) | True bacteraemia(n=154 [57.9%]) | Contaminated blood cultures(n=112 [42.1%]) |
|---|---|---|---|
| Urinary tract infection, n (%) | 109 (41.0) | 76 (49.4) | 33 (29.5) |
| Respiratory infection, n (%) | 61 (22.9) | 29 (18.8) | 32 (28.6) |
| Abdominal infection, n (%) | 25 (9.4) | 11 (7.1) | 14 (12.5) |
| Skin and soft-tissue infection, n (%) | 21 (7.9) | 13 (8.4) | 8 (7.1) |
| Central nervous system infection, n (%) | 11 (4.1) | 7 (4.5) | 4 (3.6) |
| Fever without a clear focus, n (%) | 28 (10.5) | 12 (7.8) | 16 (14.3) |
| Other, n (%) | 11 (4.1) | 6 (3.9) | 5 (4.5) |
Other foci of infection: gynaecological, endocarditis, external devices.
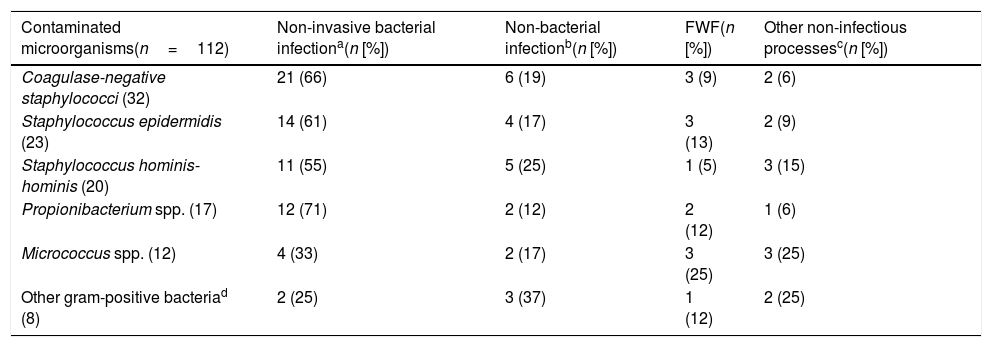
Focus/final clinical diagnosis after discharge from the emergency department or from hospitalisation of the contaminated blood culture cases.
| Contaminated microorganisms(n=112) | Non-invasive bacterial infectiona(n [%]) | Non-bacterial infectionb(n [%]) | FWF(n [%]) | Other non-infectious processesc(n [%]) |
|---|---|---|---|---|
| Coagulase-negative staphylococci (32) | 21 (66) | 6 (19) | 3 (9) | 2 (6) |
| Staphylococcus epidermidis (23) | 14 (61) | 4 (17) | 3 (13) | 2 (9) |
| Staphylococcus hominis-hominis (20) | 11 (55) | 5 (25) | 1 (5) | 3 (15) |
| Propionibacterium spp. (17) | 12 (71) | 2 (12) | 2 (12) | 1 (6) |
| Micrococcus spp. (12) | 4 (33) | 2 (17) | 3 (25) | 3 (25) |
| Other gram-positive bacteriad (8) | 2 (25) | 3 (37) | 1 (12) | 2 (25) |
FWF: fever without a clear or defined focus.
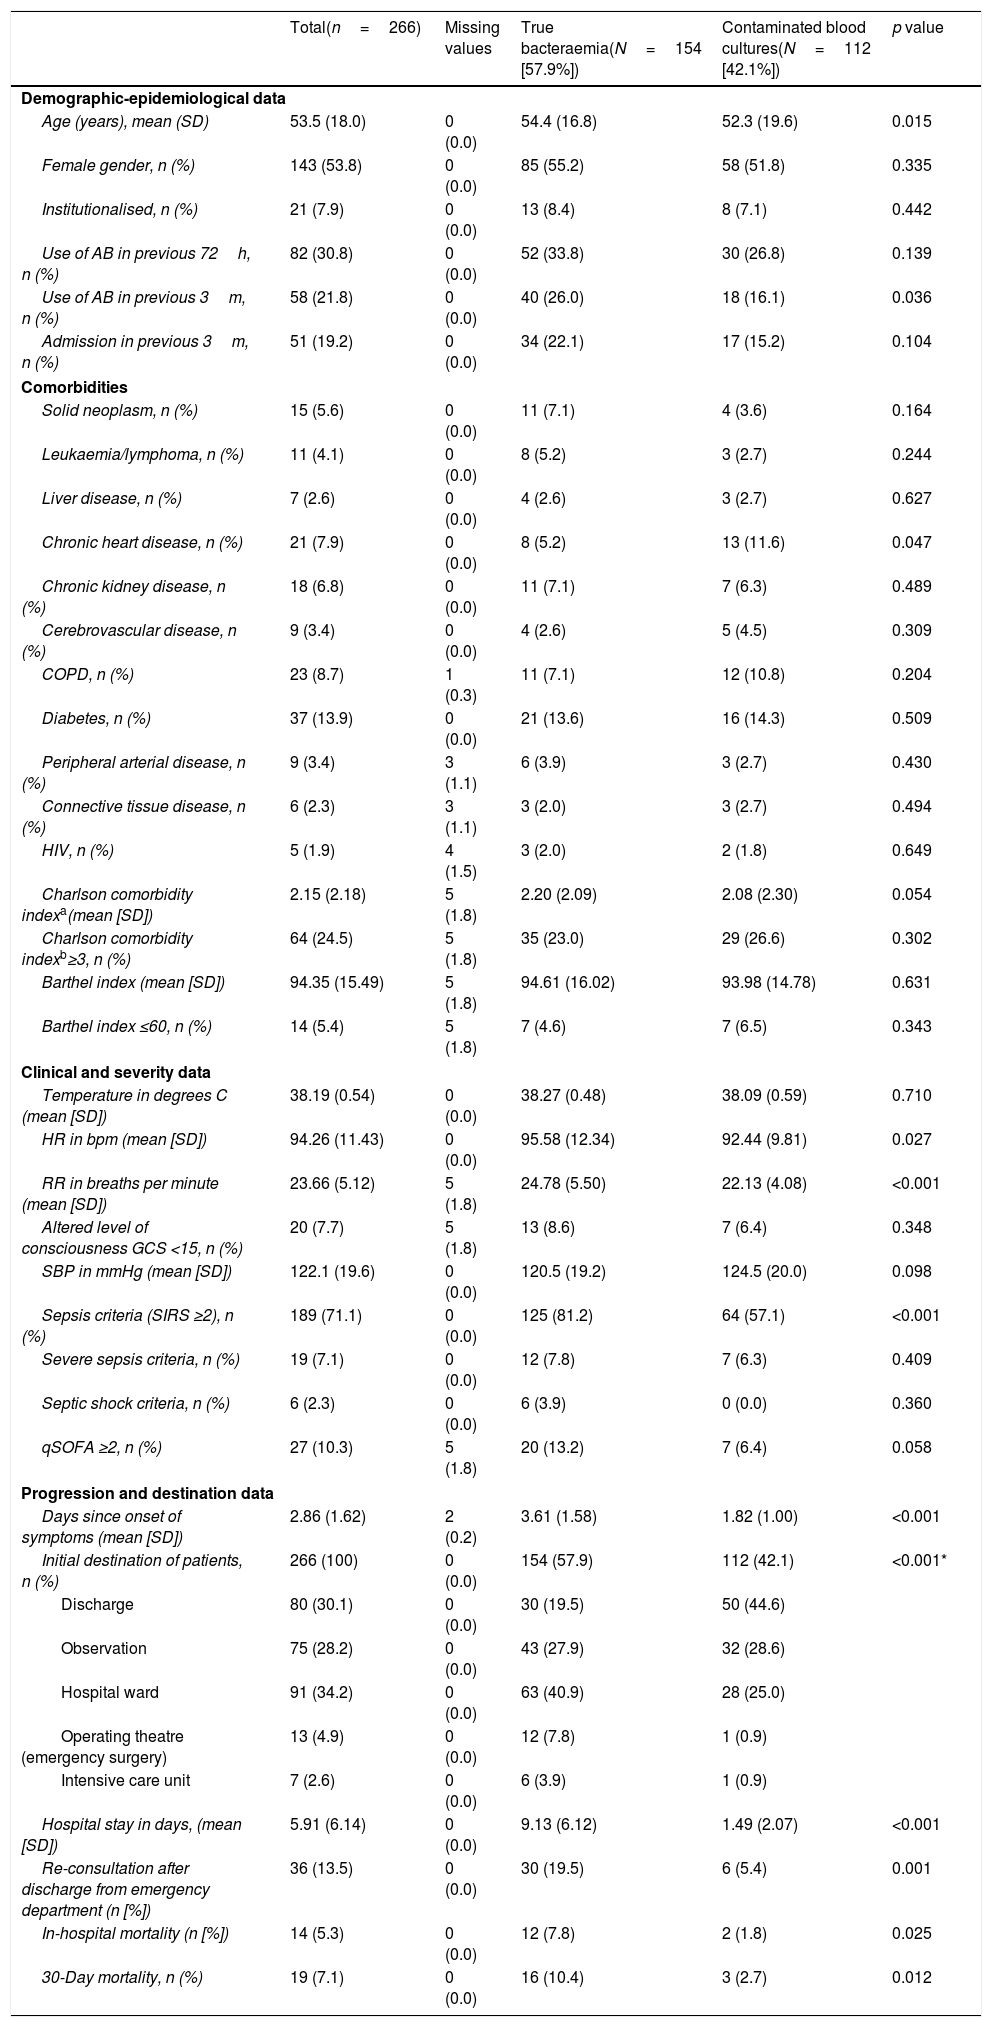
Table 4 shows the sociodemographic and epidemiological characteristics and comorbidities (Charlson Comorbidity Index), functional (Barthel Index), clinical, severity, patient progression and destination characteristics. When comparing patients with TB and with BCs, significant differences were only found in age (54.4 [16.8] vs 52.3 [19.6] years, p=0.015) and in the existence of chronic heart disease (greater in TB, p=0.015). With regard to the clinical presentation data, only heart rate (95.98 [12.34] vs 92.44 [9.81]bpm, p=0.027), breathing rate (24.78 [5.50] vs 22.13 [4.08] breaths per minute, p<0.001) and the classic sepsis criteria (SIRS ≥2) (81.2% vs 57.1%, p<0.001) were greater in cases of TB. Furthermore, they also had significant differences, with p<0.001 in favour of TB in previous days in the clinic (3.61 [1.58] vs 1.82 [1.0] days) and the percentage of cases admitted in the ward, ICU or those referred to surgery. The crude mortality rate of the patients who were admitted with TB at 30 days was 10.4% (16 deaths), greater (p=0.012) than that of contaminated BC cases of 3% (three cases).
Clinicoepidemiological characteristics of progression and destination of the overall sample and univariate study according to the type of isolation (true bacteraemia vs contaminated blood cultures).
| Total(n=266) | Missing values | True bacteraemia(N=154 [57.9%]) | Contaminated blood cultures(N=112 [42.1%]) | p value | |
|---|---|---|---|---|---|
| Demographic-epidemiological data | |||||
| Age (years), mean (SD) | 53.5 (18.0) | 0 (0.0) | 54.4 (16.8) | 52.3 (19.6) | 0.015 |
| Female gender, n (%) | 143 (53.8) | 0 (0.0) | 85 (55.2) | 58 (51.8) | 0.335 |
| Institutionalised, n (%) | 21 (7.9) | 0 (0.0) | 13 (8.4) | 8 (7.1) | 0.442 |
| Use of AB in previous 72h, n (%) | 82 (30.8) | 0 (0.0) | 52 (33.8) | 30 (26.8) | 0.139 |
| Use of AB in previous 3m, n (%) | 58 (21.8) | 0 (0.0) | 40 (26.0) | 18 (16.1) | 0.036 |
| Admission in previous 3m, n (%) | 51 (19.2) | 0 (0.0) | 34 (22.1) | 17 (15.2) | 0.104 |
| Comorbidities | |||||
| Solid neoplasm, n (%) | 15 (5.6) | 0 (0.0) | 11 (7.1) | 4 (3.6) | 0.164 |
| Leukaemia/lymphoma, n (%) | 11 (4.1) | 0 (0.0) | 8 (5.2) | 3 (2.7) | 0.244 |
| Liver disease, n (%) | 7 (2.6) | 0 (0.0) | 4 (2.6) | 3 (2.7) | 0.627 |
| Chronic heart disease, n (%) | 21 (7.9) | 0 (0.0) | 8 (5.2) | 13 (11.6) | 0.047 |
| Chronic kidney disease, n (%) | 18 (6.8) | 0 (0.0) | 11 (7.1) | 7 (6.3) | 0.489 |
| Cerebrovascular disease, n (%) | 9 (3.4) | 0 (0.0) | 4 (2.6) | 5 (4.5) | 0.309 |
| COPD, n (%) | 23 (8.7) | 1 (0.3) | 11 (7.1) | 12 (10.8) | 0.204 |
| Diabetes, n (%) | 37 (13.9) | 0 (0.0) | 21 (13.6) | 16 (14.3) | 0.509 |
| Peripheral arterial disease, n (%) | 9 (3.4) | 3 (1.1) | 6 (3.9) | 3 (2.7) | 0.430 |
| Connective tissue disease, n (%) | 6 (2.3) | 3 (1.1) | 3 (2.0) | 3 (2.7) | 0.494 |
| HIV, n (%) | 5 (1.9) | 4 (1.5) | 3 (2.0) | 2 (1.8) | 0.649 |
| Charlson comorbidity indexa(mean [SD]) | 2.15 (2.18) | 5 (1.8) | 2.20 (2.09) | 2.08 (2.30) | 0.054 |
| Charlson comorbidity indexb≥3, n (%) | 64 (24.5) | 5 (1.8) | 35 (23.0) | 29 (26.6) | 0.302 |
| Barthel index (mean [SD]) | 94.35 (15.49) | 5 (1.8) | 94.61 (16.02) | 93.98 (14.78) | 0.631 |
| Barthel index ≤60, n (%) | 14 (5.4) | 5 (1.8) | 7 (4.6) | 7 (6.5) | 0.343 |
| Clinical and severity data | |||||
| Temperature in degrees C (mean [SD]) | 38.19 (0.54) | 0 (0.0) | 38.27 (0.48) | 38.09 (0.59) | 0.710 |
| HR in bpm (mean [SD]) | 94.26 (11.43) | 0 (0.0) | 95.58 (12.34) | 92.44 (9.81) | 0.027 |
| RR in breaths per minute (mean [SD]) | 23.66 (5.12) | 5 (1.8) | 24.78 (5.50) | 22.13 (4.08) | <0.001 |
| Altered level of consciousness GCS <15, n (%) | 20 (7.7) | 5 (1.8) | 13 (8.6) | 7 (6.4) | 0.348 |
| SBP in mmHg (mean [SD]) | 122.1 (19.6) | 0 (0.0) | 120.5 (19.2) | 124.5 (20.0) | 0.098 |
| Sepsis criteria (SIRS ≥2), n (%) | 189 (71.1) | 0 (0.0) | 125 (81.2) | 64 (57.1) | <0.001 |
| Severe sepsis criteria, n (%) | 19 (7.1) | 0 (0.0) | 12 (7.8) | 7 (6.3) | 0.409 |
| Septic shock criteria, n (%) | 6 (2.3) | 0 (0.0) | 6 (3.9) | 0 (0.0) | 0.360 |
| qSOFA ≥2, n (%) | 27 (10.3) | 5 (1.8) | 20 (13.2) | 7 (6.4) | 0.058 |
| Progression and destination data | |||||
| Days since onset of symptoms (mean [SD]) | 2.86 (1.62) | 2 (0.2) | 3.61 (1.58) | 1.82 (1.00) | <0.001 |
| Initial destination of patients, n (%) | 266 (100) | 0 (0.0) | 154 (57.9) | 112 (42.1) | <0.001* |
| Discharge | 80 (30.1) | 0 (0.0) | 30 (19.5) | 50 (44.6) | |
| Observation | 75 (28.2) | 0 (0.0) | 43 (27.9) | 32 (28.6) | |
| Hospital ward | 91 (34.2) | 0 (0.0) | 63 (40.9) | 28 (25.0) | |
| Operating theatre (emergency surgery) | 13 (4.9) | 0 (0.0) | 12 (7.8) | 1 (0.9) | |
| Intensive care unit | 7 (2.6) | 0 (0.0) | 6 (3.9) | 1 (0.9) | |
| Hospital stay in days, (mean [SD]) | 5.91 (6.14) | 0 (0.0) | 9.13 (6.12) | 1.49 (2.07) | <0.001 |
| Re-consultation after discharge from emergency department (n [%]) | 36 (13.5) | 0 (0.0) | 30 (19.5) | 6 (5.4) | 0.001 |
| In-hospital mortality (n [%]) | 14 (5.3) | 0 (0.0) | 12 (7.8) | 2 (1.8) | 0.025 |
| 30-Day mortality, n (%) | 19 (7.1) | 0 (0.0) | 16 (10.4) | 3 (2.7) | 0.012 |
AB: antibiotics; bpm: beats per minute; C: Celsius; COPD: chronic obstructive pulmonary disease; h: hours; HIV: human immunodeficiency virus; HR: heart rate; m: months; n: number; RR: respiratory rate; SD: standard deviation.
Sepsis criteria (SIRS ≥2) according to the 2001 International Sepsis Definitions Conference (Levy et al.19), sepsis criteria (qSOFA ≥2) according to the Third International Consensus Definitions for Sepsis and Septic Shock (Sepsis-3) (Singer et al.20), p<0.05 (comparison 2×2 of the groups).
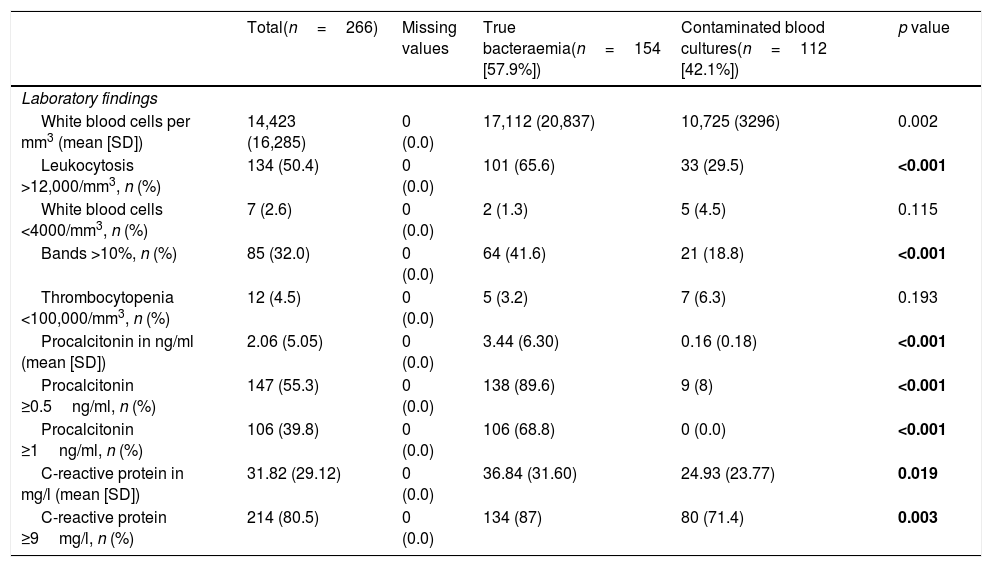
Regarding the comparison of analytical values (Table 5), significant differences were found in the absolute white blood cell count (17,112 [20,837] vs 10,725 [3296] per mm3, p=0.002) and in the event of existence of leukocytosis >12,000/mm3 (65.6% vs 29.5, p<0.001) and proportion >10% of bands (41.6% vs 18.8, p<0.001). For CRP, there were differences with greater mean concentrations in TB (36.84 [31.60] vs 24.93mg/l [23.77], p=0.019) and with CP ≥9mg/l (87% vs 71.4%, p=0.003). Lastly, for PCT greater differences were obtained between concentrations (3.44 [6.30] vs 0.16ng/ml [0.18], p<0.001) and also both with CP ≥0.5ng/ml (89.6% vs 8%, p=0.003), and with CP ≥1ng/ml (68.8% vs 0.0%; p<0.001).
Analytical characteristics of the global sample and univariate study according to the type of isolation (true bacteraemia vs contaminated blood cultures).
| Total(n=266) | Missing values | True bacteraemia(n=154 [57.9%]) | Contaminated blood cultures(n=112 [42.1%]) | p value | |
|---|---|---|---|---|---|
| Laboratory findings | |||||
| White blood cells per mm3 (mean [SD]) | 14,423 (16,285) | 0 (0.0) | 17,112 (20,837) | 10,725 (3296) | 0.002 |
| Leukocytosis >12,000/mm3, n (%) | 134 (50.4) | 0 (0.0) | 101 (65.6) | 33 (29.5) | <0.001 |
| White blood cells <4000/mm3, n (%) | 7 (2.6) | 0 (0.0) | 2 (1.3) | 5 (4.5) | 0.115 |
| Bands >10%, n (%) | 85 (32.0) | 0 (0.0) | 64 (41.6) | 21 (18.8) | <0.001 |
| Thrombocytopenia <100,000/mm3, n (%) | 12 (4.5) | 0 (0.0) | 5 (3.2) | 7 (6.3) | 0.193 |
| Procalcitonin in ng/ml (mean [SD]) | 2.06 (5.05) | 0 (0.0) | 3.44 (6.30) | 0.16 (0.18) | <0.001 |
| Procalcitonin ≥0.5ng/ml, n (%) | 147 (55.3) | 0 (0.0) | 138 (89.6) | 9 (8) | <0.001 |
| Procalcitonin ≥1ng/ml, n (%) | 106 (39.8) | 0 (0.0) | 106 (68.8) | 0 (0.0) | <0.001 |
| C-reactive protein in mg/l (mean [SD]) | 31.82 (29.12) | 0 (0.0) | 36.84 (31.60) | 24.93 (23.77) | 0.019 |
| C-reactive protein ≥9mg/l, n (%) | 214 (80.5) | 0 (0.0) | 134 (87) | 80 (71.4) | 0.003 |
n: number; SD: standard deviation.
The data (p-values) in bold are those in which there are statistically significant differences with p<0.05.
When comparing specifically the values obtained with the only pathogen found in the two groups (coagulase-negative staphylococci: 3 TB vs 32 contaminated BCs), the results are very similar to the general results. For the absolute white blood cell count (14,423 [16,285] vs 10,456 [4356] per mm3, p=0.064), proportion >10% of bands (25% vs 33%, p<0.603), for CRP (6.00 [3.00] vs 27.32mg/l [24.93], p=0.019) and for PCT greater differences were also obtained between concentrations (1.10 [0.33] vs 0.26ng/ml [0.21], p<0.001). In three cases of TB, there was growth in two pairs of BCs and they corresponded to two central nervous system infections related to the ventricular shunt systems, and one associated with central catheter infection. The final diagnoses of the 32 cases defined as contaminated BCs are shown in Table 3.
Fig. 2 describes the AUROC values of PCT, CRP, white blood cell count and the immature forms (bands) to predict the existence of TB vs contaminated BCs. Although the AUROC obtained for CRP of 0.639 (95% CI: 0.572–0.707, p<0.001), for the white blood cell count of 0.693 (95% CI: 0.630–0.756, p<0.001) and for the immature forms (>10% bands) of 0.614 (95% CI: 0.547–0.682, p=0.001) are significant, PCT shows a much greater ability than these, with an AUROC of 0.983 (95% CI: 0.972–0.994, p<0.001). This difference is evident when checking that the higher values of the 95% CIs of the AUROC of CRP, white blood cells and young forms (0.707, 0.756 and 0.682, respectively) are clearly lower than the lowest value of the 95% CI of PCT (0.972).
; PCT: procalcitonin (ng/ml). p-value: indicates the risk of a type I error in the null hypothesis test where the AUROC is 0.5.")
Predictive ability of true bacteraemia by the biomarkers in patients seen in the emergency department due to infection.
AUROC: area under the receiver operating characteristic curve; CI: confidence interval; CRP: C-reactive protein (mg/l); PCT: procalcitonin (ng/ml).
p-value: indicates the risk of a type I error in the null hypothesis test where the AUROC is 0.5.
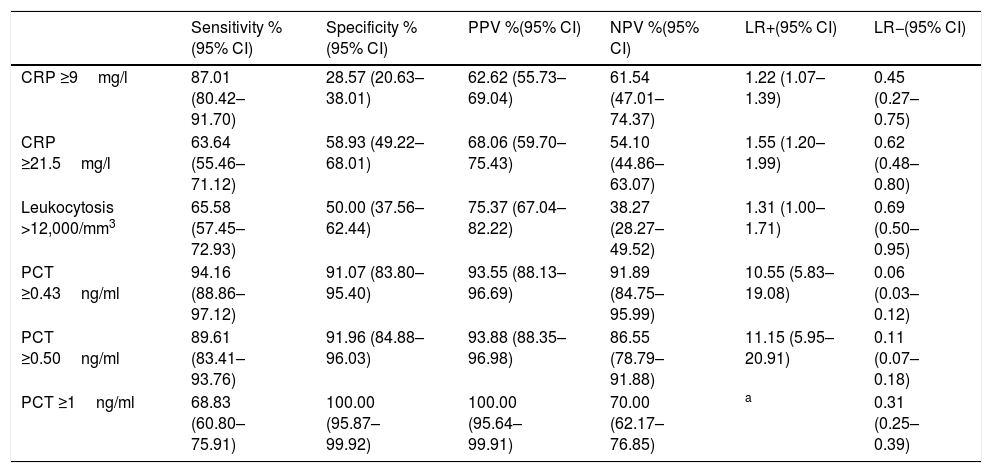
The CP of PCT which obtains the best prognostic yield is ≥0.43ng/ml, with which a sensitivity of 94.16% (95% CI: 88.86–97.12), a specificity of 91.07% (95% CI: 83.80–95.40), a PPV of 93.55% (95% CI: 88.13–96.69), a NPV of 91.89% (95% CI: 84.75–95.99), an LR+ of 10.55 (95% CI: 5.83–19.08) and an LR− of 0.06 (95% CI: 0.03–0.12) is obtained. All the diagnostic yield values for TB of the different CP for PCT, CRP and white blood cells are shown in Table 6.
Cut-off points and performance for predicting true bacteraemia in blood cultures drawn in emergency departments with positive isolation.
| Sensitivity %(95% CI) | Specificity %(95% CI) | PPV %(95% CI) | NPV %(95% CI) | LR+(95% CI) | LR−(95% CI) | |
|---|---|---|---|---|---|---|
| CRP ≥9mg/l | 87.01 (80.42–91.70) | 28.57 (20.63–38.01) | 62.62 (55.73–69.04) | 61.54 (47.01–74.37) | 1.22 (1.07–1.39) | 0.45 (0.27–0.75) |
| CRP ≥21.5mg/l | 63.64 (55.46–71.12) | 58.93 (49.22–68.01) | 68.06 (59.70–75.43) | 54.10 (44.86–63.07) | 1.55 (1.20–1.99) | 0.62 (0.48–0.80) |
| Leukocytosis >12,000/mm3 | 65.58 (57.45–72.93) | 50.00 (37.56–62.44) | 75.37 (67.04–82.22) | 38.27 (28.27–49.52) | 1.31 (1.00–1.71) | 0.69 (0.50–0.95) |
| PCT ≥0.43ng/ml | 94.16 (88.86–97.12) | 91.07 (83.80–95.40) | 93.55 (88.13–96.69) | 91.89 (84.75–95.99) | 10.55 (5.83–19.08) | 0.06 (0.03–0.12) |
| PCT ≥0.50ng/ml | 89.61 (83.41–93.76) | 91.96 (84.88–96.03) | 93.88 (88.35–96.98) | 86.55 (78.79–91.88) | 11.15 (5.95–20.91) | 0.11 (0.07–0.18) |
| PCT ≥1ng/ml | 68.83 (60.80–75.91) | 100.00 (95.87–99.92) | 100.00 (95.64–99.91) | 70.00 (62.17–76.85) | a | 0.31 (0.25–0.39) |
CI: confidence interval; CRP: C-reactive protein; LR+: positive likelihood ratio; LR−: negative likelihood ratio; NPV: negative predictive value; PCT: procalcitonin; PPV: positive predictive value.
The cut-off points with the best diagnostic performance were used, as well as other cut-off points chosen by the authors (values defined by the laboratory as normal or significant) in order to perform comparisons with other studies.
In recent years, different reviews have proposed different criteria, including biomarkers, to optimise the indications for obtaining BCs in HEDs, and therefore improve their efficacy (increasing the number of positives), effectiveness (reducing the contaminants) and their efficiency (costs and processing, improves the appropriateness of the antibiotic therapy, discharge or admission decision).11–13 In this scenario, taking into account that the vast majority of BCs which are sent to the microbiology department for processing are obtained in HEDs, we must not forget the diagnostic, prognostic and therapeutic importance of the suspicion and confirmation of bacteraemia.3,11,12,21 In this regard, biomarkers, and in particular PCT, have demonstrated their great ability to predict the existence of bacteraemia, and even when to indicate the need to obtain a BC in patients in the HED.11,12 However, few studies15,16 have been designed to analyse the ability of biomarkers to differentiate between positive BCs, TB and contaminated BCs.
The results of the study confirm that the number of BCs drawn in our HED (34.96 BCs/1000 patients seen) is greater than the majority of studies in adults, which vary between 5–20 BCs/1000 patients seen,3,5,14,15,21 but lower than those published in paediatric emergency departments.7 On the other hand, the diagnostic yield of 10.79% is similar to that obtained in the majority of comparative studies (2–20%),3,6,7,21 but the contamination rate of 8.29% is much higher than that reported by these same studies (1–3%)3,6,7,21 as, from all our isolations, only 56.55% were considered TB and 43.45% contaminated BCs. This fact represents a real quality and safety problem for the patient, as these findings involve an increase in complementary tests and may be an obstacle for the diagnosis, increase the length of the hospital stay, costs and the administration of unnecessary antibiotic treatments.2,8,22 With regard to this situation, the interest in determining those cases where the clinical manifestations are subtle or undetermined (for example in elderly people, individuals with neutropenia or some of those treated previously with antibiotics) or in confirming the clinical suspicion of contamination of the BCs is evident, and may improve the diagnostic-therapeutic strategy to follow with the patient.
Directly related to the ability of PCT to be able to predict the existence of TB and differentiate this from isolations in contaminated BCs, our results confirm that the excellent yield obtained with the CPs of PCT ≥0.5ng/ml (and 0.43) is much higher than that obtained by CRP and/or the white blood cell count, as some authors, such as Jeong et al.,15 had already pointed out. The differences in the mean concentrations of PCT in our study when comparing the cases of TB with contaminated BCs (3.44 [6.30] vs 0.16 [0.18]ng/ml, p<0.001) were similar to those published by Jeong et al.,15 with 3.2ng/ml in TB and 0.3ng/ml in the cases of gram-positive bacteria considered to be contaminants (p<0.0001). Similarly, the AUROC of PCT of 0.86 (95% CI: 0.83–0.89) found by these authors is much higher, as in our case, to that of CRP. All of this coincides with that published previously by Schuetz et al.,23 with an AUROC of 0.98, although in this case with a small sample (n=40) and with the restriction of defining contaminated BC when the isolation was only of CoNS. More recently, Watanabe et al.24 found significant differences in 133 positive BCs between E. coli and BC with isolation of S. epidermidis and Staphylococcus lugdunensis, considered contaminants in which the PCT recorded in all was a value of <0.5ng/ml. With a similar sample (88 cases of TB compared to 49 contaminated BCs) Oksuz et al.16 also confirmed these findings with the same CP (<0.5ng/ml) obtaining a sensitivity of 68%, a specificity of 66% and a NPV of 94%, with an AUROC also of 0.86 to distinguish TB from contaminated BCs. On the basis of the above, in the event of the existence of concentrations of PCT ≥0.5ng/ml (and/or 0.43ng/ml) in the HED, it would be indicated to obtain a BC due to the greater probability of them being positive, and also when there is isolation it would be assumed that it will be TB, ruling out the possible contamination of BCs with a specificity greater than 91%. Furthermore, these data reinforce some existing recommendations12,25 for the drawing of BCs in HEDs when PCT is >0.5ng/ml possessing an NPV of >91% to rule out contamination. This means that if PCT has a value of 0.1–0.43ng/ml, it will be necessary to consider the clinical situation (sepsis criteria) to assess whether or not to indicate extracting BCs.11,12,25 In our study, if we raise the CP to 1ng/ml of PCT, we achieve a specificity and a PPV of 100%, reducing the sensitivity to 68%, but Jeong et al.15 prefer to use a CP of 0.99ng/ml to achieve a specificity of 98% (very similar to ours) with which they predict the existence of TB.
The crude mortality rate of the bacteraemia group was 10.4% at 30 days from the extraction of the BCs in the HED, in the ranges published by other authors (10–25%)3,9,10 and significantly greater than the group of patients with contaminated BCs of 2.7% (p<0.001).
This study has different limitations, such as its retrospective and single-centre nature with a very high rate of contaminated BCs, although the results represent the true reflection of the epidemiology and clinical reality in our HED, but they cannot be extrapolated and lack external validity. Furthermore, the fact that only cases in which biomarkers were also obtained were included by chance (266 out of 1604, 16.58%) could have determined a selection bias by not contemplating the characteristics of those not included (a little more than 80%). Another possible limitation, not controllable due to the retrospective nature of the study, which could have resulted in some bias or information deficit, would be the fact of not being able to take into account in all the cases the effect of the previous taking of antibiotics,25 as these could have mitigated or modified the clinical manifestations in some patients with contaminated BCs, or there may even be some cases, which have not been detected, with high concentrations of PCT and negative BCs which did really originate from a bacterial infection, and even with sepsis criteria.12,25
With the results of our study, we believe that PCT can help to predict the existence of TB in the HED and, therefore, prevent possible collateral and adverse effects (such as the conduct of diagnostic tests and the administration of unnecessary antibiotic treatments, re-consultations in emergency departments, prolonged hospital stays, costs, etc.).2,8,26,27 It would be necessary to promote a multicentre study with the same objectives in the near future in order to validate the results.
As a conclusion to our study, we can state that in BCs with positive growth drawn in the HED, PCT obtains the best prognostic yield of TB, differentiating it from contaminated BCs, greater than CRP and white blood cells.
Conflicts of interestAJJ took part in scientific meetings organised by Roche, Thermo Scientific Biomarkers, B.R.A.H.M.S. AG and bioMérieux.
The authors declare that they have no conflicts of interest with regards to this article.
No authors received any payment for participating in this study.
Please cite this article as: Zafar Iqbal-Mirza S, Serrano Romero de Ávila V, Estévez-González R, Rodríguez-González D, Heredero-Gálvez E, Julián-Jiménez A. Capacidad de la procalcitonina para diferenciar bacteriemia verdadera de los hemocultivos contaminados en el servicio de urgencias. Enferm Infecc Microbiol Clin. 2019;37:560–568.
