


Hospital malnutrition is a highly prevalent problem that affects patient morbidity and mortality resulting in longer hospital stays and increased healthcare costs. Although there is no single nutritional screening method, subjective global assessment (SGA) may be a useful, inexpensive, and easily reproducible tool.
MethodsA cross-sectional, observational, randomized study was conducted in 197 patients in a tertiary hospital. SGA, anthropometric data, and biochemical parameters were used to assess the nutritional status of study patients.
ResultsFifty percent of subjects were malnourished according to SGA. A higher prevalence of malnutrition was found in medical (53%) as compared to surgical departments (47%). Half the subjects (50%) had malnutrition by SGA, but only 37.8% received nutritional treatment during their hospital stay. Mean hospital stay was longer for patients malnourished (13.5 days) or at risk of malnutrition (12.1 days) as compared to well nourished subjects (6.97 days). SGA significantly correlated (P<0.012) with anthropometric and biochemical malnutrition parameters.
ConclusionsPrevalence of hospital malnutrition is very high in both medical and surgical departments and is inadequately treated. SGA is a useful tool for screening hospital malnutrition because of its high degree of correlation with anthropometric and biochemical parameters.
La desnutrición hospitalaria es un problema de alta prevalencia que afecta a la morbimortalidad de los pacientes, lo que comporta una mayor estancia y un incremento de los costes sanitarios. Aunque no existe un único método de despistaje nutricional, la valoración subjetiva global (VSG) puede ser una herramienta útil, económica y fácilmente reproducible.
MétodosEstudio transversal, observacional y aleatorio realizado en 197 pacientes de un hospital terciario. Se utilizó la VSG y se determinaron datos antropométricos y parámetros bioquímicos para evaluar el estado nutricional de los pacientes estudiados.
ResultadosEl porcentaje de sujetos desnutridos fue del 50% según la VSG. Se observó una mayor prevalencia de desnutrición en los servicios médicos (53%) que en los quirúrgicos (47%). La mitad de los sujetos estudiados (50%) presentó desnutrición mediante la VSG, de los cuales solo un 37,5% recibió tratamiento nutricional durante su estancia hospitalaria. La estancia media de los pacientes desnutridos (13,5 días) o en riesgo de desnutrición (12,1 días) fue mayor que la de aquellos sujetos bien nutridos (6,97 días). La VSG se correlacionó de forma significativa (p < 0,012) con los parámetros antropométricos y bioquímicos de desnutrición.
ConclusionesLa prevalencia de desnutrición hospitalaria es muy alta, tanto en servicios médicos como quirúrgicos y, sin embargo, es incorrectamente tratada. La VSG es una herramienta útil de despistaje de desnutrición hospitalaria por su alto grado de correlación con parámetros bioquímicos y antropométricos.
Malnutrition is defined as a syndrome characterized by impaired body composition resulting from a negative balance in the energy and/or protein compartment. Malnutrition is associated with physiological, biochemical, and immune changes which increase morbidity and mortality, hospital stay,1–3 and healthcare costs.3–6 The significance of inflammation has also been noted in recent years, because it is increasingly identified as an important factor that increases the risk of malnutrition and mortality, and may contribute to a suboptimal response to nutritional intervention.7
The early detection of malnutrition should therefore be a priority throughout the hospital stay. There is, however, no universally accepted tool for such detection. In 2001, the Council of Europe concluded that there was no standard nutritional assessment method allowing for total screening of the inpatient population.8 The Committee of Ministers of the Council, in its Resolution ResAP(2003)3 on food and nutritional care in hospitals,9 stated that nutritional assessment is an indispensable tool in the evaluation of hospitalized patients. Assessment should be early, simple, based on the best scientific evidence, and adaptable to clinical circumstances such as age, sex, and disease severity. Different screening methods are currently used, including subjective global assessment (SGA),10 the screening method recommended by the American Society of Parenteral and Enteral Nutrition (ASPEN).11
On the other hand, the European Society of Parenteral and Enteral Nutrition (ESPEN) recommends the use of valid, simple, and rapid screening methods such as Nutritional Risk Screening (NRS 2002) for hospitalized patients.12,13 NRS has high sensitivity, specificity, and a concordance coefficient between expert observers. It consists of two parts, the first of which, pre-screening, requires the collection of four simple data: the body mass index (BMI), dietary intake, weight loss, and disease severity, which may easily be recorded by non-specialized staff. The second part includes a score depending on the disease, nutritional status (weight loss, calculation of energy requirements and dietary intake), and patient age. Depending on the result of pre-screening, the second part, requiring some nutritional training, may have to be performed. Computer tools for hospital malnutrition screening have also been designed, including the CONUT® (from the Spanish Control Nutricional) project, which uses test parameters related to malnutrition (albumin, total cholesterol, and total lymphocyte count) together with general and diagnostic databases of hospitalized patients.14 The recent multidisciplinary consensus on the approach to hospital malnutrition states that the screening method used is not relevant,15 but it is recommended that it include weight, height, BMI, weight changes, and intake changes as basic tools.
After screening, anthropometric data (BMI, percent weight loss, tricipital fold, etc.) and biochemical parameters (albumin, prelbumin, transferrin, cholesterol, etc.), which cannot be considered diagnostic by themselves but represent complementary data in complete assessment, are used for the complete assessment of nutritional status. Given our experience at our center in the use of SGA as a screening method, we decided to conduct a study to ascertain its validity and to examine the prevalence of malnutrition at our hospital with the following objectives: to ascertain the validity of SGA as a hospital malnutrition screening method through its correlation to anthropometric data and biochemical parameters of malnutrition, to examine the prevalence of malnutrition at a third-level hospital using SGA, to identify malnourished patients given nutritional support, and to assess the relationship of malnutrition with mean hospital stay.
Patients and methodsStudy designThis was an observational, cross-sectional study conducted on 197 patients, selected by simple randomization using computer software, who were subjected to SGA and a nutritional assessment protocol measuring specific anthropometric data (weight, height, BMI, percent weight loss, and tricipital fold and arm circumference) and biochemical parameters (albumin, transferrin, cholesterol, and total lymphocyte count).
The patient recruitment period lasted three months and included both medical departments (internal medicine, infectious diseases, gastroenterology, hepatology, endocrinology and nutrition, cardiology, oncology–hematology, pneumonology, neurology, and nephropathy) and surgical departments (general, gastrointestinal, thoracic, cardiovascular, plastic, neurosurgery, otolaryngological, orthopedic, urological, and ophthalmological surgery). The following departments were excluded: intensive care and recovery unit (the study did not include critically ill patients), psychiatry (because of frequent cognitive impairment in such patients), pediatrics (the study only included adult patients), gynecology and obstetrics (pregnancy is a period where many parameters are altered, including albumin and transferrin). The sample size was estimated for an error β 90%, an error α<7% and an estimated prevalence of approximately 40% obtained from the hospital census. The estimated calculation was 197 subjects. A total of 197 patients over 18 years old were enrolled. All the patients gave their consent for the study. The proportion of patients enrolled in each department was proportional to the percent admissions to the department in the previous year as compared to all hospital admissions. None of the patients studied had attended a nutritional clinic.
Collection of variables and methodsThe same investigator collected epidemiological data (age, sex, department, diagnosis, history of interest, and length of stay), anthropometric data (usual weight, current weight, height, percent weight loss, BMI, and tricipital fold and arm circumference), and biochemical parameters (albumin, transferrin, cholesterol, and lymphocyte count). Laboratory tests were performed on hospitalized patients who had fasted for eight hours during their first week of stay. The same conditions applied to surgical patients. In addition, data regarding weight measurement were obtained from the clinical records. The number of patients in whom nutritional treatment (oral supplements, enteral nutrition. or parenteral nutrition) had been started was also recorded.
Weight and height were measured using the same electronic clinical scale with the estadiometer anchored to the scale. Tricipital fold was measured with a caliper (Holtain®). Albumin was measured by visible photometry using bromocresol green, transferrin by immunoturbidimetry, cholesterol by enzymatic colorimetry, and lymphocyte count by flow cytometry.
SGA was performed in accordance with the method recommended by Detsky,10 which assesses weight loss, changes in oral intake, gastrointestinal symptoms, and functional capacity. It also includes a physical examination where loss of muscle and fat mass, ankle and sacral edema, and ascites are explored. The patients were finally classified into three categories based on their symptoms: well nourished (A), suspected or moderate malnutrition (B) (5%–10% weight loss, intake reduction in the previous weeks, and subcutaneous tissue loss), and severe malnutrition (C) (>10% weight loss, severe loss of muscle mass and subcutaneous tissue, or the presence of edema).
Statistical analysis was performed using SPSS version 16 software (SPSS, Chicago, USA) and the results were given as mean±standard deviation or total number (n) and percentage. Qualitative variables were compared using a Chi-square test. Spearman's correlation coefficient was determined to assess the correlation between SGA and biochemical and anthropometric parameters of malnutrition. Quantitative variables were compared using an analysis of variance (ANOVA). A value of p<0.05 was considered statistically significant.
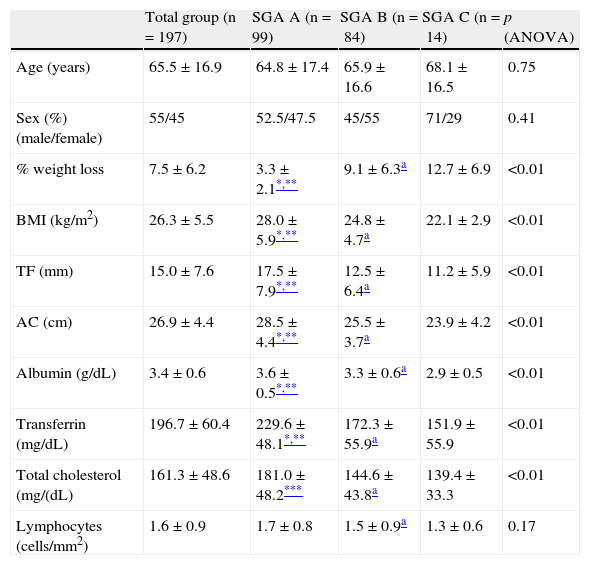
ResultsTable 1 shows the clinical, anthropometric, and biochemical characteristics of the study patients. Statistically significant differences were found when groups categorized according to SGA were compared with anthropometric parameters (percent weight loss, BMI, arm circumference, and tricipital fold) and biochemical parameters (albumin, transferrin, and cholesterol); no significant differences were found, however, between groups categorized according to SGA B and SGA C, as is shown in Table 1.
Clinical, anthropometric, and biochemical characteristics of study patients.
| Total group (n =197) | SGA A (n=99) | SGA B (n=84) | SGA C (n=14) | p (ANOVA) | |
| Age (years) | 65.5±16.9 | 64.8±17.4 | 65.9±16.6 | 68.1±16.5 | 0.75 |
| Sex (%) (male/female) | 55/45 | 52.5/47.5 | 45/55 | 71/29 | 0.41 |
| % weight loss | 7.5±6.2 | 3.3±2.1*,** | 9.1±6.3a | 12.7±6.9 | <0.01 |
| BMI (kg/m2) | 26.3±5.5 | 28.0±5.9*,** | 24.8±4.7a | 22.1±2.9 | <0.01 |
| TF (mm) | 15.0±7.6 | 17.5±7.9*,** | 12.5±6.4a | 11.2±5.9 | <0.01 |
| AC (cm) | 26.9±4.4 | 28.5±4.4*,** | 25.5±3.7a | 23.9±4.2 | <0.01 |
| Albumin (g/dL) | 3.4±0.6 | 3.6±0.5*,** | 3.3±0.6a | 2.9±0.5 | <0.01 |
| Transferrin (mg/dL) | 196.7±60.4 | 229.6±48.1*,** | 172.3±55.9a | 151.9±55.9 | <0.01 |
| Total cholesterol (mg/(dL) | 161.3±48.6 | 181.0±48.2*** | 144.6±43.8a | 139.4±33.3 | <0.01 |
| Lymphocytes (cells/mm2) | 1.6±0.9 | 1.7±0.8 | 1.5±0.9a | 1.3±0.6 | 0.17 |
AC: arm circumference; BMI: body mass index; TF: tricipital fold; SGA: subjective global assessment; SGA A: well nourished: VSG B: risk of malnutrition or moderate malnutrition; SGA C: severe malnutrition.
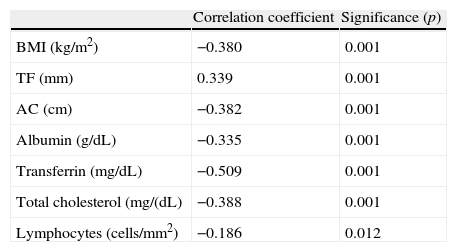
As regards the relationship between SGA and the biochemical (albumin, transferrin, cholesterol, and lymphocyte count) and anthropometric parameters (percent weight loss, BMI, arm circumference, and tricipital fold) used for nutritional assessment, a high correlation was found between both methods, as is shown in Table 2.
Nonparametric correlations between SGA and anthropometric and biochemical parameters.
| Correlation coefficient | Significance (p) | |
| BMI (kg/m2) | −0.380 | 0.001 |
| TF (mm) | 0.339 | 0.001 |
| AC (cm) | −0.382 | 0.001 |
| Albumin (g/dL) | −0.335 | 0.001 |
| Transferrin (mg/dL) | −0.509 | 0.001 |
| Total cholesterol (mg/(dL) | −0.388 | 0.001 |
| Lymphocytes (cells/mm2) | −0.186 | 0.012 |
AC: arm circumference; BMI: body mass index; TF: tricipital fold; VSG: valoración subjetiva global.
The prevalence rate of malnutrition was 50%. Of the 197 study patients, 99 (50.2%) were categorized as A (well nourished), 84 (42.6%) as B (risk of malnutrition or moderate malnutrition), and 14 (7.1%) as C (severe malnutrition).
On the other hand, a comparison of the prevalence of malnutrition evaluated by SGA between the different departments showed a higher prevalence of malnutrition in medical departments (53%) as compared to surgical departments (46%) (p<0.05).
No significant differences were found between the two types of department in anthropometric and biochemical parameters, except for greater weight loss (>10% weight loss) in surgical departments (28.7% vs 26.4%; p<0.05). Among patients diagnosed with malnutrition based on SGA (B and C, n=98), 62.2% did not receive nutritional treatment, 22.4% received supplements, 11.2% enteral nutrition and 4.1% parenteral nutrition. No differences were found in the type of treatment when medical and surgical departments were compared (36% vs 37.8%; p>0.05). However, the type of nutritional support started was different, with a greater use of oral supplements at medical departments (20.9% vs 14.9%) and more frequent administration of total enteral nutrition at surgical departments (11.5% vs 4.5%).
Finally, it should be noted that longer mean hospital stays were found in patients with severe malnutrition (SGA C; 13.6±10.7 days) and in subjects at risk of or with moderate malnutrition (SGA B; 12.1±12.8 days) as compared to well-nourished patients (SGA A; 6.9±5.8 days; p<0.05).
As regards the recording of weight in the clinical history (medical or nursing), it should be noted that only 13% of study patients were weighed during their hospital stay.
DiscussionAs this study used SGA as the assessment method, a high prevalence of hospital malnutrition was found (50%, a rate similar to that reported in other studies conducted in Spanish hospitals).16–19 It is, however, higher than that detected in the Burgos et al. study in Catalan hospitals, which reported a 28.9% prevalence,20 and in the first national multicenter study conducted in 2010, called The Prevalence of Hospital Malnutrition and Associated Costs in Spain (Prevalencia de Desnutrición Hospitalaria y Costes asociados en España) (PREDyCES®),21 which found a 23% prevalence. Both studies used NRS as the screening method.12,13 In our view, this difference may be attributed to the fact that these studies only considered patients with a NRS score≥3, rejecting lower scores suggesting a risk of malnutrition which are, however, taken into account in SGA, such as weight loss >5% in the previous three months or intake lower than 50%–75% in the previous week in critically ill patients, cancer patients, acute complications of cirrhosis, hemodialysis or diabetes in patients under 70 years of age (score=2). If they had used SGA, any such patients would have been assigned to SGA category B (risk of malnutrition or moderate malnutrition). A comparison of these results to those found in the Vidal et al. study, conducted in a tertiary hospital16 using the same procedure and in similar departments, shows a greater proportion of patients at risk of malnutrition or with moderate malnutrition (SGA B: 42.64% vs 24.9%) and a lower rate of severe malnutrition (SGA C: 7.11% vs 15.3%).
As regards prevalence by type of department, higher values were expected in surgical departments, but the prevalence was actually higher in medical departments. This agrees with other reports.14,19 We think that older age and the longer mean stay of patients admitted to medical departments may account for these results.
An essential objective of this study was to verify the validity of SGA as a screening method. For this, the correlation of SGA with anthropometric data (percent weight loss, BMI, tricipital fold, and arm circumference) and biochemical parameters (albumin, transferrin, and total cholesterol) related to nutritional status was analyzed. A close agreement of SGA with both types of parameters was found. Such agreement had not previously been reported for anthropometric parameters22 or biochemical data.23 These results, as well as its economy and simplicity, support the validity of SGA, whose main disadvantage is that experience is required to apply it. Other methods, such as the abovementioned NRS 2002, highly sensitive and specific, take a longer time, because their second part requires calculations of dietary intake and energy requirements which, in our opinion, require greater training and experience from the staff who administer them. In other cases, computer tools such as the CONUT project, based on the assessment of more costly biochemical parameters without taking into consideration patient clinical status, are needed.14
We also consider the absence of significant differences in anthropometric and biochemical parameters between the groups assigned to the SGA B and SGA C categories to be significant. It shows the importance of regarding group B as a high risk group which should, therefore, be treated early. A longer hospital stay was also found in relation to the severity of malnutrition assessed by SGA (p<0.05). This finding indirectly supports the ability of SGA to predict the development of complications and agrees with data reported by other authors relating it to hospital morbidity and mortality.19 It should be emphasized that little attention is paid to malnutrition diagnosis and treatment at our hospital, as is shown by the low proportion of patients (13%) weighed during their hospital stay. Unfortunately, this percentage is similar to those reported by other studies.24 The lack of nutritional treatment in patients diagnosed with malnutrition in our study (only 37.8% of them received treatment) is also striking.
Hospital malnutrition is a highly prevalent problem which is often underdiagnosed and underestimated. This study shows the validity of SGA as a nutritional screening method with a good correlation with anthropometric and biochemical parameters which suggest malnutrition, but have a greater complexity and cost or less availability. In conclusion, we believe that the introduction of tools for screening hospital malnutrition will contribute to the amelioration of this condition.
Conflicts of interestThe authors state that they have no conflicts of interest.
Please cite this article as: Moriana M, Civera M, Artero A, Real JT, Caro J, Ascaso JF, et al. Validez de la valoración subjetiva global como método de despistaje de desnutrición hospitalaria. Prevalencia de desnutrición en un hospital terciario. Endocrinol Nutr. 2014;61:184–189.
