


Prevalence of diabetes in Mexico has constantly increased since 1993. Since type 2 diabetes may remain undiagnosed for many years, identification of subjects at high risk of diabetes is very important to reduce its impact and to prevent its associated complications.
ObjectiveTo develop easily implementable screening models to identify subjects with undiagnosed diabetes based on the characteristics of Mexican adults.
Subjects and methodsScreening models were developed using datasets from the 2006 and 2012 National Health and Nutrition Surveys (NHNS). Variables used to develop the multivariate logistic regression models were selected using a backward stepwise procedure. Final models were validated using data from the 2000 National Health Survey (NHS).
ResultsThe model based on the 2006 NHNS included age, waist circumference, and systolic blood pressure as explanatory variables, while the model based on the 2012 NHNS included age, waist circumference, height, and family history of diabetes. The sensitivity and specificity values obtained from the external validation procedure were 0.74 and 0.62 (2006 NHNS model) and 0.76 and 0.55 (2012 NHNS model) respectively.
ConclusionsBoth models were equally capable of identifying subjects with undiagnosed diabetes (∼75%), and performed satisfactorily when compared to other models developed for other regions or countries.
En México, la prevalencia de diabetes se ha incrementado consistentemente desde 1993. Dado que la diabetes tipo 2 puede mantenerse sin diagnóstico por muchos años, es de suma importancia la identificación temprana de los sujetos con alto riesgo de tener la enfermedad con la finalidad de reducir su impacto y prevenir así las complicaciones asociadas.
ObjetivoDesarrollar mecanismos de fácil implementación para la detección de sujetos con diabetes no diagnosticada con base en las características de la población adulta mexicana.
Sujetos y métodosLos modelos fueron desarrollados usando datos de las Encuestas Nacionales de Salud y Nutrición (NHNS) 2006 y 2012. Las variables utilizadas para desarrollar los modelos de regresión logística multivariada fueron seleccionadas mediante un procedimiento de pasos hacia atrás. Los modelos finales se validaron usando datos de la Encuesta Nacional de Salud (NHS) 2000.
ResultadosEl modelo obtenido de la NHNS 2006 incluyó edad, circunferencia de cintura y presión arterial sistólica como variables explicativas, mientras que el modelo NHNS 2012 incluyó edad, circunferencia de cintura, estatura e historia familiar de diabetes. La sensibilidad y la especificidad obtenidas del proceso de validación externo fueron 0,74, 0,62 (modelo NHNS 2006) y 0,76, 0,55 (modelo NHNS 2012), respectivamente.
ConclusionesAmbos modelos desarrollados fueron igualmente capaces de identificar sujetos con diabetes no diagnosticada (∼75%), y mostraron un desempeño satisfactorio en comparación con otros modelos desarrollados para otras regiones y países.
Type 2 diabetes (T2D) is considered one of the most serious public health problems worldwide. Currently, according to the International Diabetes Federation (IDF), more than 415 million people have been diagnosed with T2D and it is estimated that this number could exceed 640 millions by 2040.1,2 In Mexico, the prevalence of diabetes has increased consistently since at least 1993 when 4.0% of the Mexican adult population had been diagnosed with the disease, to 5.8% in 2000, 7% in 2006 and 9.2% in 2012.3 In 2015, the number of people with diabetes was estimated at 11.5 million.4 Furthermore, it has been projected that, by 2040, more than 20 million people will have the disease nationwide.2
Diabetes is associated with long term complications including diabetic retinopathy and nephropathy, micro and macro vascular complications, cardiovascular disease, etc.5 Along with the disease itself, diabetes-related complications represent a serious financial burden at different levels: from the individuals with the condition and their families, to national health systems and societies as a whole. In fact, it has been estimated that the average health expenditure on diabetes accounts for ∼12% of the total health spending worldwide,1,2,6
T2D may remain undiagnosed for several years,7 thus increasing the risk of developing costly diabetes-related complications. Since a large proportion of people with diabetes remains undiagnosed (1 in 2 adults according to the IDF2), it is critical to develop cost-effective screening programs to identify those unaware of their disease or at high risk of developing T2D. Due to their affordability and simplicity, risk scores or simple screening models based on non-invasive risk factors are commonly used as tools for detecting undiagnosed diabetes (reviewed recently in [2,8–11]). In addition, in contrast to other approaches that require biochemical measurements, risk scores and screening models are considered a cost-effective strategy to detect individuals with undiagnosed diabetes, making them a feasible approach when resources are limited.2
Geographic and/or ethnic differences in the prevalence of T2D have been previously documented.12 Such differences reflect either a greater susceptibility of certain groups of individuals to develop the disease, or the effect of environmental factors on the risk of T2D, or a combination of both. For this reason, several screening models have been developed to account for the ethnical and cultural differences between countries and/or regions. These include Kuwait,12 Oman,13 The Netherlands,14,15 USA,16,17 India,18–20 China,21–23 Brazil,24 Egypt,25 Thailand,38,42 the Middle East and North Africa.26 Additionally, Vistisen et al.27 developed a global screening model considering the differences between most geographical regions (i.e. Asia, Greenland, Europe, Australia, Middle East, Eastern Mediterranean, Africa and North America). Surprisingly, even though Mexico is among the top ten countries in terms of the number of adults with diabetes,28 a screening model for undiagnosed diabetes based on the characteristics of the Mexican population is still lacking. To our knowledge, only Rojas-Martínez et al.29 had proposed a screening approach for T2D in Mexican adults using waist circumference measurements, which showed to be effective at identifying ∼85% of subjects with diabetes, but with the drawback of yielding a high percentage of false positives (∼80%).
In this article, we aim to fill this gap by developing a non-invasive screening model for detecting undiagnosed diabetes based on the characteristics of the Mexican adult population. The main objective of this work is to provide a cost-effective tool that contributes to prevent or delay the onset of type 2 diabetes mellitus and the related complications in Mexican adults by identifying those adults at high risk of having undiagnosed diabetes and as a result, to be able to implement the appropriate strategies and interventions to reduce the impact of the disease.
Material and methodsDatasetsMultivariate logistic regression models were developed using data from the National Health and Nutrition Surveys (NHNS) conducted in 2006 and 2012. Derived models were validated externally using data from the National Health Survey (NHS) 2000. The NHNS and NHS studies are cross-sectional nationwide surveys designed to gather information about the health of the Mexican population, to determine the prevalence of some infectious and chronic diseases and the related risk factors, and to evaluate the perception of the population about the quality of the health services.30–32 In addition, anthropometric measurements such as height, weight and waist circumference were obtained from a subsample of adult participants. Blood glucose measurements in the NHS 2000, NHNS 2006 and NHNS 2012 surveys were obtained using home blood glucose meters and/or an automatized glucose oxidase method.32,41 All the information contained in the datasets used in this work was obtained following protocols and procedures approved by the Ethical Committee of the National Institute of Public Health (INSP, México), in accordance with the existing standards, norms and regulations. In particular, it is of great importance to mention that all the participants gave informed consent before participating in the surveys. Details about the ethical aspects, design, methodology and administration of the Mexican National Health Surveys can be found in the corresponding reports30–32 and in other publications on the subject.33,34,41
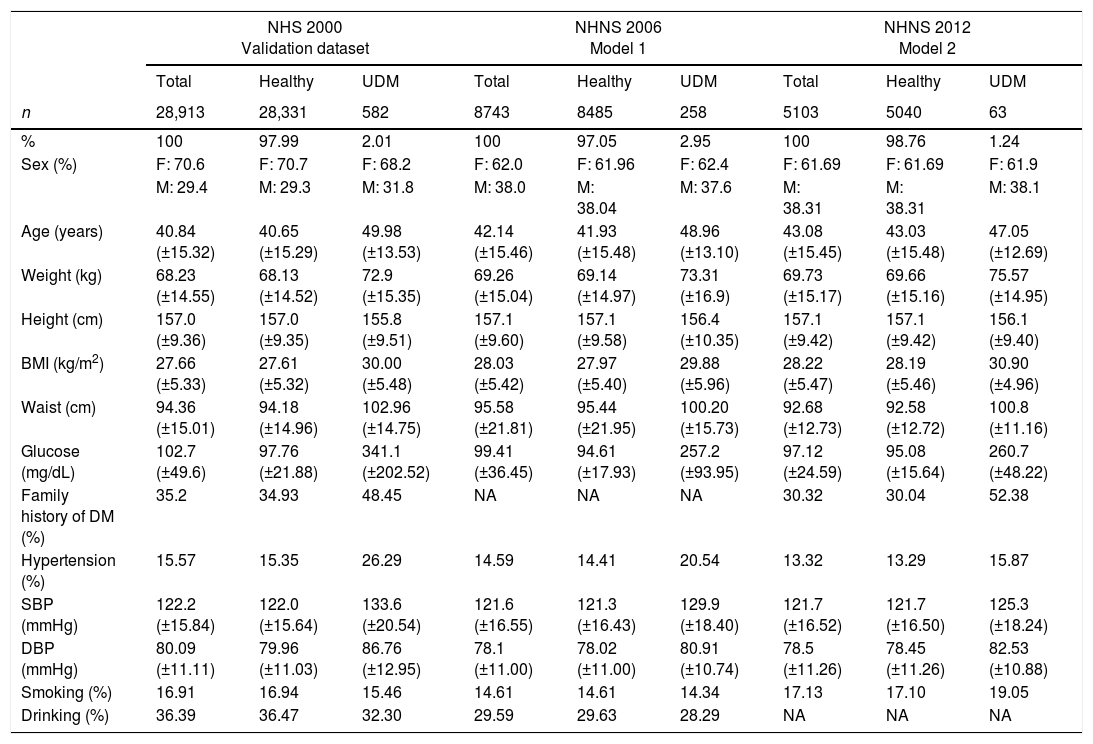
Only data from participants older than 20 years was selected. Variables commonly used as explanatory variables in screening models for undiagnosed diabetes (as reviewed in [8–11]) were initially included. The selected variables were sex, age, height, weight, waist circumference, body mass index (BMI), smoking status, drinking status, familiar history of diabetes (not available in the NHNS 2006), hypertension and diastolic and systolic blood pressure (DBP and SBP respectively). Subjects with a previous diagnosis of diabetes or those with missing information were not considered neither for the development, optimization nor the validation stages of the screening models. The characteristics of the NHS 2000, NHNS 2006 and NHNS 2012 populations are summarized in Table 1. Plasma glucose measurements taken during the surveys were used to classify the selected subjects as healthy or undiagnosed following the American Diabetes Association criteria; that is, subjects with a fasting plasma glucose greater than 126mg/dL or a random glucose level greater than 200mg/dL were classified as having undiagnosed diabetes, while those with a fasting plasma glucose lower than 126mg/dL or a random glucose level lower than 200mg/dL were classified as healthy individuals. As can be seen in Table 1, only a small percentage of the populations considered was identified as having undiagnosed diabetes (2.01% in the NHS 2000, 2.95% in the NHNS 2006 and 1.24% in the NHNS 2012).
Characteristics of the developing (NHNS 2006 and NHNS 2012) and validation datasets (NHS 2000). Continuous variables are presented as means±SD and categorical variables are presented as number of observations and percentages.
| NHS 2000 Validation dataset | NHNS 2006 Model 1 | NHNS 2012 Model 2 | |||||||
|---|---|---|---|---|---|---|---|---|---|
| Total | Healthy | UDM | Total | Healthy | UDM | Total | Healthy | UDM | |
| n | 28,913 | 28,331 | 582 | 8743 | 8485 | 258 | 5103 | 5040 | 63 |
| % | 100 | 97.99 | 2.01 | 100 | 97.05 | 2.95 | 100 | 98.76 | 1.24 |
| Sex (%) | F: 70.6 | F: 70.7 | F: 68.2 | F: 62.0 | F: 61.96 | F: 62.4 | F: 61.69 | F: 61.69 | F: 61.9 |
| M: 29.4 | M: 29.3 | M: 31.8 | M: 38.0 | M: 38.04 | M: 37.6 | M: 38.31 | M: 38.31 | M: 38.1 | |
| Age (years) | 40.84 (±15.32) | 40.65 (±15.29) | 49.98 (±13.53) | 42.14 (±15.46) | 41.93 (±15.48) | 48.96 (±13.10) | 43.08 (±15.45) | 43.03 (±15.48) | 47.05 (±12.69) |
| Weight (kg) | 68.23 (±14.55) | 68.13 (±14.52) | 72.9 (±15.35) | 69.26 (±15.04) | 69.14 (±14.97) | 73.31 (±16.9) | 69.73 (±15.17) | 69.66 (±15.16) | 75.57 (±14.95) |
| Height (cm) | 157.0 (±9.36) | 157.0 (±9.35) | 155.8 (±9.51) | 157.1 (±9.60) | 157.1 (±9.58) | 156.4 (±10.35) | 157.1 (±9.42) | 157.1 (±9.42) | 156.1 (±9.40) |
| BMI (kg/m2) | 27.66 (±5.33) | 27.61 (±5.32) | 30.00 (±5.48) | 28.03 (±5.42) | 27.97 (±5.40) | 29.88 (±5.96) | 28.22 (±5.47) | 28.19 (±5.46) | 30.90 (±4.96) |
| Waist (cm) | 94.36 (±15.01) | 94.18 (±14.96) | 102.96 (±14.75) | 95.58 (±21.81) | 95.44 (±21.95) | 100.20 (±15.73) | 92.68 (±12.73) | 92.58 (±12.72) | 100.8 (±11.16) |
| Glucose (mg/dL) | 102.7 (±49.6) | 97.76 (±21.88) | 341.1 (±202.52) | 99.41 (±36.45) | 94.61 (±17.93) | 257.2 (±93.95) | 97.12 (±24.59) | 95.08 (±15.64) | 260.7 (±48.22) |
| Family history of DM (%) | 35.2 | 34.93 | 48.45 | NA | NA | NA | 30.32 | 30.04 | 52.38 |
| Hypertension (%) | 15.57 | 15.35 | 26.29 | 14.59 | 14.41 | 20.54 | 13.32 | 13.29 | 15.87 |
| SBP (mmHg) | 122.2 (±15.84) | 122.0 (±15.64) | 133.6 (±20.54) | 121.6 (±16.55) | 121.3 (±16.43) | 129.9 (±18.40) | 121.7 (±16.52) | 121.7 (±16.50) | 125.3 (±18.24) |
| DBP (mmHg) | 80.09 (±11.11) | 79.96 (±11.03) | 86.76 (±12.95) | 78.1 (±11.00) | 78.02 (±11.00) | 80.91 (±10.74) | 78.5 (±11.26) | 78.45 (±11.26) | 82.53 (±10.88) |
| Smoking (%) | 16.91 | 16.94 | 15.46 | 14.61 | 14.61 | 14.34 | 17.13 | 17.10 | 19.05 |
| Drinking (%) | 36.39 | 36.47 | 32.30 | 29.59 | 29.63 | 28.29 | NA | NA | NA |
NA: non available.
Multivariate logistic regression models were derived separately for each development population considered (NHNS 2006 and NHNS 2012). As it is widely known, logistic regression models allow us to determine the probability P of an event based on a set of selected explanatory variables Xi. In this particular case, the probability of having undiagnosed diabetes (UDM) based on the available clinical information such as height, weight, etc. (i.e. the explanatory variables Xi) was calculated as:
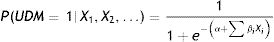
Then, each observation is classified as either healthy or as having undiagnosed diabetes based on a selected probability cutoff value. That is, if the calculated probability for a given observation (i.e. subject) is greater than the probability cutoff value, it is then classified in the undiagnosed diabetes class; otherwise, it is classified in the healthy class.
As described schematically in Fig. 1, models were derived using 80% of the observations of the development datasets (see also Table 2). Included explanatory variables in the final logistic regression models were selected from the development dataset by a stepwise backward procedure based on the Akaike Information Criterion (AIC) using 10-fold cross-validation repeated 5 times. In short, this procedure consists in fitting an initial model containing all the explanatory variables which are iteratively removed in further steps in order to determine which of them contribute significantly to the model based on the computed AIC at each step. Once the final explanatory variables were found, the optimal probability cutoff value was determined using the remaining 20% of the observations of each dataset (NHNS 2006 and 2012). Models performance was finally evaluated using the NHS 2000 dataset (i.e. the validation dataset) in terms of their capability to correctly identify those subjects with and without undiagnosed diabetes (sensitivity and specificity, respectively). In addition, the area under the receiver operation characteristic (ROC) curve (AUC) was afterwards calculated.

Diagram of the development and validation procedures. Models were developed using 80% of the NHNS 2006 and 2012 datasets and the remaining 20% was used as optimization datasets. Explanatory variables were determined using a stepwise backward procedure using 10-fold cross validation repeated 5 times. The final models were validated externally using data from the NHS 2000.
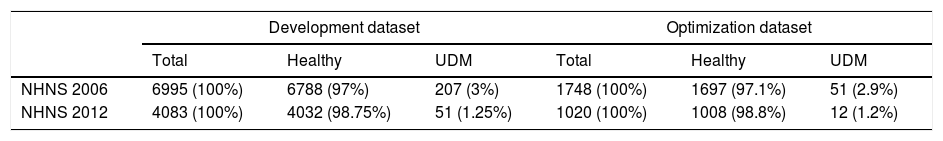
Number and percentage of observations included in the development and optimization datasets. UDM: undiagnosed diabetes mellitus.
| Development dataset | Optimization dataset | |||||
|---|---|---|---|---|---|---|
| Total | Healthy | UDM | Total | Healthy | UDM | |
| NHNS 2006 | 6995 (100%) | 6788 (97%) | 207 (3%) | 1748 (100%) | 1697 (97.1%) | 51 (2.9%) |
| NHNS 2012 | 4083 (100%) | 4032 (98.75%) | 51 (1.25%) | 1020 (100%) | 1008 (98.8%) | 12 (1.2%) |
Data cleaning, exploratory analyses, model fitting and validation were performed in R 3.2.4.35 Models were fit and validated using the Caret package.36 Area under the ROC curves and optimal probability cutoff values were obtained with the ROCR package.37 The final models have been implemented in form of interactive web applications and are available in http://gjfelix.shinyapps.io/UDMScreeningMexico2006 and http://gjfelix.shinyapps.io/UDMScreeningMexico2012.
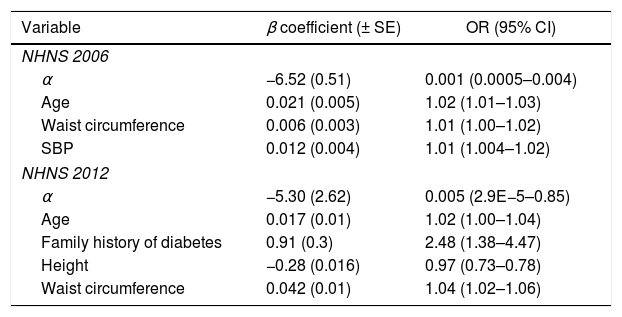
ResultsAs a result of the backward stepwise procedure, the explanatory variables considered in the final NHNS 2006 model were waist circumference, systolic blood pressure and age. On the other hand, the variables associated with undiagnosed diabetes in the final NHNS 2012 model were waist circumference, age, height and familiar history of diabetes. Model parameters (α and β in Eq. (1)), as well as the odds ratios obtained for the two models derived are shown in Table 3.
Explanatory variables included in the final NHNS 2006 and 2012 models, odds ratios and model parameters α and β used in Eq. (1) to calculate the probability of having undiagnosed diabetes.
| Variable | β coefficient (± SE) | OR (95% CI) |
|---|---|---|
| NHNS 2006 | ||
| α | −6.52 (0.51) | 0.001 (0.0005–0.004) |
| Age | 0.021 (0.005) | 1.02 (1.01–1.03) |
| Waist circumference | 0.006 (0.003) | 1.01 (1.00–1.02) |
| SBP | 0.012 (0.004) | 1.01 (1.004–1.02) |
| NHNS 2012 | ||
| α | −5.30 (2.62) | 0.005 (2.9E−5–0.85) |
| Age | 0.017 (0.01) | 1.02 (1.00–1.04) |
| Family history of diabetes | 0.91 (0.3) | 2.48 (1.38–4.47) |
| Height | −0.28 (0.016) | 0.97 (0.73–0.78) |
| Waist circumference | 0.042 (0.01) | 1.04 (1.02–1.06) |
For the case of the NHNS 2006 model, the three variables associated with undiagnosed diabetes (i.e. age, waist circumference and systolic blood pressure) seem to contribute almost equally to the odds of having undiagnosed diabetes as indicated by the odds ratios (1.02, 1.01 and 1.01), which in practice mean that an increase of one unit in one of these variables (with the other two fixed) would increase the odds of having undiagnosed diabetes by 1% in the case of waist circumference and systolic blood pressure and 2% in the case of age. A similar analysis of the NHNS 2012 model tells us that while age and waist circumference increased the odds of having undiagnosed diabetes by 2% and 4% respectively, a positive family history of diabetes is a much more important factor to consider, since it would increase the odds of having undiagnosed diabetes by 148%. In contrast, according to the parameters of the NHNS 2012 model, an increase of one unit in height would decrease the odds of having undiagnosed diabetes by 3%.
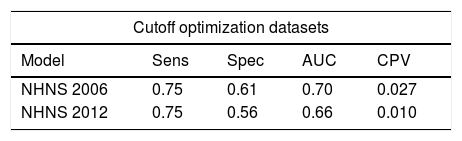
Performance parameters (sensitivity, specificity and AUC) of the final models obtained from the cutoff optimization procedure are shown in Table 4. Using the optimal cutoff probabilities values (0.027 and 0.010 for the NHNS 2006 and 2012, respectively) the models were similarly capable of identifying subjects with undiagnosed diabetes, as indicated by a sensitivity of 0.75 in both cases. However, the NHNS 2006 model was slightly better than the NHNS 2012 in correctly identifying those subjects that do not have the disease, as can be seen from the higher specificity (0.61 vs. 0.56 respectively). These results were also reflected in the AUC (NHNS 2006: 0.70, NHNS 2012: 0.66), as can be also seen in Table 4.
Performance of the NHNS 2006 and 2012 models in the optimization and external validation datasets.
| Cutoff optimization datasets | ||||
|---|---|---|---|---|
| Model | Sens | Spec | AUC | CPV |
| NHNS 2006 | 0.75 | 0.61 | 0.70 | 0.027 |
| NHNS 2012 | 0.75 | 0.56 | 0.66 | 0.010 |
| Validation dataset | |||
|---|---|---|---|
| Model | Sens | Spec | AUC |
| NHNS 2006 | 0.74 | 0.62 | 0.73 |
| NHNS 2012 | 0.76 | 0.55 | 0.71 |
AUC: area under the curve; Sens: sensitivity; Spec: specificity; NHS: National Health Survey; NHNS: National Health and Nutrition Survey; CPV: cutoff probability value.
The performance of the two models developed (NHNS 2006 and NHNS 2012) was externally validated using the NHS 2000 dataset. Both models exhibited similar results in terms of the sensitivity, specificity and AUC than those obtained from the optimization procedure, as shown in Table 4, where the results of the external validation procedure are also presented. The NHNS 2006 and NHNS 2012 models achieved a sensitivity of 0.74 and 0.76, and specificities of 0.62 and 0.55, respectively. The corresponding AUC values were slightly improved when compared to those obtained during the cutoff optimization process (0.73 vs. 0.70 for the NHNS 2006 model and 0.71 vs. 0.66 for the NHNS 2012 model). Interestingly, in spite of the different explanatory variables included, both models displayed a similar performance in terms of their capability of identifying subjects with undiagnosed diabetes in both the optimization and validation datasets.
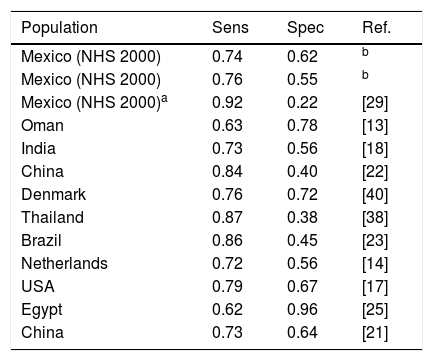
DiscussionIn this work we developed screening models for detecting undiagnosed diabetes based on the characteristic of the Mexican adult population. Models were developed using recent datasets obtained during the National Health and Nutrition Surveys 2006 and 2012, and were validated using data from the National Health Survey 2000. Both models developed were capable of identifying ∼75% of the subjects having undiagnosed diabetes. When compared to other similar models developed for other populations, we can say that our models yield similar or even better results than most of the other models. In fact, as can be seen in Table 5, a sensitivity greater than 0.8 has always been associated with a very low specificity. For instance, the models of Gao et al.,22 Keesukphan et al.38 and Pires de Souza et al.24 achieved a sensitivity of ∼0.85, but only a specificity of around 0.4.
Comparison between logistic regression models developed for other regions or countries.
| Population | Sens | Spec | Ref. |
|---|---|---|---|
| Mexico (NHS 2000) | 0.74 | 0.62 | b |
| Mexico (NHS 2000) | 0.76 | 0.55 | b |
| Mexico (NHS 2000)a | 0.92 | 0.22 | [29] |
| Oman | 0.63 | 0.78 | [13] |
| India | 0.73 | 0.56 | [18] |
| China | 0.84 | 0.40 | [22] |
| Denmark | 0.76 | 0.72 | [40] |
| Thailand | 0.87 | 0.38 | [38] |
| Brazil | 0.86 | 0.45 | [23] |
| Netherlands | 0.72 | 0.56 | [14] |
| USA | 0.79 | 0.67 | [17] |
| Egypt | 0.62 | 0.96 | [25] |
| China | 0.73 | 0.64 | [21] |
To our knowledge, only Rojas-Martínez et al.29 had proposed a screening approach for T2D in Mexican adults using only waist circumference measurements to predict the presence of the disease. In their study, they achieved a sensitivity of 0.85 by using the cutoff values of abdominal obesity established by the IDF, although it should be also mentioned that such high sensitivity was obtained at the expense of a very low specificity (0.20). In order to compare this approach to the models developed in this work, we used the criterion proposed by Rojas-Martínez et al.29 to identify subjects with diabetes in the NHS 2000 validation dataset. As expected, a high sensitivity was obtained (0.92), but also obtaining a very low specificity (0.22). In practical terms, this would mean that 92% of those having undiagnosed diabetes would be correctly identified, but also that 78% of healthy subjects would be classified as having the disease (false positives), which, in our opinion, would be extremely inefficient both in practical and economical terms. Our models, in contrast, displayed a more balanced performance, since they were capable of identifying a high proportion of subjects having undiagnosed diabetes (75%) without the drawback of yielding such a high proportion of false positives.
Based on the performance measures obtained with the models developed in this work, it might seem straightforward to select the NHNS 2006 model as the best of the two models. However, we believe that other factors must be considered when selecting a model or screening tool for a widespread screening program. In this particular case, although the NHNS 2006 model yielded slightly better performance measures as discussed above, it should also be considered that among the explanatory variables included in the NHNS 2006 model is the systolic blood pressure, whose obtainment may require the assistance of a trained interviewer or a health professional. Thus, considering the context of administration, it might be better to use the NHNS 2012 model since it only requires general information and easy obtainable anthropometric measurements.
One of the major strengths of the models developed in this work is the ease of interpretability of the models developed, since they directly allow us to estimate the probability of having undiagnosed diabetes. Similarly, it is also of great advantage that such probability is calculated only using easy obtainable non-invasive information (e.g. waist circumference, age, height, family history of diabetes and blood pressure). It must be mentioned that the models developed also have some limitations. Firstly, relevant explanatory variables that were not retrieved during the survey process might be missing from our models (e.g. physical activity and other lifestyle factors). Secondly, given the nature of the data used for the development and validation of the models (i.e. cross-sectional studies), it might not be adequate to use them as prospective tools. Finally, an accurate estimation of the probability of having undiagnosed diabetes can be affected by any type of measurement errors and/or self-reporting bias, which could limit the ability of the models to accurately identify subjects with undiagnosed diabetes.
In practice, non-invasive screening tools such as the models developed in this work could be implemented as a part of a widespread screening program whether as self-administered questionnaires or by trained interviewers, always followed by further biochemical or specialized tests such as fasting plasma glucose, glycosylated hemoglobin A1C or oral glucose tolerance tests for the subjects identified to be at high risk of having undiagnosed diabetes. As recently reviewed by Dhippayom et al.,39 obstacles for the implementation of risk scores and screening tools are still placed by both healthcare practitioners and patients, thus limiting the impact of screening models and tools. However, as concluded by the authors, ways to overcome the obstacles associated to the implementation of this kind of tools must be found in order to successfully design effective policies to reach the goal of identifying subjects with undiagnosed diabetes while still in an early stage, when preventive measures and interventions can still be put in place.
FundingDr. Gerardo J. Félix-Martínez was supported by a postdoctoral scholarship from the Mexican Science and Technology Council (CONACYT, CVU 302514). There has been no other financial support for this work that could have influenced its outcome.
Conflicts of InterestThe authors have no conflicts of interest to report, financial or otherwise.
G. J. Félix-Martínez was supported by a postdoctoral scholarship (CVU: 302514) from CONACYT (Mexican Council of Science and Technology).
