


To predict the length of hospital stay in hyperosmolar hyperglycemic crises (HHC) using variables available on admission.
MethodsWe conducted a retrospective cohort study with 132 patients (65 [49.2%] men; median age 72 years; range 19–98 years) hospitalized for HHC (including hyperosmolar hyperglycemic state and diabetic ketoacidosis with elevated osmolality) in a Spanish teaching hospital. Baseline variables and those upon arrival to the emergency department were collected (both variables related to physical examination and biochemical tests), as well as the in-hospital mortality rate and overall length of hospital stay in survivors.
ResultsPatients who died (n=13) had higher total serum osmolality and higher C-reactive protein concentrations on admission vs survivors. Among survivors, the length of stay correlated positively with total serum osmolality (Rho=0.398; p<0.001) and C-reactive protein (Rho=0.342; p<0.001) on admission. Older age, female sex, lack of pre-admission diagnosis of insulin-requiring diabetes, impaired mental status on arrival, non-ketotic metabolic acidosis, and low serum potassium concentrations were also associated with long lengths of stay. In multivariate analysis, only serum glucose (one of the three components of total osmolality) and C-reactive protein concentrations on admission kept a positive association with the length of stay.
ConclusionsHyperglycemia and elevated C-reactive protein on admission are independent predictors of long lengths of stay in survivors with HHC.
Predecir la duración de la estancia hospitalaria en las crisis hiperglucémicas hiperosmolares (CHH) mediante variables disponibles al ingreso.
MétodosEstudio de cohortes retrospectivo de 132 pacientes (65 [49,2%] hombres; edad mediana 72 años, rango 19-98 años) hospitalizados por CHH (incluyendo el estado hiperglucémico hiperosmolar y la cetoacidosis diabética con osmolalidad elevada) en un hospital universitario de España. Se recogieron variables basales y a la llegada a urgencias (tanto variables relacionadas con la exploración física como con las pruebas bioquímicas), así como la mortalidad intrahospitalaria y la duración de la estancia hospitalaria en los supervivientes.
ResultadosLos pacientes que fallecieron (n=13) presentaron al ingreso una osmolalidad sérica total y unos niveles de proteína C reactiva más elevados que los supervivientes. Entre los supervivientes, la duración de la estancia hospitalaria se correlacionó positivamente con la osmolalidad sérica total (Rho=0,398; p<0,001) y la proteína C reactiva (Rho=0,342; p<0,001) al ingreso. La edad avanzada, el sexo femenino, la ausencia de diagnóstico previo al ingreso de diabetes insulinodependiente, el estado mental alterado, la acidosis metabólica no cetósica y las concentraciones bajas de potasio sérico también se asociaron con una estancia hospitalaria prolongada. En un análisis multivariante, solamente la glucosa sérica (uno de los 3 componentes de la osmolalidad total) y los niveles de proteína C reactiva al ingreso mantuvieron una asociación positiva con la duración de la estancia hospitalaria.
ConclusionesLa hiperglucemia y la proteína C reactiva elevada al ingreso son predictores independientes de estancia hospitalaria prolongada en supervivientes de CHH.
Hyperglycemic crises are the most serious acute hyperglycemic complications for people with diabetes.1,2 Hyperglycemic crises include non-hyperosmolar hyperglycemic crises, such as diabetic ketoacidosis (DKA); and hyperosmolar hyperglycemic crises (HHC), such as hyperosmolar hyperglycemic state (HHS) and cases of combined DKA-HHS (DKA criteria plus elevated osmolality).1–3 Mortality in HHC can be as high as 20%,2 significantly higher compared with isolated DKA.1,3 The severity of HHC can result in long lengths of stay for survivors, with mean lengths of stay of up to 11–18 days in some series.4,5 Given the high cost of hospitalization due to hyperglycemic crises,6 predicting the length of stay at the time of admission would be of great interest. As far as we know, no study has ever aimed to predict the length of stay in HHC using variables available upon admission.
Several studies have explored the predictors of long lengths of stay in adults admitted for isolated DKA,7–9 a form of hyperglycemic crisis with distinct characteristics from HHC. Former studies have shown that length of stay and economic costs are greater for HHC vs isolated DKA.4 The few studies that have analyzed the determinants of length of stay in HHC have only examined specific variables such as the type of insulin therapy received during hospitalization,10 and the presence of hypertriglyceridemia during hospitalization11 or obesity.12 The only one of these variables10–12 that can always be known prior to admission is the presence of obesity, which was not associated with a longer length of stay.12
Length of stay is a major determinant of hospital occupancy and resource consumption. The aim of the present study is to investigate whether the baseline, clinical, and laboratory variables that can be measured in the emergency department (ED) can predict prolonged lengths of stay for HHC. As far as we know, this will be the first study ever conducted of this kind.
MethodsStudy design and settingWe conducted this retrospective cohort study on adult patients hospitalized for HHC at a Spanish teaching hospital from June 2014 through October 2023. All patients met strict HHC criteria on admission, according to the latest consensus report: blood glucose ≥600mg/dL, and total plasma osmolality >320mOsm/kg (if not determined, it was calculated as sodium [mmol/L]×2+glucose [mg/dL]/18+urea [mg/dL]/6) or calculated effective plasma osmolality >300mOsm/kg (sodium [mmol/L]×2+glucose [mg/dL]/18).1 Those with metabolic acidosis (pH <7.30 and/or bicarbonate <18mmol/L) and ketosis (point-of-care β-hydroxybutyrate concentration ≥3mmol/L or, failing that, urine ketone strip ≥2+) were considered to have DKA-HHS.1 The remaining patients were considered to have pure HHS.1 Patients with pure HHS were then categorized based on the presence of non-ketotic metabolic acidosis (pH <7.30 and/or bicarbonate <18mmol/L without ketosis; all patients with DKA-HHS had ketosis and therefore were considered free from non-ketotic metabolic acidosis). HHC was considered to be likely induced by glucocorticoids in patients on systemic glucocorticoid therapy in the week prior to admission, and/or likely induced by infection in patients on antibiotic treatment within 24h of arrival at the ED.
We reviewed hospital admissions from June 2014 through December 2015 (ICD-9 coding) coded as 249.1, 250.1, 249.2, and 250.2; admissions from January 2016 through October 2023 (ICD-10 coding) coded as E08.0, E08.1, E09.0, E09.1, E10.1, E11.0, E11.1, E13.0, and E13.1; and all Endocrinology admissions from June 2014 through October 2023. For patients admitted more than once for HHC, the index admission meeting HHC criteria was selected. The search identified a total of 132 adults (65 [49.2%] men; median age 72 years, range 19–98 years) who met the above-mentioned criteria for HHC and were included in the study. A total of 129 of these patients were part of a former study that explored the prognostic value of hypoglycemia during HHC,13 and 95 patients were part of a different study that evaluated recent consensus report recommendations1 for transition to subcutaneous insulin in hyperglycemic crisis.14
Main determinationsOutcomesIn-hospital mortalityThe in-hospital mortality rate was recorded.
Length of stayFor patients who did not die during hospitalization (i.e., survivors), length of stay was calculated as the number of days elapsed from the date of admission to the date of discharge. Based on the distribution of the length of stay of the study patients (Fig. 1), hospital admissions >8 days were considered as prolonged lengths of stay in some analyses.
CovariatesBaseline variables of the study patients.")
Age, sex, known diagnosis of diabetes prior to admission (according to the American Diabetes Association criteria),15 type of diabetes (type 1 vs type 2 diabetes mellitus vs diabetes due to pancreatic disease; only in those with known diagnosis of diabetes prior to admission),15 outpatient treatment with insulin prior to admission, systemic corticosteroid treatment in the week prior to admission, dependence performing activities of daily living (patients were considered dependent if they needed help or supervision for any activity of daily living), and the Charlson Comorbidity Index (an estimator that includes age, baseline glomerular filtration rate [which was estimated from the previous serum creatinine concentration closest to admission, using the CKD-EPI formula],16 previous history of diabetes, myocardial infarction, heart failure, peripheral vascular disease, stroke, hemiplegia, dementia, chronic obstructive pulmonary disease, connective tissue disease, acquired immunodeficiency syndrome, peptic ulcer disease, liver disease, solid tumor, leukemia, and lymphoma).17
Physical examination variablesBody mass index (calculated from admission weight and not from previous weight, as hyperglycemia in HHC can cause significant weight loss),1 impaired mental status at the ED (defined by Glasgow Coma Scale <15),18 body temperature upon arrival at the ED, systolic and diastolic blood pressure upon arrival at the ED (from which the mean arterial pressure was calculated: [systolic blood pressure+diastolic blood pressure×2]/3),19 and heart rate upon arrival at the ED.
Biochemical variablesThe following parameters were collected from the first serum sample drawn in the ED: glucose, osmolality (for diagnostic purposes only [see above], as calculated total osmolality and calculated effective osmolality were those used for statistical analyses [since non-calculated plasma osmolality was not available in all patients]), creatinine (from which the glomerular filtration rate was estimated, using the CKD-EPI formula),16 urea, sodium (in addition, corrected sodium for hyperglycemia was calculated as: sodium+[[glucose−100]/100]×1.6), potassium (repeated hemolysis invalidated potassium determinations in 8 patients), C-reactive protein, procalcitonin, and neutrophil count. pH and bicarbonate were obtained from the first venous blood gas analysis drawn in the ED. The first point-of-care β-hydroxybutyrate value in the ED was also collected (if unavailable, the urine ketone strip was considered for differential diagnosis between HHS and combined DKA-HHS [see above]).1
Additional covariates during hospitalizationWe recorded whether patients were on antibiotic treatment within 24h prior to arrival at the ED and whether they were admitted to the intensive care unit (ICU) during their hospital admission.
Statistical analysesAll analyses associated with the length of stay were performed exclusively on survivors. We employed the chi-squared test to compare proportions, the Mann–Whitney test to compare numerical data between independent groups, and Spearman's rank test to evaluate correlation. We used the Kruskal–Wallis test to compare numerical data between >2 independent groups. We used the Jonckheere–Terpstra test to assess the trend in numerical variables between >2 independent groups. Linear and logistic regressions were used for multivariate analyses after verifying that all regression assumptions were met.20,21 All tests were 2-tailed. p-Values <0.05 were considered statistically significant.
Ethical considerationsThe study was conducted in full compliance with the principles of the Declaration of Helsinki. Furthermore, the study was reviewed and approved by the Research Ethics Committee of the Principality of Asturias (Spain) (code 2023.488). Obtaining informed consent from the study participants was deemed unnecessary in full compliance with the Spanish legislation on retrospective studies of medical records.
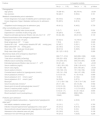
ResultsIn-hospital mortalityA total of 13 patients (9.8%) died during hospital admission. Table 1 illustrates the factors associated with in-hospital mortality, which was limited to patients with an impaired mental status, as no patients with Glasgow Coma Scale scores=15 died. In addition, compared with survivors, patients who died during admission were older, had a higher Charlson Comorbidity Index, were more likely to be dependent performing activities of daily living, had a higher rate of body temperature ≥37°C upon arrival at the ED, had higher serum osmolality concentrations (both total and effective), lower estimated glomerular filtration rates (and higher serum creatinine and urea levels), higher serum sodium concentrations (both corrected and uncorrected for hyperglycemia), and higher C-reactive protein concentrations (Table 1).
Factors associated with in-hospital mortality in hyperosmolar hyperglycemic crises.
| Feature | In-hospital mortality | ||
|---|---|---|---|
| No (n=119) | Yes (n=13) | p-Value | |
| Demographics | |||
| Age (years) | 70 (58–81) | 85 (78–91) | <0.001 |
| Sex (woman) | 58 (48.7) | 9 (69.2) | 0.161 |
| Metabolic characteristics prior to admission | |||
| Known diagnosis of any type of diabetes prior to admission (yes) | 84 (70.6) | 11 (84.6) | 0.285 |
| Known diagnosis of type 2 diabetes mellitus prior to admission (yes)a | 55 (65.5) | 9 (81.8) | 0.277 |
| Outpatient insulin therapy prior to admission (yes) | 49 (41.2) | 6 (46.2) | 0.730 |
| Other comorbidities prior to admission | |||
| Charlson Comorbidity Index (score points) | 5 (3–7) | 6 (6–7) | 0.024 |
| Dependence in activities of daily living (yes) | 35 (29.4) | 11 (84.6) | <0.001 |
| Baseline estimated glomerular filtration rate (mL/min/1.72m2)b | 63 (44–83) | 49 (21–81) | 0.130 |
| Physical examination at the emergency department | |||
| Glasgow Coma Scale <15 (yes) | 50 (42.0) | 13 (100.0) | <0.001 |
| Body temperature ≥37°C (yes) | 7 (5.9) | 3 (23.1) | 0.026 |
| Systolic BP ≥140mmHg and/or diastolic BP ≥90mmHg (yes) | 52 (43.7) | 3 (23.1) | 0.152 |
| Mean arterial BP <70mmHg (yes) | 22 (18.5) | 2 (15.4) | 0.783 |
| Heart rate >100beats per minute (yes) | 38 (31.9) | 5 (38.5) | 0.633 |
| Body mass index (kg/m2)c | 26.1 (23.1–30.2) | ID | 0.266 |
| Biochemical tests at the emergency department | |||
| Serum glucose (mg/dL) | 862 (717–1012) | 949 (699–1068) | 0.683 |
| Total serum osmolality (mOsm/kg) | 330 (321–353) | 395 (354–407) | <0.001 |
| Effective serum osmolality (mOsm/kg) | 314 (304–331) | 348 (318–365) | 0.006 |
| Estimated glomerular filtration rate (mL/min/1.7m2)d | 30 (21–43) | 14 (11–25) | <0.001 |
| Serum creatinine (mg/dL) | 1.89 (1.50–2.50) | 2.88 (1.93–4.01) | 0.010 |
| Serum urea (mg/dL) | 114 (86–148) | 234 (190–261) | <0.001 |
| Serum sodium (mmol/L) | 133 (129–141) | 151 (134–156) | 0.002 |
| Corrected serum sodium for hyperglycemia (mmol/L) | 145 (141–154) | 164 (147–168) | 0.003 |
| Serum potassium (mmol/L)e | 5.0 (4.3–5.6) | 4.7 (4.4–5.9) | 0.668 |
| Serum potassium ≤3.5mmol/L (yes)e | 10 (9.0) | 2 (18.2) | 0.330 |
| Serum potassium ≥5.5mmol/L (yes)e | 34 (30.6) | 3 (27.3) | 0.817 |
| Blood pHf | 7.31 (7.06–7.39) | 7.34 (7.19–7.39) | 0.407 |
| Serum bicarbonate (mmol/L)g | 20 (11–24) | 20 (14–26) | 0.592 |
| Serum point-of-care β-hydroxybutyrate (mmol/L)h | 2.2 (0.3–5.9) | 0.6 (0.2–5.6) | 0.440 |
| Serum C-reactive protein (mg/dL)i | 2.4 (0.6–5.5) | 11.3 (7.6–20.5) | <0.001 |
| Serum procalcitonin (ng/mL)j | 0.5 (0.2–1.7) | 0.4 (0.1–62.2) | 0.804 |
| Blood neutrophil count (neutrophils/μL) | 11310 (6800–15040) | 9390 (7285–12305) | 0.310 |
| Features upon admission | |||
| Combined diabetic ketoacidosis – hyperosmolar hyperglycemic state (yes)k | 43 (36.1) | 4 (30.8) | 0.701 |
| Non-ketotic metabolic acidosis (yes)l | 12 (10.1) | 1 (7.7) | 0.783 |
| Infection-induced hyperosmolar hyperglycemic crisis (yes)m | 44 (37.0) | 8 (61.5) | 0.085 |
| Glucocorticoid-induced hyperosmolar hyperglycemic crisis (yes)n | 21 (17.6) | 0 (0.0) | 0.099 |
| Admission to the intensive care unit (yes) | 20 (16.8) | 0 (0.0) | 0.109 |
| Admission from 2019 through 2023 (yes) | 44 (37.0) | 7 (53.8) | 0.236 |
Data expressed absolute numbers and percentages (within parentheses) or medians and interquartile ranges (within parentheses). BP, blood pressure; ID, insufficient data (data were available for 3 patients only).
Data available for 95 patients, as only patients with known diagnosis of diabetes prior to admission were included in this analysis.
Baseline glomerular filtration rate was estimated by the CKD-EPI equation, using the most recent creatinine value prior to admission. Data available for 122 patients.
Glomerular filtration rate upon admission was estimated by the CKD-EPI equation, using admission serum creatinine.
Combined diabetic ketoacidosis – hyperosmolar hyperglycemic state was defined by hyperosmolar hyperglycemic state features combined with metabolic acidosis (pH <7.30 and/or bicarbonate <18mmol/L) and ketosis (point-of-care β-hydroxybutyrate ≥3mmol/L or, if unavailable, urine ketone strip ≥2+).
The median length of stay for the 119 survivors (90.2%) was 8 days (IQR, 6–13 days; range, 2–42 days) (Fig. 1). There were no significant differences in the length of stay according to the day of the week (p=0.885) or the month of admission (p=0.369). As shown in Supplementary Fig. 1, the length of stay in HHC decreased over the years (p=0.039). The median length of stay for survivors admitted between 2014 and 2018 (n=75) was longer vs those admitted between 2019 and 2023: 9 days vs 6 days, respectively (p=0.010).
Among survivors, a positive correlation was reported between the length of stay and age (Rho=0.218; p=0.017). Additionally, a positive correlation was reported between the length of stay and the following serum biochemical parameters upon admission: glucose (Rho=0.320; p<0.001), osmolality (both total osmolality [Rho=0.398; p<0.001] and effective osmolality [Rho=0.311; p<0.001]), creatinine (Rho=0.281; p=0.002) and urea (Rho=0.354; p<0.001), corrected sodium for hyperglycemia (Rho=0.226; p=0.013), and C-reactive protein (Rho=0.342; p<0.001). A negative correlation was reported between the length of stay and the estimated pre-admission glomerular filtration rate (Rho=−0.192; p=0.045), the estimated admission glomerular filtration rate (Rho=−0.384; p<0.001), and serum potassium upon admission (Rho=−0.209; p=0.028).
The median length of stay among survivors was longer in women (n=58, 10 days) vs men (7 days; p=0.005); in patients who were insulin-naïve prior to admission (n=49, 10 days) vs patients who were on insulin treatment prior to admission (6 days; p<0.001); in patients who presented with an impaired mental status at the ED (n=50, 11 days) vs those who did not (7 days; p<0.001); and in HHC likely induced by infections (n=44, 12 days) vs those induced by other causes (7 days; p<0.001). Among the 84 survivors who had a known diagnosis of diabetes prior to admission, the length of stay was longer in those with type 2 diabetes mellitus (n=55, 9 days) vs those with type 1 diabetes (n=27) or diabetes due to pancreatic disease (n=2; 6 days; p=0.001). Among survivors in whom serum potassium concentrations could be determined upon admission (n=111), the median length of stay was longer in patients with hypokalemia (n=10, 12 days) vs those with normo- or hyperkalemia (8 days; p=0.030).
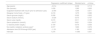
Table 2 shows the association between different covariates and the presence of prolonged hospitalization (length of stay >8 days). Patients with long lengths of stay were older, had a higher rate of female sex, a lower rate of known diabetes prior to admission (among patients with known diabetes, those with type 2 diabetes mellitus had a higher rate of prolonged hospitalization), a lower rate of outpatient insulin treatment prior to admission, a higher rate of an impaired mental status at the ED, higher admission serum glucose concentrations, higher serum osmolality upon admission (both total and effective), a lower estimated admission glomerular filtration rate (and higher serum creatinine and urea concentrations), higher admission C-reactive protein concentrations, a higher rate of non-ketotic metabolic acidosis, a higher rate of HHC likely induced by infections, and a lower rate of admission from 2019 through 2023 (as opposed to between 2014 and 2018) (Table 2).
Factors associated with long lengths of stay in survivors with hyperosmolar hyperglycemic crises.
| Feature | Length of stay | ||
|---|---|---|---|
| ≤8 days (n=61) | >8 days (n=58) | p-Value | |
| Demographics | |||
| Age (years) | 68 (51–79) | 74 (62–82) | 0.029 |
| Sex (woman) | 24 (39.3) | 34 (58.6) | 0.035 |
| Metabolic characteristics before admission | |||
| Known diagnosis of any form of diabetes prior to admission (yes) | 48 (78.7) | 36 (62.1) | 0.047 |
| Known diagnosis of type 2 diabetes prior to admission (yes)a | 27 (56.2) | 28 (77.8) | 0.040 |
| Outpatient treatment with insulin prior to admission (yes) | 33 (54.1) | 16 (27.6) | 0.003 |
| Other comorbidities prior to admission | |||
| Charlson Comorbidity Index (score points) | 4 (2–7) | 5 (3–7) | 0.249 |
| Dependence in activities of daily living (yes) | 15 (24.6) | 20 (34.5) | 0.235 |
| Baseline estimated glomerular filtration rate (mL/min/1.72m2)b | 68 (42–100) | 63 (47–77) | 0.173 |
| Physical examination | |||
| Glasgow Coma Scale <15 (yes) | 16 (26.2) | 34 (58.6) | <0.001 |
| Body temperature ≥37°C (yes) | 4 (6.6) | 3 (5.2) | 0.748 |
| Systolic BP ≥140mmHg and/or diastolic BP ≥90mmHg (yes) | 28 (45.9) | 24 (41.4) | 0.619 |
| Mean arterial BP <70mmHg (yes) | 12 (19.7) | 10 (17.2) | 0.733 |
| Heart rate >100beats per minute (yes) | 22 (36.1) | 16 (27.6) | 0.321 |
| Body mass index (kg/m2)c | 25.1 (21.4–29.7) | 26.6 (23.7–30.5) | 0.281 |
| Biochemical tests at the emergency department | |||
| Serum glucose (mg/dL) | 806 (697–935) | 925 (754–1099) | <0.001 |
| Total serum osmolality (mOsm/kg) | 326 (320–343) | 342 (324–373) | <0.001 |
| Effective serum osmolality (mOsm/kg) | 310 (303–323) | 321 (306–342) | 0.013 |
| Estimated glomerular filtration rate (mL/min/1.7m2)d | 34 (25–49) | 23 (17–36) | <0.001 |
| Serum creatinine (mg/dL) | 1.69 (1.38–2.17) | 2.19 (1.58–2.66) | 0.007 |
| Serum urea (mg/dL) | 101 (67–125) | 134 (100–165) | <0.001 |
| Serum sodium (mmol/L) | 133 (129–137) | 133 (129–143) | 0.600 |
| Corrected serum sodium for hyperglycemia (mmol/L) | 144 (141–149) | 147 (141–156) | 0.096 |
| Serum potassium (mmol/L)e | 5.1 (4.3–5.7) | 4.8 (3.9–5.5) | 0.145 |
| Serum potassium ≤3.5mmol/L (yes)e | 3 (5.3) | 7 (13.0) | 0.157 |
| Serum potassium ≥5.5mmol/L (yes)e | 20 (35.1) | 14 (25.9) | 0.295 |
| Blood pHf | 7.31 (7.01–7.39) | 7.32 (7.12–7.39) | 0.533 |
| Serum bicarbonate (mmol/L)g | 19 (8–24) | 20 (14–24) | 0.464 |
| Point-of-care β-hydroxybutyrate (mmol/L)h | 2.9 (0.2–6.7) | 1.6 (0.3–5.0) | 0.331 |
| Serum C-reactive protein (mg/dL)i | 1.1 (0.4–3.5) | 3.6 (1.3–10.1) | 0.001 |
| Serum procalcitonin (ng/mL)j | 0.5 (0.3–2.0) | 0.5 (0.2–1.7) | 0.783 |
| Blood neutrophil count (neutrophils/μL) | 10180 (6335–14930) | 12025 (7485–15097) | 0.428 |
| Features upon admission | |||
| Combined diabetic ketoacidosis – hyperosmolar hyperglycemic state (yes)k | 26 (42.6) | 17 (29.3) | 0.131 |
| Non-ketotic metabolic acidosis (yes)l | 2 (3.9) | 10 (17.2) | 0.011 |
| Infection-induced hyperosmolar hyperglycemic crisis (yes)m | 12 (19.7) | 32 (55.2) | <0.001 |
| Glucocorticoid-induced hyperosmolar hyperglycemic crisis (yes)n | 13 (21.3) | 8 (13.8) | 0.282 |
| Admission to the intensive care unit (yes) | 11 (18.0) | 9 (15.5) | 0.714 |
| Admission from 2019 through 2023 (yes) | 29 (47.5) | 15 (25.9) | 0.014 |
Data expressed absolute numbers and percentages (within parentheses) or medians and interquartile ranges (within parentheses). BP, blood pressure.
Data available for 84 patients, as only survivors with known diagnosis of any form of diabetes prior to admission were included in this analysis.
Baseline glomerular filtration rate was estimated by the CKD-EPI equation, using the most recent creatinine value prior to admission. Data available for 110 patients.
Glomerular filtration rate upon admission was estimated by the CKD-EPI equation, using admission serum creatinine.
Combined diabetic ketoacidosis – hyperosmolar hyperglycemic state was defined by hyperosmolar hyperglycemic state features combined with metabolic acidosis (pH <7.30 and/or bicarbonate <18mmol/L) and ketosis (point-of-care β-hydroxybutyrate ≥3mmol/L or, if not available, urine ketone strip ≥2+).
Table 3 shows a multivariate analysis (linear regression) of factors associated with the length of stay (in days). After adjusting for the variables shown in Table 3, only concentrations of serum glucose and C-reactive protein upon admission kept a positive association with the length of stay. Based on the results, the length of stay would increase by 1 day for every 125mg/dL of serum glucose upon admission and for every 6.2mg/dL of C-reactive protein upon admission (Table 3). The model explained a sizeable portion (more than one-third) of the variability in hospital length of stay (R2, 0.400). As a sensitivity analysis, in a logistic regression model of factors associated with prolonged hospitalization (length of stay >8 days), admission serum glucose and C-reactive protein also maintained a positive association with prolonged hospitalization (Supplementary Table 1). According to the results in Supplementary Table 1, every 100mg/dL of serum glucose on admission would increase the risk of prolonged admission by 30%; and every 1mg/dL of reactive C-protein would increase the risk of prolonged admission by 8%.
Multivariate analysis (linear regression) of factors associated with the length of stay (days) in hyperosmolar hyperglycemic crises.
| Regression coefficient (slope) | Standard error | p-Value | |
|---|---|---|---|
| Age (years) | −0.014 | 0.039 | 0.713 |
| Sex (woman) | 1.639 | 1.282 | 0.205 |
| Outpatient treatment with insulin prior to admission (yes) | −2.454 | 1.344 | 0.071 |
| Glasgow Coma Scale <15 (yes) | 2.218 | 1.275 | 0.086 |
| Serum glucose (mg/dL) | 0.008 | 0.002 | 0.002 |
| Serum sodium (mmol/L) | −0.024 | 0.073 | 0.737 |
| Serum urea (mg/dL) | 0.015 | 0.011 | 0.182 |
| Serum potassium (mmol/L) | −0.617 | 0.621 | 0.324 |
| C-reactive protein (mg/dL) | 0.159 | 0.075 | 0.036 |
| Non-ketotic metabolic acidosis (yes)a | 2.077 | 1.893 | 0.276 |
| Admission from 2019 through 2023 (yes) | −1.151 | 1.180 | 0.332 |
| Intercept | 7.275 | 11.560 | 0.531 |
All listed variables entered the equation. Complete data were available for 94 patients. The model explained 40% of the variability in the length of stay (R2, 0.400).
ICU admission was not associated with a higher rate of prolonged admission in survivors (Table 2). Supplementary Table 2 shows the factors associated with ICU admission. The independent predictors of prolonged hospitalization (admission concentrations of serum glucose and C-reactive protein) were not associated with a higher rate of ICU admission (Supplementary Table 2).
DiscussionOur results show that serum glucose and C-reactive protein on admission are independent predictors of prolonged length of stay in patients admitted for HHC. Older age, female sex, lack of a known diagnosis of diabetes prior to admission (particularly, lack of a pre-admission diagnosis of insulin-requiring diabetes), altered mental status on arrival at the ED, non-ketotic metabolic acidosis, higher admission serum sodium, higher admission urea, and hypokalemia were also associated with prolonged length of stay in HHC, although these associations were not statistically significant in multivariate analyses. To our knowledge, this is the first study to demonstrate these predictive associations in patients admitted for HHC.
Several of the factors associated with prolonged length of stay in survivors were also associated with in-hospital mortality in the entire sample: patients who died during hospitalization also had higher total serum osmolality, higher C-reactive protein concentrations, older age, and higher rate of altered mental status at the ED. In addition, patients who died had a higher number of previous comorbidities (according to the Charlson Comorbidity Index; and including dependence in daily activities) and a higher rate of body temperature ≥37°C on arrival at the ED. The aforementioned predictors of mortality in HHC have been previously identified.5,22–24 These results suggest that a greater severity of HHC can lead to prolonged hospitalization in survivors. Among the three components of total osmolality, only serum sodium and urea were significantly associated with increased mortality. However, glucose was the only component of total osmolality that maintained a positive association with length of stay in survivors after multivariate analyses. C-reactive protein, the other independent predictor of length of stay in our series, is an acute-phase serum protein that can be elevated in the presence of infection.25 Indeed, patients who received antibiotics within 24h of arrival at the ED had higher admission C-reactive protein concentrations than those who did not (data not shown; p<0.001). It is likely that infection, in addition to hyperglycemia, can increase the length of stay. In fact, patients who received antibiotic treatment in the first 24h after arrival (i.e., HHC likely induced by infection) also had longer lengths of stay.
Some of the factors that were associated with prolonged length of stay were not associated with increased mortality. Patients who were insulin-naïve did not have greater in-hospital mortality, but had longer length of stay than patients who were on insulin before admission. Similarly, patients who had known type 2 diabetes prior to admission (a type of diabetes that does not necessarily require insulin therapy)26 had longer length of stay than those who had known type 1 diabetes or diabetes secondary to pancreatic disease. The reasons for these findings may be related to diabetes education, which should be provided to all patients admitted for HHC.1 One of the most important topics to address in diabetes education is home insulin management, as insulin therapy will be required at discharge for the vast majority of patients admitted for HHC.1 Although injection technique should be reviewed in all patients,1 it is likely that patients who were not on insulin prior to admission may require a greater number of diabetes education sessions, which might lead to a longer length of stay. Another factor associated with increased length of stay, but not with mortality, was the presence of admission hypokalemia. In hypokalemic HHC, insulin administration should be delayed until serum potassium concentration has been corrected.1 The delay in initiating insulin therapy may be one of the reasons for the longer length of stay of patients with hypokalemia compared to those with normo- or hyperkalemia. Moreover, ionic correction itself could prolong the duration of intravenous fluid therapy in patients with hypokalemia. The rate of prolonged hospitalization was also higher in patients with non-ketotic metabolic acidosis. The most common cause of non-ketotic metabolic acidosis is lactic acidosis,27 a serious condition that can prolong hospitalization.28 Finally, women had a longer length of stay than men. The reasons for this association, which was no longer statistically significant after adjustment for age and other variables, are unknown. Interestingly, neither body temperature, heart rate, nor blood pressure in the ED were predictors of length of stay.
The study has limitations that need to be acknowledged, including those inherent to its retrospective nature,29 particularly information biases and the possibility that confounders were not adequately controlled. Due to the low availability of definitive microbiological culture results in the ED, the possibility of infection on admission was assessed using surrogate markers. The length of stay in HHC may vary depending on the resources of the health systems in each country.4,5,30 Both in our series and in previous studies,30 a decrease in the length of stay in HHC has been observed over the years, possibly related to the availability of better scientific evidence for treatment and more efficient hospital protocols that allow for optimized therapeutic education and ensure continuity of care in the out-of-hospital setting. C-reactive protein, one of the main predictors of prolonged length of stay in our study, was not available in all the survivors.
ConclusionsLength of stay is one of the main determinants of hospital occupancy. Predicting the length of stay at the time of admission can be very valuable for better management of hospital resources. Our results show that hyperglycemia and elevated C-reactive protein on admission are independent predictors of prolonged length of stay in survivors with HHC.
FundingNone declared.
Conflicts of interestNone declared.
Data availabilityThe data presented in this study are available on reasonable request from the corresponding author.
The following are the supplementary data to this article:

Bar chart illustrating the mean length of stay (days) in relation to the year of hospitalization.


