


Physical activity is beneficial for preventing metabolic diseases. Here, the circulatory level of apelin, one of the myokines, was assessed in patients with obesity to examine the effects of body composition, metabolic parameters, and physical fitness on apelin secretion following an exercise program.
MethodsA total 60 subjects [34 women (21 lean and 13 overweight/obese) and 26 men (8 lean and 18 overweight/obese)], age 30–59 years, with body mass index (BMI) of 18–30kg/m2 were recruited based on the guidelines for Korean obesity therapy in a clinical trial. Body composition, biochemical parameters, and physical fitness test were conducted. A single bout of exhaustive exercise was performed following Bruce protocol. Relationships among exercise-induced apelin, metabolic factors, and physical capacity were then analyzed. Independent/paired t-test between groups/time points and Pearson correlations were performed.
ResultsThere were significant positive correlations in post-exercise apelin and lean mass (P=0.006), homeostatic model assessment of insulin resistance (HOMA-IR; P=0.004), HOMA insulin secretion (HOMA-%B; P=0.005), lactate dehydrogenase (LDH; P=0.002), grip strength (P=0.004), and isokinetic knee flexion and extension tests in 60° and 240°/s (all variables, P<0.05), but these parameters were not correlated with pre-exercise apelin. Exercise was more effective in increasing apelin level in men compared to women.
ConclusionAcute exercise increased circulating apelin, which was more effective in obese compared to healthy men, while no effect in women regardless of obesity status. Thus, apelin secretion after a single exercise is dependent on gender and metabolic status of subjects.
La actividad física es beneficiosa para prevenir las enfermedades metabólicas. Se evaluaron los niveles circulantes de apelina, una mioquina, en pacientes obesos para investigar los efectos de la composición corporal, los parámetros metabólicos y el estado físico en la secreción de apelina después de un programa de ejercicio.
MétodosSesenta sujetos [34 mujeres (21 delgadas y 13 con sobrepeso/obesidad) y 26 varones (8 delgados y 18 con sobrepeso/obesidad)], de 30-59 años, con un índice de masa corporal (IMC) de 18-30kg/m2 fueron incluidos en un ensayo clínico basado en las directrices coreanas para el tratamiento de la obesidad. Se evaluaron la composición corporal, los parámetros bioquímicos y el estado físico. Se realizó una sola sesión de ejercicio exhaustivo siguiendo el protocolo de Bruce. A continuación se analizaron las relaciones entre la apelina inducida por el ejercicio, los factores metabólicos y el estado físico. Se realizaron pruebas de la t independientes/por parejas entre grupos/puntos temporales y correlaciones de Pearson.
ResultadosSe observaron correlaciones positivas y significativas entre los niveles de apelina después del ejercicio y la masa magra (P=0,006), modelo homeostático de resistencia a la insulina (HOMA-IR; P=0,004), la secreción de insulina según el HOMA (HOMA-%B; P=0,005), el nivel de lactato deshidrogenasa (LDH; P=0,002), la fuerza de prensión (P=0,004) y las pruebas isocinéticas de flexión y extensión de la rodilla en 60° y 240°/s (todas las variables, P<0,05), pero estos parámetros no se correlacionaron con la apelina previa al ejercicio. El ejercicio fue más eficaz para aumentar los niveles de apelina en los varones que en las mujeres.
ConclusiónEl ejercicio agudo incrementó los niveles de apelina circulante y fue más eficaz en los varones obesos que en los sanos, mientras que no se observó ningún efecto en las mujeres, independientemente del estado de obesidad. Por tanto, la secreción de apelina tras una única sesión de ejercicio depende del sexo y del estado metabólico de los sujetos.
Obesity commonly precedes metabolic dysfunction and diseases such as type 2 diabetes mellitus (T2DM) and cardiovascular disease (CVD).1 Poor physical activity is a primary reason for increasing obesity, and preservation of skeletal muscle induced by exercise increases metabolic rate and reduces obesity.2 Obese individuals usually have low exercise capacity and physical dysfunction compared to healthy adults, leading to further weight accumulation and unstable metabolic homeostasis.3,4 Physical activity has been considered as a key factor for increasing lean mass, enhancing muscular strength and cardiorespiratory fitness.5
Apelin, also known as APLN, was identified as the ligand of a G-protein-coupled receptor, putative receptor protein related to AT1 (APJ)6,7 and introduced as a therapeutic target for improving insulin sensitivity and preventing obesity and diabetes mellitus.8,9 For instance, intravenous injection of apelin improved glucose utilization in insulin resistant obese mice.10 Recently, regular exercise has been shown to stimulate apelin secretion.11,12 In a previous study in obese subjects, 8 weeks of endurance training improved maximal oxygen consumption and decreased fat mass, which upregulated muscle apelin mRNA expression and improved insulin sensitivity.12 In type 2 diabetic rats, endurance exercise enhances circulating apelin levels and improves metabolic parameters.13 A recent meta-analysis reported that acute exercise was associated with post-exercise increase of a myokine, irisin, which was lower in obese compared to healthy subjects.14 Although there are reports of differential cytokine secretion between lean and obese people following acute exercise, the effects of an exhaustive single bout of exercise in inducing apelin expression and its correlation with body composition/physical fitness between gender and between lean and overweight/obese have not been reported.
In the present study, we examined the differences of body composition, metabolic condition, and physical capacity in healthy and overweight/obese individuals in response to a single bout of exhaustive exercise intervention. The hypothesis is that apelin secretion following a single bout of exhaustive exercise is dependent on metabolic state, body composition and sex of subjects.
Materials and methodsParticipantsA total 60 subjects [34 women (21 lean and 13 overweight/obese) and 26 men (8 lean and 18 overweight/obese)], age 30–59 years, with body mass index (BMI) of 18–30kg/m2 were recruited in this study based on the guidelines for overweight (BMI of 23–24.9kg/m2) and obesity (BMI of over 25kg/m2)15 at the Institute of Sport Science, Seoul National University, Seoul, South Korea. All experimental materials and methods were approved by the ethical committee of the Seoul National University Institutional Review Board (SNUIRB No. 1509/001-017) and registered with the Clinical Research Information Service (https://cris.nih.go.kr; CRIS No. KCT0001743) in accordance with the WHO International Clinical Trials Registry Platform (ICTRP).
Sample size determinationFor determining the sample size, nineteen adults (ten women and nine men) were recruited for the pilot study. The correlation between BMI and plasma apelin concentration (baseline) was examined in Supplementary Fig. 1 (Appendix A). Forty-four individuals were finally determined as a sample size using G*Power software 3.1 (α err prob=0.05, Power=0.08). In present study, total 60 participants were recruited considering approximately 30% of give up rates.
Experimental proceduresEligibility criteria and consentParticipants were recruited through a public letter to university community members and public relations flyers, and volunteers were screened first under telephone interview and then by physical examination. All participants who visited in the screening session understood the purpose of this study and signed written informed consent. All processes were performed as a double-blind controlled clinical trial between volunteers and expert operators. During the screening visit, volunteers were excluded by measuring vital signs [systolic blood pressure>120mmHg, diastolic blood pressure>80mmHg, or body temperature] and laboratory tests [urinary pregnancy test positive or Human Chorionic Gonadotropin (hCG) level>25mlU/mL (positive)], questionnaires to examine disease history (presence of musculoskeletal disease) and physical activity levels (exercise ≥4 times per week) using International Physical Activity Questionnaire (IPAQ) short version. Volunteers in the presence of clinic pathological issues such as severe diseases, pregnancy, and drug addiction were also excluded. In addition, volunteers who joined in other clinical trials within 4 weeks, had eaten any supplementation within 4 weeks, or had regularly exercised over mid-intensity within 3 months, and standard contraindication for dual-energy X-ray absorptiometry (DXA) examinations (Fig. 1) were excluded. Inclusion criteria were consent to join the current study and could perform a single bout of exhaustion exercise. During the 2nd visit, body composition and physical fitness test were conducted, followed by a single bout of exhaustive exercise, all of which were conducted within 2h duration.
A single bout of exhaustive exercise and blood collection.")
To assess cardiovascular function, participants were encouraged to continue treadmill exercise until volitional exhaustion to measure exercise capacity, including maximal oxygen consumption (VO2max), exercise time, and total distance according to the Bruce protocol16 using the treadmill ergometer (T150, Cosmed, Rome, Italy). In briefly, following overnight fast, participants were performed an acute treadmill exercise at the same moment of the maximal oxygen consumption test until being exhausted. The results of VO2max, exercise time (min), and total distance (m) are the specific characteristics of the exercise, which are presented in Table 1. Blood samples were taken from participants before exercise, and at 0, 15, 30min after exercise based on the half-life of apelin17 determined through preliminary studies (Supplementary Fig. 2, Appendix A). During exercise, the degree of difficulty was numerically recorded following rated perceived exertion (RPE) scale.
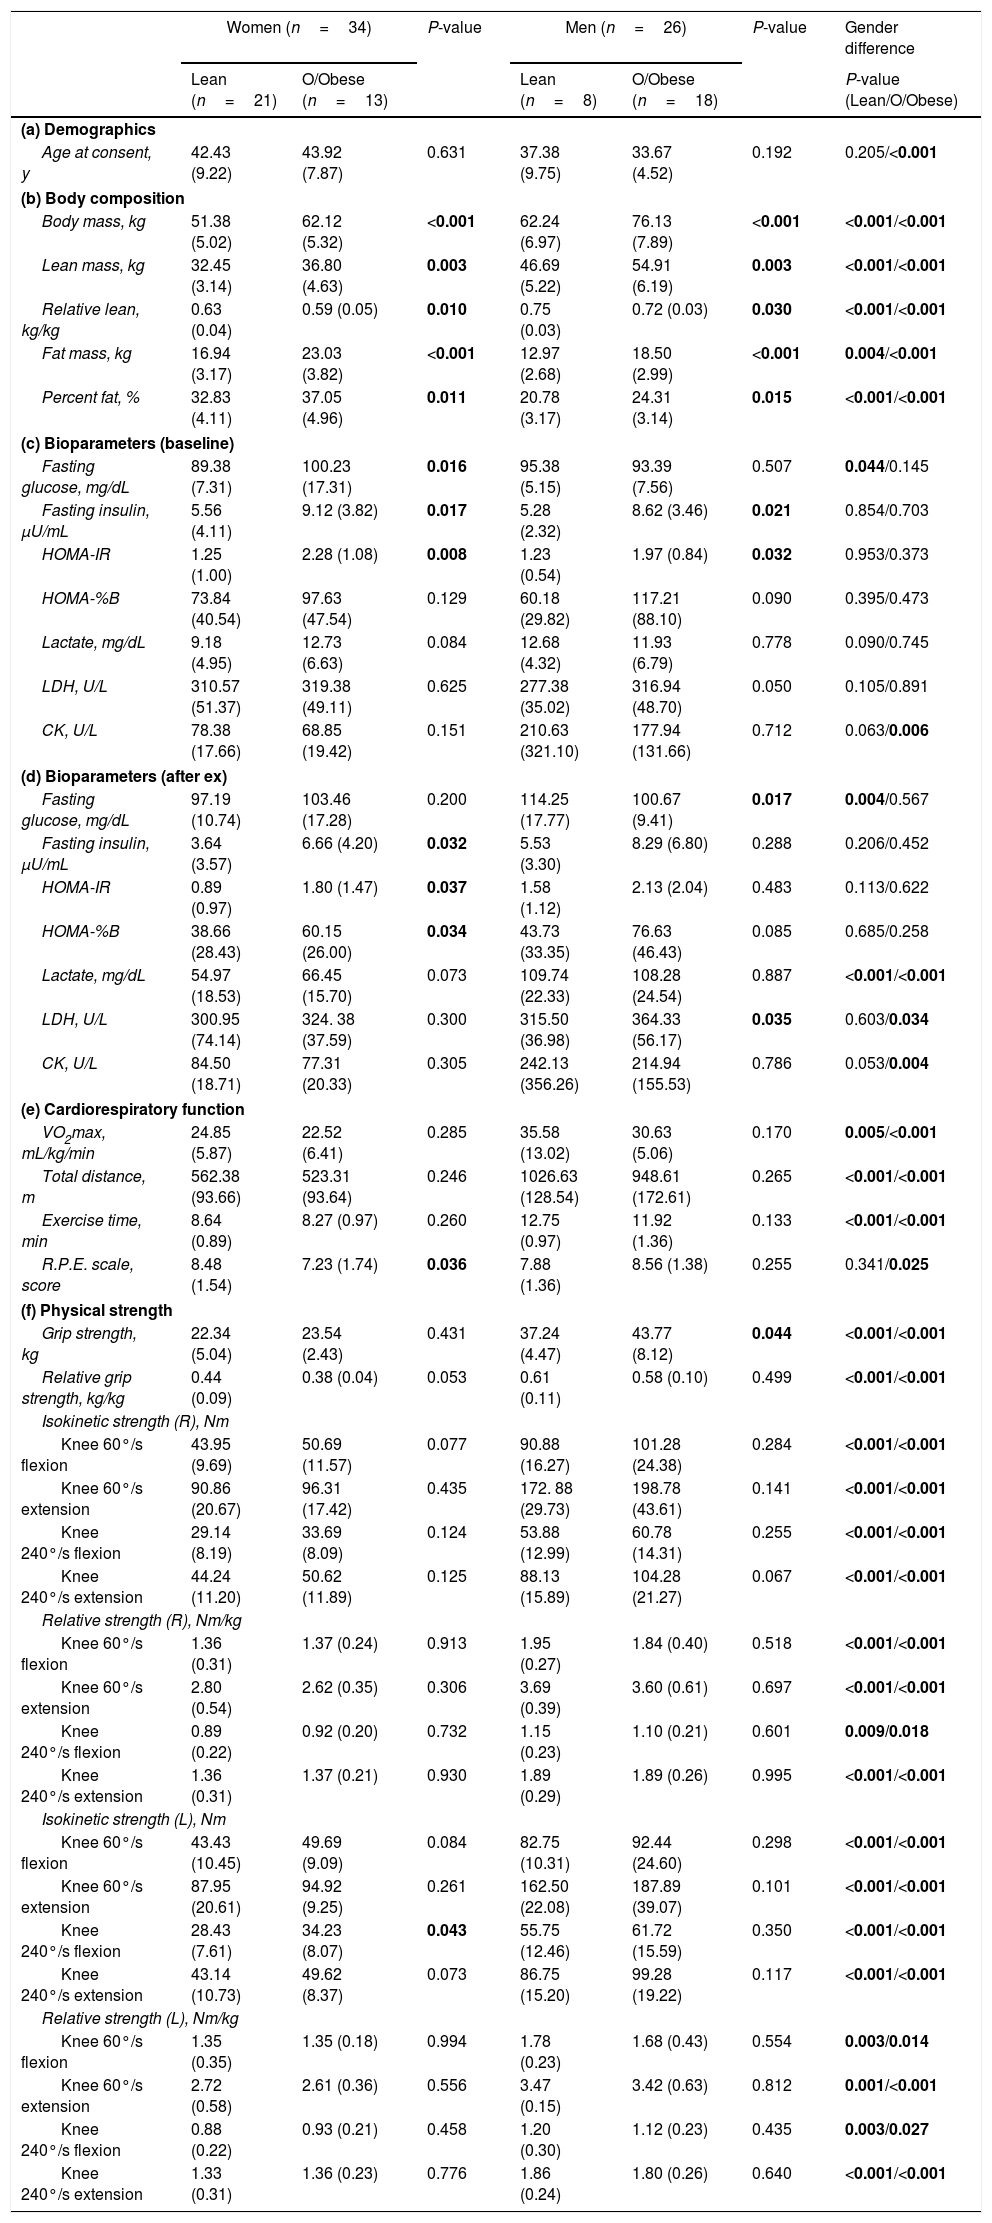
Basic characteristics of participants with healthy and overweight/obese adults.
| Women (n=34) | P-value | Men (n=26) | P-value | Gender difference | |||
|---|---|---|---|---|---|---|---|
| Lean (n=21) | O/Obese (n=13) | Lean (n=8) | O/Obese (n=18) | P-value (Lean/O/Obese) | |||
| (a) Demographics | |||||||
| Age at consent, y | 42.43 (9.22) | 43.92 (7.87) | 0.631 | 37.38 (9.75) | 33.67 (4.52) | 0.192 | 0.205/<0.001 |
| (b) Body composition | |||||||
| Body mass, kg | 51.38 (5.02) | 62.12 (5.32) | <0.001 | 62.24 (6.97) | 76.13 (7.89) | <0.001 | <0.001/<0.001 |
| Lean mass, kg | 32.45 (3.14) | 36.80 (4.63) | 0.003 | 46.69 (5.22) | 54.91 (6.19) | 0.003 | <0.001/<0.001 |
| Relative lean, kg/kg | 0.63 (0.04) | 0.59 (0.05) | 0.010 | 0.75 (0.03) | 0.72 (0.03) | 0.030 | <0.001/<0.001 |
| Fat mass, kg | 16.94 (3.17) | 23.03 (3.82) | <0.001 | 12.97 (2.68) | 18.50 (2.99) | <0.001 | 0.004/<0.001 |
| Percent fat, % | 32.83 (4.11) | 37.05 (4.96) | 0.011 | 20.78 (3.17) | 24.31 (3.14) | 0.015 | <0.001/<0.001 |
| (c) Bioparameters (baseline) | |||||||
| Fasting glucose, mg/dL | 89.38 (7.31) | 100.23 (17.31) | 0.016 | 95.38 (5.15) | 93.39 (7.56) | 0.507 | 0.044/0.145 |
| Fasting insulin, μU/mL | 5.56 (4.11) | 9.12 (3.82) | 0.017 | 5.28 (2.32) | 8.62 (3.46) | 0.021 | 0.854/0.703 |
| HOMA-IR | 1.25 (1.00) | 2.28 (1.08) | 0.008 | 1.23 (0.54) | 1.97 (0.84) | 0.032 | 0.953/0.373 |
| HOMA-%B | 73.84 (40.54) | 97.63 (47.54) | 0.129 | 60.18 (29.82) | 117.21 (88.10) | 0.090 | 0.395/0.473 |
| Lactate, mg/dL | 9.18 (4.95) | 12.73 (6.63) | 0.084 | 12.68 (4.32) | 11.93 (6.79) | 0.778 | 0.090/0.745 |
| LDH, U/L | 310.57 (51.37) | 319.38 (49.11) | 0.625 | 277.38 (35.02) | 316.94 (48.70) | 0.050 | 0.105/0.891 |
| CK, U/L | 78.38 (17.66) | 68.85 (19.42) | 0.151 | 210.63 (321.10) | 177.94 (131.66) | 0.712 | 0.063/0.006 |
| (d) Bioparameters (after ex) | |||||||
| Fasting glucose, mg/dL | 97.19 (10.74) | 103.46 (17.28) | 0.200 | 114.25 (17.77) | 100.67 (9.41) | 0.017 | 0.004/0.567 |
| Fasting insulin, μU/mL | 3.64 (3.57) | 6.66 (4.20) | 0.032 | 5.53 (3.30) | 8.29 (6.80) | 0.288 | 0.206/0.452 |
| HOMA-IR | 0.89 (0.97) | 1.80 (1.47) | 0.037 | 1.58 (1.12) | 2.13 (2.04) | 0.483 | 0.113/0.622 |
| HOMA-%B | 38.66 (28.43) | 60.15 (26.00) | 0.034 | 43.73 (33.35) | 76.63 (46.43) | 0.085 | 0.685/0.258 |
| Lactate, mg/dL | 54.97 (18.53) | 66.45 (15.70) | 0.073 | 109.74 (22.33) | 108.28 (24.54) | 0.887 | <0.001/<0.001 |
| LDH, U/L | 300.95 (74.14) | 324. 38 (37.59) | 0.300 | 315.50 (36.98) | 364.33 (56.17) | 0.035 | 0.603/0.034 |
| CK, U/L | 84.50 (18.71) | 77.31 (20.33) | 0.305 | 242.13 (356.26) | 214.94 (155.53) | 0.786 | 0.053/0.004 |
| (e) Cardiorespiratory function | |||||||
| VO2max, mL/kg/min | 24.85 (5.87) | 22.52 (6.41) | 0.285 | 35.58 (13.02) | 30.63 (5.06) | 0.170 | 0.005/<0.001 |
| Total distance, m | 562.38 (93.66) | 523.31 (93.64) | 0.246 | 1026.63 (128.54) | 948.61 (172.61) | 0.265 | <0.001/<0.001 |
| Exercise time, min | 8.64 (0.89) | 8.27 (0.97) | 0.260 | 12.75 (0.97) | 11.92 (1.36) | 0.133 | <0.001/<0.001 |
| R.P.E. scale, score | 8.48 (1.54) | 7.23 (1.74) | 0.036 | 7.88 (1.36) | 8.56 (1.38) | 0.255 | 0.341/0.025 |
| (f) Physical strength | |||||||
| Grip strength, kg | 22.34 (5.04) | 23.54 (2.43) | 0.431 | 37.24 (4.47) | 43.77 (8.12) | 0.044 | <0.001/<0.001 |
| Relative grip strength, kg/kg | 0.44 (0.09) | 0.38 (0.04) | 0.053 | 0.61 (0.11) | 0.58 (0.10) | 0.499 | <0.001/<0.001 |
| Isokinetic strength (R), Nm | |||||||
| Knee 60°/s flexion | 43.95 (9.69) | 50.69 (11.57) | 0.077 | 90.88 (16.27) | 101.28 (24.38) | 0.284 | <0.001/<0.001 |
| Knee 60°/s extension | 90.86 (20.67) | 96.31 (17.42) | 0.435 | 172. 88 (29.73) | 198.78 (43.61) | 0.141 | <0.001/<0.001 |
| Knee 240°/s flexion | 29.14 (8.19) | 33.69 (8.09) | 0.124 | 53.88 (12.99) | 60.78 (14.31) | 0.255 | <0.001/<0.001 |
| Knee 240°/s extension | 44.24 (11.20) | 50.62 (11.89) | 0.125 | 88.13 (15.89) | 104.28 (21.27) | 0.067 | <0.001/<0.001 |
| Relative strength (R), Nm/kg | |||||||
| Knee 60°/s flexion | 1.36 (0.31) | 1.37 (0.24) | 0.913 | 1.95 (0.27) | 1.84 (0.40) | 0.518 | <0.001/<0.001 |
| Knee 60°/s extension | 2.80 (0.54) | 2.62 (0.35) | 0.306 | 3.69 (0.39) | 3.60 (0.61) | 0.697 | <0.001/<0.001 |
| Knee 240°/s flexion | 0.89 (0.22) | 0.92 (0.20) | 0.732 | 1.15 (0.23) | 1.10 (0.21) | 0.601 | 0.009/0.018 |
| Knee 240°/s extension | 1.36 (0.31) | 1.37 (0.21) | 0.930 | 1.89 (0.29) | 1.89 (0.26) | 0.995 | <0.001/<0.001 |
| Isokinetic strength (L), Nm | |||||||
| Knee 60°/s flexion | 43.43 (10.45) | 49.69 (9.09) | 0.084 | 82.75 (10.31) | 92.44 (24.60) | 0.298 | <0.001/<0.001 |
| Knee 60°/s extension | 87.95 (20.61) | 94.92 (9.25) | 0.261 | 162.50 (22.08) | 187.89 (39.07) | 0.101 | <0.001/<0.001 |
| Knee 240°/s flexion | 28.43 (7.61) | 34.23 (8.07) | 0.043 | 55.75 (12.46) | 61.72 (15.59) | 0.350 | <0.001/<0.001 |
| Knee 240°/s extension | 43.14 (10.73) | 49.62 (8.37) | 0.073 | 86.75 (15.20) | 99.28 (19.22) | 0.117 | <0.001/<0.001 |
| Relative strength (L), Nm/kg | |||||||
| Knee 60°/s flexion | 1.35 (0.35) | 1.35 (0.18) | 0.994 | 1.78 (0.23) | 1.68 (0.43) | 0.554 | 0.003/0.014 |
| Knee 60°/s extension | 2.72 (0.58) | 2.61 (0.36) | 0.556 | 3.47 (0.15) | 3.42 (0.63) | 0.812 | 0.001/<0.001 |
| Knee 240°/s flexion | 0.88 (0.22) | 0.93 (0.21) | 0.458 | 1.20 (0.30) | 1.12 (0.23) | 0.435 | 0.003/0.027 |
| Knee 240°/s extension | 1.33 (0.31) | 1.36 (0.23) | 0.776 | 1.86 (0.24) | 1.80 (0.26) | 0.640 | <0.001/<0.001 |
Abbreviations: O/Obese, overweight/obese; HOMA-IR, homeostatic model assessment of insulin resistance; HOMA-%B, homeostatic model assessment of insulin secretion; LDH, lactate dehydrogenase; CK, creatine kinase; VO2max, maximal volume of oxygen uptake; R.P.E. scale, rating of perceived exertion.
P-values less than 0.05 were statistically different (in bold).
Body composition was measured by using Dual-energy X-ray absorptiometry (DXA) (Hologic, Inc., Waltham, Massachusetts), including total mass, fat mass, lean mass, and percent fat before performing a single bout of exhaustive exercise. Insulin and blood glucose before/after exercise were analyzed, which was used for the analysis of homeostatic model assessment of insulin resistance (HOMA-IR) and insulin secretion (HOMA-%B) according to the following formula: HOMA-IR [Fasting insulin in μU/mL×(fasting blood glucose in mg/dL×0.055)/22.5]18; HOMA-%B [(360×fasting insulin in μU/mL)/(fasting blood glucose−63)].18
Physical fitness testTo measure the lower body strength, the isokinetic dynamometer equipment (Humac Norm, CSMi, Massachusetts) was used as previously described.19 All participants were asked to perform knee isokinetic contraction at two angular velocities: 60°/s for assessment of muscle strength (five maximal contractions) and 240°/s for assessment of muscle endurance strength (twenty-five maximal contractions) of knee extension and flexion in right and left limbs in a seated position. For measuring upper body strength, the grip strength test was conducted using digital hand grip dynamometer (my-5401, TAKEI, Niigata, Japan) as previously described.19 Participants performed the grip strength test standing with straight arms, and wrists in a neutral position, and then were asked to conduct a maximal isometric contraction twice using both hands.
Biochemical measurementsApelin was measured using a previously validated enzyme immunoassay (EIA) apelin-12 kit (#EK-057-23, Phoenix Pharmaceuticals, Burlingame, California).13 Lactate, lactate dehydrogenase (LDH), and creatine kinase (CK) were measured by Green Cross Laboratory (Green Cross Corp., Seoul, South Korea) according to Roche diagnostics (Roche Diagnostics GmbH, Mannheim, Germany).
Statistical analysisData of primary outcomes were analyzed using simple linear regression analysis (Pearson correlation), including r (slope) and P value to examine the bivariate association between selected variables (n=60, including lean and overweight/obese adults). For data of exploratory outcomes, independent and/or paired t-tests were used to compare mean outcome values, and regression slopes between selected variables were conducted using Pearson correlation. Imputations were not applied to overcome missing data in the Pearson correlation of primary analysis. Values in the text, figures, and tables are presented as mean±SD, and statistical significance was determined at P<0.05, using Origin 8.0 and SPSS version 18.0 software (IBM Corp., Armonk, New York).
The Shapiro–Wilk test was used for testing normal distribution of data. For the secretion of apelin (baseline, 0, 15, and 30min after exercise), the groups of lean and overweight/obese adults were not normally distributed. In the case of abnormal distribution, Mann–Whitney U test was used to test statistical significance.
ResultsAnthropometric and clinical characteristicsA total of 102 adults were screened for trial eligibility (Fig. 1) including anthropometric parameters and vital signs (Supplementary Table 1, Appendix A), and 60 participants [51.67% with overweight/obese; 56.67% women; mean age, 39.45 (SD, 8.65) years] were assigned into healthy and overweight/obese groups. Demographics and basic characteristics of participants in each group are shown in Table 1. Basic blood and urine tests of participants included in this study were conducted to measure physiological conditions (Supplementary Table 2, Appendix A). As expected, overweight/obese women and men had higher body weight, lean mass, fat mass, and percent fat, while lower relative lean mass (the ratio of lean mass to body weight) compared to healthy adults. Bone mineral content and density between overweight/obese and healthy groups only differed in women, but not in men (Table 1b). The fasting insulin level and HOMA-IR of overweight/obese adults were higher than healthy adults, consistent with higher fasting glucose of overweight/obese women (Table 1c).
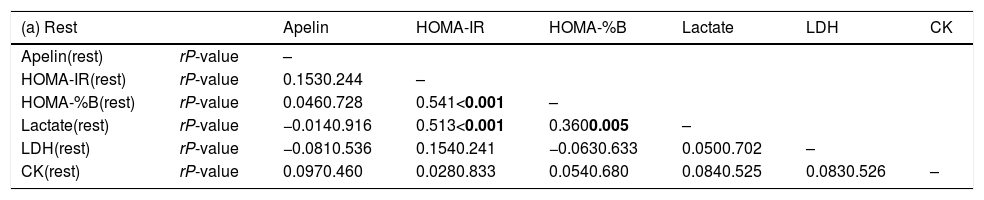
Primary outcomesAfter a single bout of exhaustive exercise, there was significant correlation between plasma apelin level (0min) and lean mass (r=0.350, P=0.006). On the other hand, no significant correlation was found in resting plasma apelin and lean mass (r=0.137, P=0.296). Furthermore, no significant differences between lean mass and HOMA-IR before/after exercise were found (Fig. 2). Circulating apelin level (0min) was also positively associated with HOMA-IR (0min; r=0.366, P=0.004), HOMA-%B (0min; r=0.360, P=0.005), and LDH (0min; r=0.395, P=0.002) after exercise immediately, but no correlation was observed before exercise (Table 2).
 The association pre-exercise. (B) The association post-exercise. Pearson correlation was examined.")
Association between apelin and biochemical measurements in circulation.
| (a) Rest | Apelin | HOMA-IR | HOMA-%B | Lactate | LDH | CK | |
|---|---|---|---|---|---|---|---|
| Apelin(rest) | rP-value | – | |||||
| HOMA-IR(rest) | rP-value | 0.1530.244 | – | ||||
| HOMA-%B(rest) | rP-value | 0.0460.728 | 0.541<0.001 | – | |||
| Lactate(rest) | rP-value | −0.0140.916 | 0.513<0.001 | 0.3600.005 | – | ||
| LDH(rest) | rP-value | −0.0810.536 | 0.1540.241 | −0.0630.633 | 0.0500.702 | – | |
| CK(rest) | rP-value | 0.0970.460 | 0.0280.833 | 0.0540.680 | 0.0840.525 | 0.0830.526 | – |
| (b) After exercise | Apelin | HOMA-IR | HOMA-%B | Lactate | LDH | CK | |
|---|---|---|---|---|---|---|---|
| Apelin(0 min) | rP-value | – | |||||
| HOMA-IR(0min) | rP-value | 0.3660.004 | – | ||||
| HOMA-%B(0min) | rP-value | 0.3600.005 | 0.758<0.001 | – | |||
| Lactate(0min) | rP-value | 0.2490.055 | 0.3040.018 | 0.2870.026 | – | ||
| LDH(0min) | rP-value | 0.3950.002 | 0.2890.025 | 0.2920.024 | 0.3280.010 | – | |
| CK(0min) | rP-value | 0.2140.104 | 0.0460.729 | 0.0830.533 | 0.472<0.001 | 0.2150.102 | – |
Pearson correlation was examined. Abbreviations: HOMA-IR, homeostatic model assessment of insulin resistance; HOMA-%B, homeostatic model assessment of insulin secretion; LDH, lactate dehydrogenase; CK, creatine kinase.
P-values less than 0.05 were statistically different (in bold).
The circulating apelin level of overweight/obese men was significantly increased after exercise (30min versus 0min, P=0.027), which was absent for lean men. However, no change was observed for women regardless of lean or obese (Fig. 3A and B). There was no difference in lactate content between lean and overweight/obese men. In addition, the lactate secretion was more profound in men compared to women after exercise [AUC; lean (P<0.001) and obese (P<0.001); Fig. 3C and D]. Consistently, following exercise, there was a significant increase of LDH in overweight/obese men (0min versus 30min, P=0.035), so for lean men (0min versus 30min, P=0.041), while no difference was observed for women (Fig. 3E and F). Similar trends of changes were observed for CK (Fig. 3G and H).
. All measurements are further presented using the area under the curve (AUC) separately. Data presented as mean±SD. *P<0.05 vs. control and #P<0.001 vs. resting point.")
Biochemical measurements such as plasma apelin, lactate, LDH, and CK before and after an exhaustive acute exercise divided by gender and obesity (A, C, E, G: men, B, D, F, H: women). All measurements are further presented using the area under the curve (AUC) separately. Data presented as mean±SD. *P<0.05 vs. control and #P<0.001 vs. resting point.
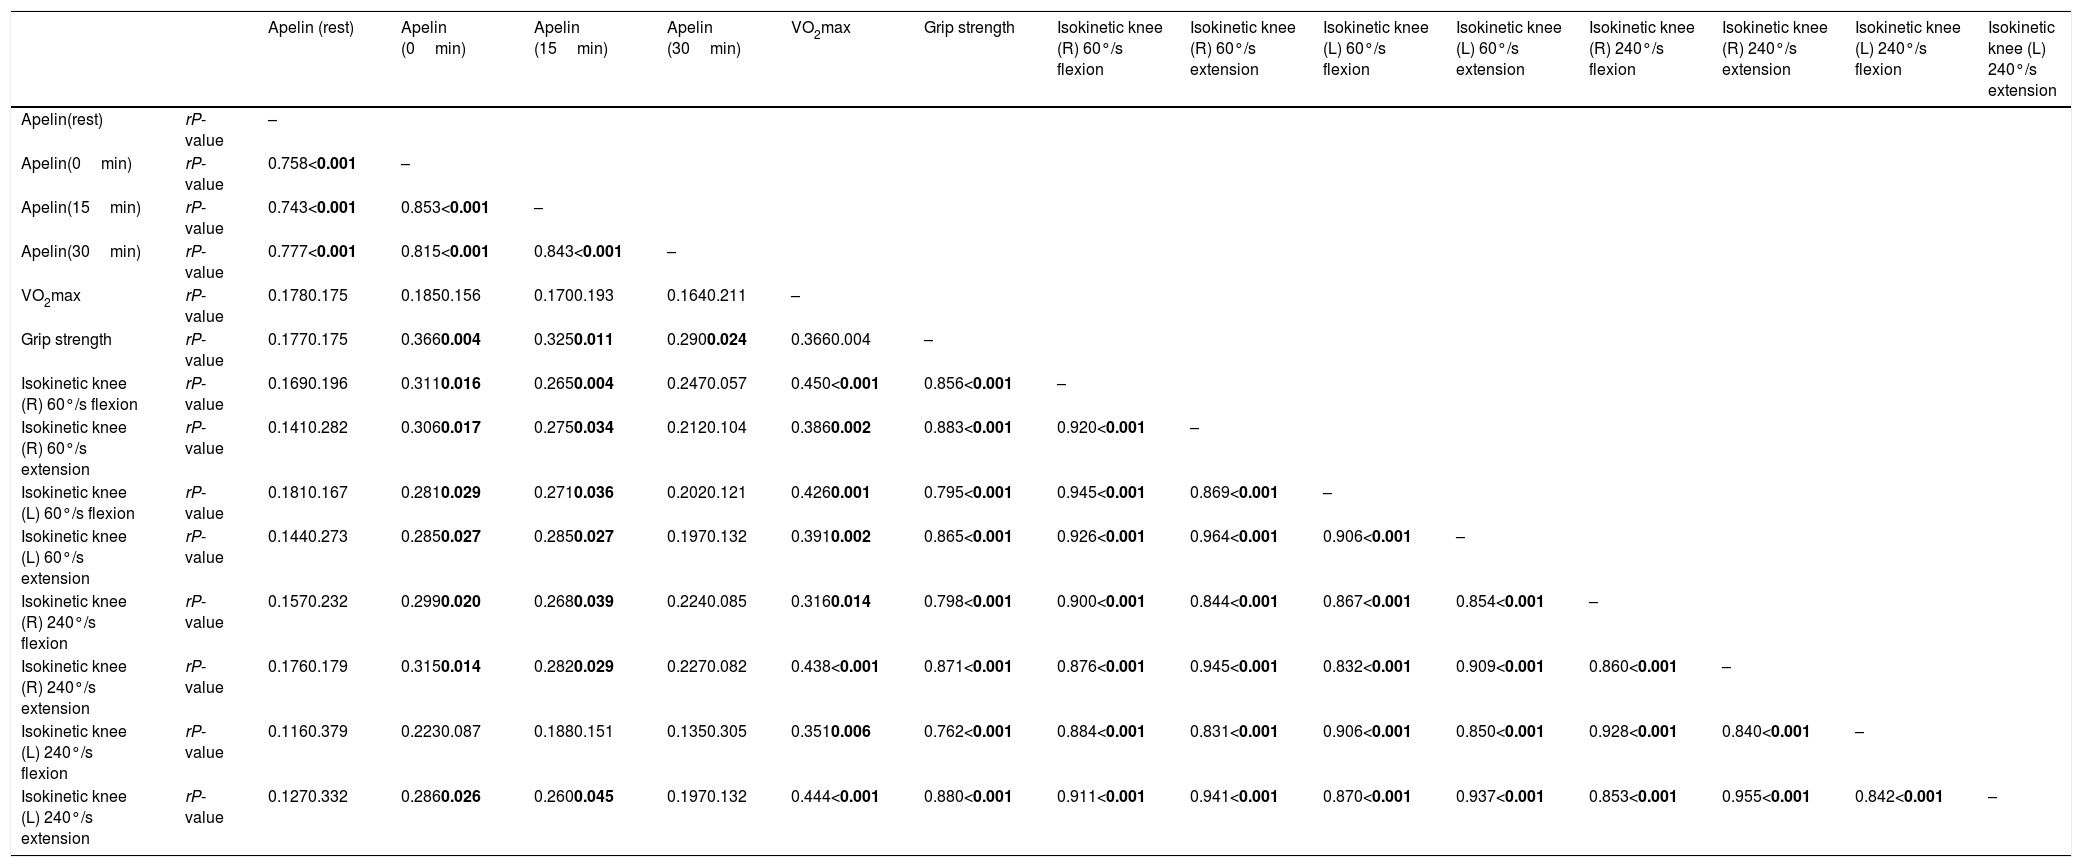
No differences in maximal oxygen consumption and distance were observed between lean and overweight/obese subjects. Similarly, no difference in the relative grip strength and the relative isokinetic knee flexion and extension (60° and 240°/s) (Table 1). There was no association between resting plasma apelin level and physical fitness such as maximal oxygen consumption, grip strength, and isokinetic knee flexion and extension. On the other hand, after exhaustive treadmill exercise, apelin levels in 0 and 15min were associated with grip strength and isokinetic knee flexion/extension (60° and 240°/s) of both limbs (P<0.05) except isokinetic knee 240°/s flexion in left leg. In addition, differences between gender in cardiovascular function and physical strength were further observed (Table 1). After 30min of exercise, on the other hand, no differences were found in apelin secretion and physical fitness measurements except grip strength (Table 3).
Association between apelin and physical fitness.
| Apelin (rest) | Apelin (0min) | Apelin (15min) | Apelin (30min) | VO2max | Grip strength | Isokinetic knee (R) 60°/s flexion | Isokinetic knee (R) 60°/s extension | Isokinetic knee (L) 60°/s flexion | Isokinetic knee (L) 60°/s extension | Isokinetic knee (R) 240°/s flexion | Isokinetic knee (R) 240°/s extension | Isokinetic knee (L) 240°/s flexion | Isokinetic knee (L) 240°/s extension | ||
|---|---|---|---|---|---|---|---|---|---|---|---|---|---|---|---|
| Apelin(rest) | rP-value | – | |||||||||||||
| Apelin(0min) | rP-value | 0.758<0.001 | – | ||||||||||||
| Apelin(15min) | rP-value | 0.743<0.001 | 0.853<0.001 | – | |||||||||||
| Apelin(30min) | rP-value | 0.777<0.001 | 0.815<0.001 | 0.843<0.001 | – | ||||||||||
| VO2max | rP-value | 0.1780.175 | 0.1850.156 | 0.1700.193 | 0.1640.211 | – | |||||||||
| Grip strength | rP-value | 0.1770.175 | 0.3660.004 | 0.3250.011 | 0.2900.024 | 0.3660.004 | – | ||||||||
| Isokinetic knee (R) 60°/s flexion | rP-value | 0.1690.196 | 0.3110.016 | 0.2650.004 | 0.2470.057 | 0.450<0.001 | 0.856<0.001 | – | |||||||
| Isokinetic knee (R) 60°/s extension | rP-value | 0.1410.282 | 0.3060.017 | 0.2750.034 | 0.2120.104 | 0.3860.002 | 0.883<0.001 | 0.920<0.001 | – | ||||||
| Isokinetic knee (L) 60°/s flexion | rP-value | 0.1810.167 | 0.2810.029 | 0.2710.036 | 0.2020.121 | 0.4260.001 | 0.795<0.001 | 0.945<0.001 | 0.869<0.001 | – | |||||
| Isokinetic knee (L) 60°/s extension | rP-value | 0.1440.273 | 0.2850.027 | 0.2850.027 | 0.1970.132 | 0.3910.002 | 0.865<0.001 | 0.926<0.001 | 0.964<0.001 | 0.906<0.001 | – | ||||
| Isokinetic knee (R) 240°/s flexion | rP-value | 0.1570.232 | 0.2990.020 | 0.2680.039 | 0.2240.085 | 0.3160.014 | 0.798<0.001 | 0.900<0.001 | 0.844<0.001 | 0.867<0.001 | 0.854<0.001 | – | |||
| Isokinetic knee (R) 240°/s extension | rP-value | 0.1760.179 | 0.3150.014 | 0.2820.029 | 0.2270.082 | 0.438<0.001 | 0.871<0.001 | 0.876<0.001 | 0.945<0.001 | 0.832<0.001 | 0.909<0.001 | 0.860<0.001 | – | ||
| Isokinetic knee (L) 240°/s flexion | rP-value | 0.1160.379 | 0.2230.087 | 0.1880.151 | 0.1350.305 | 0.3510.006 | 0.762<0.001 | 0.884<0.001 | 0.831<0.001 | 0.906<0.001 | 0.850<0.001 | 0.928<0.001 | 0.840<0.001 | – | |
| Isokinetic knee (L) 240°/s extension | rP-value | 0.1270.332 | 0.2860.026 | 0.2600.045 | 0.1970.132 | 0.444<0.001 | 0.880<0.001 | 0.911<0.001 | 0.941<0.001 | 0.870<0.001 | 0.937<0.001 | 0.853<0.001 | 0.955<0.001 | 0.842<0.001 | – |
Pearson correlation was examined. Abbreviations: VO2max, maximal volume of oxygen uptake.
P-values less than 0.05 were statistically different (in bold).
Skeletal muscle is the largest organ that contributes to approximately 40% of the whole-body,20 which is the major organ secreting myokines21 and correlates with muscle strength.22 Exhaustive exercise is known to stimulate expression of myokines, which may improve glucose homeostasis and prevent metabolic dysfunction.23 The decrease of circulating apelin level in obese subjects compared to lean has been reported,24 suggesting that low apelin level can be used as one of the markers for obesity and metabolic dysfunction.4 Regular exercise is known to increase apelin secretion, but apelin secretion after an acute exhaustive exercise remains poorly defined. In the present study, we analyzed exercise-induced circulating apelin secretion and its correlation with body composition, metabolic status and physical fitness of participants.
The main finding was that a single bout of exhaustive exercise elevated circulating apelin level, which was dependent upon skeletal muscle mass, insulin resistance (HOMA-IR), and insulin secretion (HOMA-%B) of healthy and overweight/obese adults. In addition, following exercise, the changes of circulating apelin level were gender dependent. A positive correlation between apelin secretion during exercise and upper/lower body strength were found, but not in cardiorespiratory function such as maximal oxygen uptake (VO2max), showing that exercise-induced apelin secretion might be dependent on muscle mass and function. In addition, we found the significant correlation between skeletal muscle mass and strength (Supplementary Table 3, Appendix A). The finding of acute exercise is effective in elevating the apelin level suggests that even limited exercise could be beneficial for overweight/obese adults. In the meanwhile, blood collection was performed before physical fitness test in the present study in order to collect a steady state of blood, which may affect to the results by this test.
Obese adults have higher body mass, fat mass, and percent fat, and lower lean mass compared to lean control adults,4,25 which are consistent with our analyses of basic characteristics between overweight/obese and lean women and men. Initially, although we expected that there was a correlation between plasma apelin level and BMI following exercise based on the pilot study, the correlation between apelin and BMI after exercise was not found (r=0.118, P=0.370). Low maximal oxygen uptake was further reported in response to the increase of percent fat mass.26 On the other hand, no correlation of cardiorespiratory function and physical strength was observed in the present study.
Myokines secreted from skeletal muscle during contraction have been considered as mediators with endocrine, paracrine, and autocrine actions.21 Skeletal muscle mass is one of the quantitative factors correlated with myokine secretion.21 In this present study, there was a positive correlation between increased apelin level after exercise and muscle mass, though such association was absent before exercise. These data suggest that apelin secretion might be primarily stimulated by contraction.27 Meanwhile, apelin level in circulation might be influenced by other organs such as heart,28 adipose tissue,29 and liver,30 which may also secrete low levels of apelin. The effects of exercise in the plasma apelin level differed between genders, being more effective to overweight/obese men than lean men, but less effective to women with/without obesity, which could be related to the compensatory effect associated with obesity,13 and high muscle mass and contraction strengthen in men compared to women, which was additionally confirmed in different strength between gender at the present study (Table 1). Alternatively, the hormone dysregulation in menopause women might affect the amount of plasma apelin level (3 menopause women in healthy adults and 1 menopause woman in overweight/obese adults). It has been reported that apelin is negatively correlated with insulin resistance and elevated glucose level.31 On the other hand, in our study, exercise-induced increase in circulating apelin level was positively associated with insulin resistance measured by HOMA-IR, which might be due to hyperglycemia after acute exercises.32 The circulating lactate level of both gender was elevated due to exercise, suggesting the biological effects of an exhaustive exercise to all participants. Although the lactate level of men was higher than that of women after exercise (P<0.001), no difference of intensity in subjective feeling is found based on the rated of perceived exertion (RPE), suggesting that the higher muscle mass or strengthen in men compared to women might be a contributing factor.
The elevation of apelin after exercise was correlated with the upper and lower body muscle strength that includes muscle power (isokinetic 60°/s) and muscle endurance strength (isokinetic 240°/s), indicating that exercise-induced apelin is correlated with muscle strength. In addition, the hand grip strength is associated with the lower body strength, suggesting that the hand grip strength represents the whole-body strength.
In summary, the present study shows that apelin secretion following an exhaustive acute exercise is associated with muscle mass, insulin sensitivity, and physical fitness in overweight/obese adults. An acute exercise elevated apelin level and improved metabolic parameters more profoundly in overweight/obese men compared to lean men, while such effects were much weaker for women regardless of obese status. Thus, the beneficial effects of apelin expression followed by a single bout of exhaustive exercise might be dependent on gender and metabolic states of the subjects.
AbbreviationsApelin, ligand of a G-protein-coupled receptor; APJ, putative receptor protein related to AT1; IPAQ, International Physical Activity Questionnaire; DXA, dual-energy X-ray absorptiometry; VO2max, maximal oxygen consumption; RPE, rated perceived exertion; HOMA-IR, homeostatic model assessment of insulin resistance; HOMA-%B, homeostatic model assessment of insulin secretion; LDH, lactate dehydrogenase; CK, creatine kinase; BMI, body mass index.
Conflict of interestsThe authors declare no conflict of interests.
Author contributionsW.S. planned and designed the study with contribution from J.S.S. The authors participated in the collection (J.S.S. and S.A.C.) and interpretation (J.S.S., S.A.C., M.D., and W.S.) of the data. J.S.S. was involved in the writing, and M.D. and W.S. reviewed and edited the manuscript. B.I.P. further reviewed the manuscript. All authors contributed final approval and agreed to be accountable for all aspects of the work.
The authors would like to thank Health and Exercise Science Laboratory. This work was supported by the National Research Foundation of Korea (NRF) and funded by the Ministry of Science, ICT and Future Planning (NRF-2013M3A9B6046417, Korea Mouse Phenotyping Project NRF-2013M3A9D5072550) and KINDS Co. In addition, the work was partially funded by NIHR01HD067449.
The following are the supplementary data to this article:
