


Adequate nutritional assessment is required to fight malnutrition (undernutrition and overfeeding) in children and adolescents. For this, joint interpretation of certain indicators (body mass index [BMI], height, weight, etc.) is recommended. This is done clinically, but not epidemiologically. The aim of this paper is to present “nutrimetry”, a simple method that crosses anthropometric information allowing for bivariate interpretation at both levels (clinical and epidemiological).
Materials and methodsData from 41,001 children and adolescents aged 0–19 years, taken from Mexico's National Health and Nutrition Survey 2012, were analyzed. Data crossed were BMI-for-age Z-scores (BAZ) with height-for-age Z-scores (HAZ) according to the World Health Organization (WHO) standards. Conditional prevalences were calculated in a 3×3 grid and were compared with expected values.
ResultsThis method identified subgroups in each BAZ category showing heterogeneity of the sample with regard to WHO standards for HAZ and nutritional status. According to the method, nutritional status patterns differed among Mexican states and age and sex groups.
ConclusionNutrimetry is a helpful and accessible tool to be used in epidemiology. It allows for detecting unexpected distributions of conditional prevalences, its graphical representation facilitates communication of results by geographic areas, and enriched interpretation of BAZ helps guide intervention actions according to their codes.
Para combatir la malnutrición (desnutrición y sobrealimentación) en los niños y adolescentes se necesita una evaluación nutricional adecuada, y para ello se recomienda interpretar conjuntamente ciertos indicadores (índice de masa corporal [IMC], talla, peso, etc.). Clínicamente esto se realiza, pero epidemiológicamente no. El objetivo de este trabajo es presentar la «Nutrimetría», un método simple que cruza información antropométrica permitiendo una interpretación bivariada en ambos niveles (clínico y epidemiológico).
Materiales y métodosSe analizaron datos de 41.001 niños y adolescentes de 0-19años derivados de la Encuesta Nacional de Salud y Nutrición 2012 de México. Se cruzó la información de la puntuación Z del IMC para la edad (Z-IMC) con Z de talla para edad (Z-talla) según estándares de la Organización Mundial de la Salud (OMS). Se calcularon prevalencias condicionales del cruce en una rejilla de 3×3 celdas y se comparó con lo esperable.
ResultadosSe identificaron subgrupos en cada categoría del Z-IMC que permitieron apreciar heterogeneidad de la muestra respecto a los estándares de la OMS en estatura y estado nutricional. Según este método, los patrones nutricionales diferían entre estados mexicanos, edades y sexos.
ConclusiónNutrimetría es una herramienta útil y accesible para ser usada en epidemiología. Permite detectar distribuciones inesperadas de las prevalencias condicionales, su representación gráfica facilita la comunicación de resultados por áreas geográficas y la interpretación enriquecida del Z-IMC ayuda a orientar sobre acciones de intervención de acuerdo a sus códigos.
Imbalances between food intake and nutritional requirements demand special attention in childhood, because they give rise to malnutrition (undernutrition or overfeeding) and health and developmental problems that are highly prevalent among children worldwide (stunted growth in 24.5%, insufficient weight in 15%, emaciation in 7.7% and overweight in 6.3%).1
In Mexico, the prevalence of undernutrition is low in terms of insufficient weight (2.8%) and emaciation (1.6%), though the 1.5 million children (13.6%) with stunted growth continue to pose a public health challenge. Although the prevalence of overweight and obesity in children and adolescents has decreased, the problem remains: 9.8% in infants under 5years of age, 34.4% in children between 5 and 11years of age, 35% in adolescents between 12 and 19years of age, and 69.4–73.0% in individuals over 20years of age.2
In the face of this scenario, Mexico has adopted initiatives such as the Integral Nutritional Care Strategy (Estrategia Integral de Atención a Nutrición [EsIAN]), the National Crusade Against Famine (Cruzada Nacional Contra el Hambre), the National Strategy Against Obesity and Diabetes (Estrategia Nacional contra la Obesidad y Diabetes) and the taxing of fast/junk food and drink, in line with the maternal, nursing infants and small children nutrition plan of the World Health Organization (WHO). This plan focuses on the development of nutrition policies and programs around the world, monitored by means of indicators including the body mass index (BMI), which is used in 5 (reduction of stunted growth, anemia, low birth weight, overweight and emaciation) of its 6 objectives.3
Excluding periods of accelerated body growth, the BMI (kg/[height in m]2), described in 1832 by Quetelet, shows that body growth normally increases as a function of the square of body height. In 1972 it was demonstrated that it exhibited strong correlations to independent measures of body fat. This led to its widespread use in defining obesity in adults.4
With the increase in infant body weight, and after it had been demonstrated that BMI adjusted for age and gender is a good indicator of adiposity in children, different groups developed their own reference values. For example, the International Obesity Task Force developed curves for subjects between 2 and 18years of age to define overweight, obesity5 and thinness6; the Centers for Disease Control and Prevention established percentile tables for subjects between 2 and 20years of age in order to identify low weight, overweight and its risks,7 and the WHO profiles describe ideal growth in infants (0–5years),8 children and adolescents (5–19years) in terms of Z-scores.9 Although these reference values differ, they offer practical tools for nutritional monitoring and screening.
The BMI is an indirect measure of body fat and unhealthy body weight10 that is easy to calculate and interpret, and is used to estimate the prevalence of childhood obesity and to complement the evaluation of nutritional status in populations.9 However, since the BMI is a corpulence indicator, not exclusively an adipose tissue indicator, it lacks sensitivity11; it does not give precise information about underlying body composition; it is unable to differentiate between individuals sharing the same BMI value but with different physical or health conditions12 or other parameters; and it does not help us to understand the true relationship among the causes, health and the most appropriate treatment in clinical practice.
Alternative methods have been developed to overcome these shortcomings, though they have not been widely applied, since some of them, such as the waist/hip ratio, show a lesser correlation to body fat percentage than the BMI-for-age Z-score (BAZ).13 Other indicators such as skin folds require time and considerable training if reliable measurements are to be obtained, while other more precise techniques such as total body electrical conductivity, air displacement plethysmography and dual energy X-ray absorptiometry are expensive and require specialized apparatuses that can be complex and inconvenient to use in small children,14 thereby precluding their large scale use in infants and in populations where resources are limited.
In the face of this situation, emphasis has been placed on the importance of the joint interpretation of the BAZ score with other health indicators. In this sense, although BAZ can be used in clinical practice, epidemiologically it is still only used on an isolated basis, creating a gap between the decisions made from population data analyses and what is seen in individual patient care. The present study describes Nutrimetry, a methodological approach based on two simple and accessible anthropometric variables – in this case the BAZ score and the height-for-age Z-score (HAZ) – that increases the usefulness of BAZ for epidemiological and clinical use.15,16 The study describes Nutrimetry and its application to a series of representative data of Mexican children and adolescents, with a view to demonstrating how this tool could be useful in population evaluations, the diagnosis of malnutrition, and in both public health policy and clinical decision making in the healthcare and educational setting.
MethodologyStudy sampleWe analyzed data from 20,550 males and 20,451 females between 0 and 19years of age derived from the National Health and Nutrition Survey 2012 (Encuesta Nacional de Salud y Nutrición 2012 [ENSANUT-2012]). Access to the information was requested from the National Public Health Institute (Instituto Nacional de Salud Pública [INSP]) through the portal: http://ensanut.insp.mx/basesdoctos.php#.VY2IO_l_Oko. Those in charge of the survey certified that all participants signed the corresponding informed consent; that their personal information was kept confidential by its not being made available on the supplied database; and that ENSANUT-2012 was approved by the Ethics Committee of the INSP of Mexico. The survey used multistage and stratified probabilistic sampling, with a home response rate of 87%.17
ProcedureNutrimetry is a method that makes possible the crossing of information corresponding to two anthropometric variables, with the purpose of facilitating their joint interpretation. Calculation is made by summing the weightings of both variables according to standard ranges.
This study applied Nutrimetry using the HAZ and BAZ Z-scores according to the standards of the WHO.8 These Z-scores were used to obtain a combined index with 9 categories referred to as the “Nutricode”. As can be seen in Fig. 1, one point was added to HAZ if the Z-score≤−2, five points if the Z-score≥2, and three points for the rest of the values. In the case of BAZ, zero was added if the Z-score≤−1, six if the Z-score≥1, and three points for the rest of the values.15 As a result, each observation was assigned one of the 9 possible codes: 1, 3, 4, 5, 6, 7, 8, 9 and 11, representing different diagnoses of nutritional status. The prevalence values for each category were displayed by means of a 3×3 grid (Fig. 1) for more convenient conceptual interpretation. The designation of values was made so that the normal levels of the horizontal variable always corresponded to even numbers, and the normal values of the vertical variable corresponded to multiples of three. In this way, even numbers 4, 6, 8 reflect healthy body weight; small odd numbers 1, 3, 5 indicate thinness; and large odd numbers 7, 9, 11 indicate overweight or obesity. In turn, numbers 3, 6, 9 represent normal height; numbers 1, 4, 7 are indicative of low height; and numbers 5, 8, 11 indicate tall height. It should be noted that each odd number code implies different health risks, depending on the interaction of the crossed variables.

The number of standard deviations used for BAZ was chosen because the WHO defines overweight in individuals between 5 and 19years of age from a Z-score≥+1. Furthermore, emaciation/thinness categories are associated with a relatively imminent risk of death; the detection of sub-populations in early risk stages therefore allows for the adoption of more effective preventive measures.
The HAZ and BAZ values were identified in ENSANUT-2012 according to WHO standards, and the estimations were made according to the design of the survey. Based on the conditional probability calculation for each code, we compared each value with respect to the expected value according to the normal distribution and some nearby intervals (see Appendix A). This made it possible to identify differences between what was observed in Mexico and what could be expected in a “normal” population of children according to WHO criteria, studying the geographic distribution according to states and gender, and plotting a graphic representation of the findings.
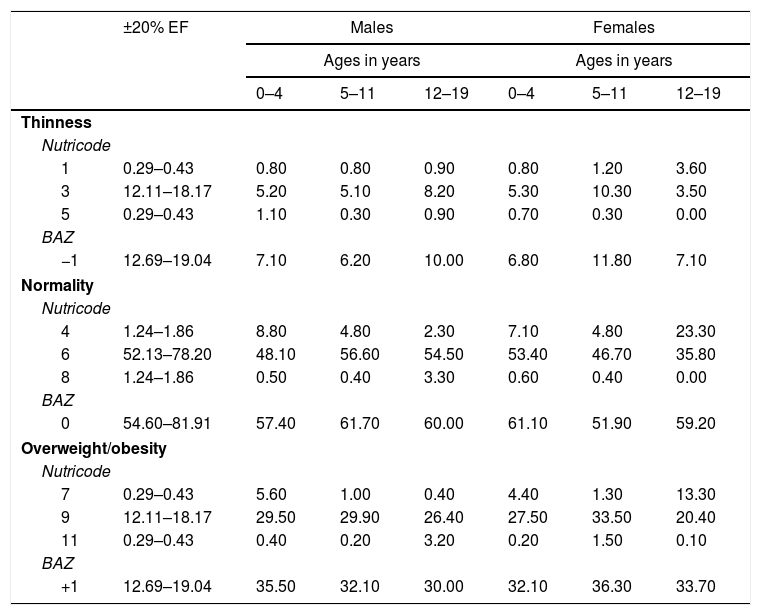
ResultsAn analysis was made of the differences between the observed and expected frequencies in all the Nutricodes, and statistical significance was observed in all cases (χ2(df 8)=100.33, p≤0.001). The prevalences according to Nutricode and BAZ in males and females divided into preschool infants (0–4years), schoolchildren (5–11years) and adolescents (12–19years), and their comparison versus the expected percentage, are reflected in Table 1.
Prevalence according to Nutricode for weight and height, and BMI Z-scores (BAZ). Data from ENSANUT-2012.
| ±20% EF | Males | Females | |||||
|---|---|---|---|---|---|---|---|
| Ages in years | Ages in years | ||||||
| 0–4 | 5–11 | 12–19 | 0–4 | 5–11 | 12–19 | ||
| Thinness | |||||||
| Nutricode | |||||||
| 1 | 0.29–0.43 | 0.80 | 0.80 | 0.90 | 0.80 | 1.20 | 3.60 |
| 3 | 12.11–18.17 | 5.20 | 5.10 | 8.20 | 5.30 | 10.30 | 3.50 |
| 5 | 0.29–0.43 | 1.10 | 0.30 | 0.90 | 0.70 | 0.30 | 0.00 |
| BAZ | |||||||
| −1 | 12.69–19.04 | 7.10 | 6.20 | 10.00 | 6.80 | 11.80 | 7.10 |
| Normality | |||||||
| Nutricode | |||||||
| 4 | 1.24–1.86 | 8.80 | 4.80 | 2.30 | 7.10 | 4.80 | 23.30 |
| 6 | 52.13–78.20 | 48.10 | 56.60 | 54.50 | 53.40 | 46.70 | 35.80 |
| 8 | 1.24–1.86 | 0.50 | 0.40 | 3.30 | 0.60 | 0.40 | 0.00 |
| BAZ | |||||||
| 0 | 54.60–81.91 | 57.40 | 61.70 | 60.00 | 61.10 | 51.90 | 59.20 |
| Overweight/obesity | |||||||
| Nutricode | |||||||
| 7 | 0.29–0.43 | 5.60 | 1.00 | 0.40 | 4.40 | 1.30 | 13.30 |
| 9 | 12.11–18.17 | 29.50 | 29.90 | 26.40 | 27.50 | 33.50 | 20.40 |
| 11 | 0.29–0.43 | 0.40 | 0.20 | 3.20 | 0.20 | 1.50 | 0.10 |
| BAZ | |||||||
| +1 | 12.69–19.04 | 35.50 | 32.10 | 30.00 | 32.10 | 36.30 | 33.70 |
The Nutricodes represent different nutritional statuses referring to height and the BMI: 1=low HAZ+low BAZ; 3=normal HAZ+low BAZ; 5=high HAZ+low BAZ; 4=low HAZ+normal BAZ; 6=normal HAZ+normal BAZ; 8=high HAZ+normal BAZ; 7=low HAZ+high BAZ; 9=normal HAZ+high BAZ; 11=high HAZ+high BAZ.
The BAZ numbers represent: −1=BAZ≤−1z; 0=BAZ between ±1z; +1=BAZ≥+1z.
The column ±20% EF represents an interval of ±20% of the expected frequency in each code according to the conditional probability of the normal distribution of the variables.
With regard to the small odd number codes (1, 3 and 5), representing thinness, a relatively low prevalence was observed (0.0–10.3%), though with higher than expected values for codes 1 and 5; on pooling the data of the three codes (BAZ≤−1), we only found prevalence to be lower than expected (6.20–11.8%). With regard to the large odd number codes (7, 9 and 11), representing overweight/obesity, a higher prevalence was observed (0.10–33.50%), with the concentration of about 30% of the cases in code 9; on pooling these codes (BAZ≥1), prevalence was found to be 32.1–36.3%, which is approximately double the expected value in a normal distribution.
With regard to the even number codes representing healthy body weight, less than 3.3% corresponded to code 8, and 35.8–56.5% to code 6. In the case of code 4, adolescent males and females clearly differed (2.3% and 23.3%, respectively), while on pooling between ±1 BAZ, the prevalences only ranged between 51.9 and 61.7%, and were lower than expected.
On analyzing the codes according to HAZ, the tallest (codes 5, 8 and 11) yielded a prevalence of no more than 2.2%, with the exception of adolescent males (7.4%). In relation to low HAZ (codes 1, 4 and 7), prevalence was seen to be less than 9% during early infancy and childhood, though reaching 23.3% for code 4 and 13.3% for code 7 in adolescent females.
Lastly, normal HAZ (codes 3, 6 and 9), showed the highest concentration of children, particularly in code 6 (35.8–56.5%), followed worrisomely close by code 9 (20.4–33.5%).
In order to epidemiologically illustrate the application of Nutrimetry, Fig. 2 combines the prevalences for each code with the a priori probability of finding such values. There are 5 expectable categories of values for each code, as shown in the legend. If there is more than expected, the color is more intense, while if there is less than expected, the color is lighter. If the sample were to exhibit a normal distribution for both variables (BAZ and HAZ), the maps would be of intermediate intensity color. Codes 1, 5, 7 and 11, which combine the extreme Z-scores (tall-thin, tall-overweight, short-thin and short-overweight) are the ones where lower prevalences should be expected, followed by codes 4 and 8; 3 and 9; and 6.
 and males (blue) between 0 and 19years of age (ENSANUT, 2012).")
With regard to the codes with the lowest prevalences (1, 5, 7 and 11), most of the Mexican states present more short than tall women, with the exception of some northern states such as Chihuahua, Coahuila, Durango and Nayarit, where the four codes show similar prevalences. In the case of the males, the northern states such as northern and southern Baja California, Sonora, Sinaloa, Durango and Nayarit show higher prevalence for code 5 than for code 1, in contrast to what is seen in southern states such as Oaxaca and Chiapas.
With regard to normal BAZ codes 4 and 8, there are more tall males in the north and more short males in the south, while in the case of the females there is a greater prevalence of short versus tall individuals throughout the country.
In relation to codes 3 and 9, there is a notoriously greater prevalence of obese and average height males and females than of thin and average height individuals.
In general, among females an intense red color predominates throughout the country for codes 1, 4, 7 and 9. In turn, there are fewer females in code 6 than normal, and the prevalence is clearly less than expected in code 8. On the other hand, among males a dark blue color predominates throughout the country for codes 7, 9 and 11. In turn, there are more males in codes 1 and 4 than expected in the south, and a greater prevalence than expected in codes 5 and 8 in the north.
DiscussionNutrimetry offers more specific information than BAZ, and its use as a reference index in epidemiological studies allows us to describe and analyze the population distribution of malnutrition in greater detail among subgroups that cross two important anthropometric characteristics.
This is seen on noting that the prevalences of BAZ in Z “−1” and “0” are lower than expected according to the normal distribution, and those in Z “+1” are double. This draws attention toward the population at risk of overweight, and with overweight or obesity, whereas with Nutrimetry and its conditional distribution we furthermore detect that the low prevalences of BAZ “−1” are specifically found in those subjects with normal height (code 3) and in tall adolescent females (code 5). In contrast, there is a greater than expected distribution in short children of either gender (code 1) and in tall male adolescents and pre-school infants (code 5). These results indicate that although there are few children at risk of acute denutrition (code 3), stunted growth in children with BAZ≤−1 (code 1) is a persistent condition that needs to be addressed, particularly in females between 5 and 19 years of age.
In the case of the large odd number codes, the predominance of cases with respect to the expected values is found in the following codes: 9 for all groups; 7 for all groups except male adolescents; and 11 for schoolchildren and adolescent males. This indicates that in Mexico most male and female children and adolescents at risk of overweight (pre-school infants), overweight and obesity (schoolchildren and adolescents) are concentrated among those of average or short height. Furthermore, in males and females between 5 and 19years of age there is a tendency toward high BAZ in the presence of high HAZ. It is consequently postulated that there is a relationship between height and the BMI similar to that found in the United States, with tall individuals increasing their BMI faster than short individuals.18
Thus, code-based information, by allowing for the detection of specific data deviations, yielded values indicating an unexpected distribution of BAZ and HAZ in Mexican children, since a greater than expected prevalence was observed in codes 1, 4, 7, 9 and 11, with a slightly lower than expected prevalence in code 6. As this represents a large proportion of the total, it significantly affects the distribution, indicating that the average Mexican exceeds the standards of the WHO in terms of short height and overweight/obesity. This is consistent with the observations of other studies,15,19 and points to the need to investigate the existence of genetic, social and economic factors underlying this distribution in the Mexican population.
Moreover, by means of graphic representation, we are able to offer a tool allowing analysis according to geographic areas, codes and gender, as well as more effective reporting of the results. In effect, as can be seen in Fig. 2, it can be affirmed that in Mexico many children, particularly girls, are of short height (codes 1, 4 and 7) and are overweight/obese (codes 7, 9 and 11). Furthermore, in the central and northern states, boys and girls do not present stunted growth but nevertheless have low BAZ (code 5), while in the southern states (with the exception of Campeche) many males show low BAZ and HAZ (code 1).
The Nutrimetry results could act as a support for public health measures in terms of analyzing the impact of such interventions and/or by directing their strategies. For example, the higher than expected prevalence corresponding to code 1 indicates possible stunted growth associated with a persistently deficient diet and/or some disease condition hindering nutrient absorption.20 This underscores that the objectives have not yet been reached in all the states, and that programs designed to procure access to a sufficient, nutritious, and quality diet (e.g., food support, social supply of milk and nutrients) could represent an appropriate strategy.
Although the general prevalence in boys and girls corresponding to code 3 was lower than expected, according to the conditional prevalences—as would be expected on taking into account the national prevalence of emaciation19 –code5 still requires attention in the center and north of the country. Since thinness with a normal to high body stature (codes 3 and 5) indicates a recent alteration of nutritional status, the main underlying causes are possibly similar to those of acute undernutrition, such as, for example, diseases causing losses, increased metabolic demand or inadequate diet21 (e.g., eating disorders). Therefore, and given the success of the control of diarrheic disorders and acute respiratory infections in the infant population,19 it seems advisable to examine these prevalences with reference to eating disorders, the risk of which increased 0.5% in the period 2006–2012.19 Furthermore, and independently of the cause, it is advisable for interventional programs targeted to this population to contemplate immediate initial treatment seeking to stabilize the child and identify any life-threatening condition; a rehabilitation phase to incrementally increase energy and nutrient intake; a follow-up phase involving the patient and family in order to avoid relapses; continuous dietetic orientation; and psychological attention for eating disorders.
With regard to the codes indicating overweight and obesity, high prevalences in children of both genders were observed throughout Mexico (code 7). On the other hand, in the northern, central and western states the prevalence of high BAZ in tall girls (code 11) was greater than in the rest of the country.
The probable causes of overweight with stunted growth (code 7) observed in the south-western states range from the intake of high-calorie foods that are low in nutrients and which affect weight gain22 to recurrent infections23 and the diagnosis of endocrine disease.24 On the other hand, the causes of low body stature are highly varied (e.g., low family height, genetic syndromes, heart disease, kidney disease, intestinal disorders, socioeconomic factors25,26), and the recurrent high prevalence of low body stature in Mexico15,19 could even indicate the existence of a genetic trait in the population. It is therefore necessary to consider the diagnosis of concomitant diseases and familial hereditary antecedents in order to plan interventions targeted to this code. This will help us to decide whether only to address the problem of overweight or whether we also need to compensate for dietetic defects, or treat diseases or hormone defects (though these are scantly prevalent) hindering the development of body height. At the same time, care is required not to induce or promote the development of overweight/obesity, since it has been demonstrated that there are mechanisms that favor rapid weight gain in children with stunted growth due to malnutrition.27
In the northern, central and western states of the country, tall and overweight children are more likely to become obese adults than those children of high or average body stature but with normal weight.28 Furthermore, it has been hypothesized that tall individuals raise their BMI faster as a result of easier access to large amounts of high-calorie foods, their scant capacity to precisely judge food portions in terms of their real body needs, and inadequate attention to the experience of satiety.18 Therefore, the effects of interventions which focus on nutritional education need to be explored, with training to recognize satiety, self-regulation of the energy balance, and the selection of foods. In addition, more rigorous regulations are recommended regarding food portion sizes, together with the offering of healthy options.
The results indicate that interventions targeted to the overweight and obese population have not been sufficient as a national strategy, and could be complemented by further preventive measures such as the creation of environments that promote healthy lifestyles, as well as the reinforcement and implementation of effective interventions such as food education and physical activity in the school setting,29 involving both the family and the community.30
In this way, Nutrimetry can be used in scenarios which involve the integral development of the child, such as schools and healthcare centers. In this regard, it not only enriches BAZ and is easy to explain and understand, but moreover uses neutral language that avoids stigmatization of the individual by suppressing terms such as “fat” or “thin”. Furthermore, the results are reported as numbers that orientate toward specific actions seeking to shift individuals classified under “odd number” codes toward “even number” codes, facilitating communication of the results and objectives to the children and adolescents, without any emotional semantic burden being attached.
It can be concluded that although Nutrimetry as used herein, in the same way as BAZ, cannot obviate other measurements affording precise orientation with regard to body composition, it allows for a broader use at the same cost. In effect, Nutrimetry represents a methodology which allows for the integration of information concerning two anthropometric variables which in themselves are measures for obtaining BAZ, and their processing requires no specialized software. Furthermore, Nutrimetry makes it possible for this information to be analyzed at the epidemiological level in a collaborative manner, thus facilitating its diffusion and promoting coherence between public policies and clinical actions. It moreover constitutes a viable option for individual diagnosis in conjunction with other body composition measures, and for screening, prevention, intervention and the establishing of goals in school, clinical and epidemiological scenarios. In addition to being accessible and easy to apply, Nutrimetry complies with WHO criteria defining an adequate anthropometric indicator,20 since it uses the WHO growth standards of 2006 for purposes of interpretation; this means that it possesses standards based on a broad, healthy and representative sample. Furthermore, it identifies individuals and populations who present different types of risk, allows for the designing of specific interventions to avoid unnecessary treatments, and supports the evaluation of nutritional change.8
Lastly, Nutrimetry allows us to obtain codes that are easy to interpret, and which are potentially related to specific nutritional conditions. The present study has described some theoretical relationships between codes and conditions, based on existing information. It, in turn, both provides the basis for empirical study, and suggests fields of further research into the specific risks that can give rise to each code.
Ethical statementThe authors obtained access to the data of the Mexican National Health and Nutrition Survey 2012 (Encuesta Nacional de Salud y Nutrición 2012) through the National Public Health Institute (Instituto Nacional de Salud Pública [INSP]). Those in charge of the survey certify that all participants signed the corresponding informed consent before the survey, and that ENSANUT-2012 and the informed consent were approved by the Ethics Committee of the INSP of Mexico. The privacy of the participants has been guaranteed in this document, since there is no identifying information in the accessed database. The authors moreover declare that no data capable of identifying the participants appear in this article.
AuthorshipSelem-Solís, Jorge Enrique: Conception of the method, data acquisition, literature search, review of the manuscript draft, critical review of the intellectual contents and final approval of the document.
Alcocer-Gamboa, Alberto: Study design, conception of the method, critical review of the intellectual contents and final approval of the document.
Hattori-Hara, Mónica: Data analysis, interpretation of the results, design of the figures, literature search for antecedents and discussions, drafting of the manuscript and final approval of the document.
Esteve-Lanao, Jonathan: Study design, conception of the method, critical review of the intellectual contents and final approval of the document.
Larumbe-Zabala, Eneko: Study design, conception of the method, statistical analyses, interpretation of the results, map design, literature search, critical review of the intellectual contents and final approval of the document.
Conflicts of interestNone.
Please cite this article as: Selem-Solís JE, Alcocer-Gamboa A, Hattori-Hara M, Esteve-Lanao J, Larumbe-Zabala E. Nutrimetría: evaluando el IMC en función del desarrollo. Endocrinol Diabetes Nutr. 2018;65:84–91.
All the points of view expressed herein are the responsibility of the authors, and do not necessarily reflect the official position of the institutions they represent.

articles