


In epidemiological studies, excess body fat (BF) has been associated with cardiometabolic risk factors, some types of cancer, and other causes of death. A new anthropometric method has been defined: The CUN-BAE index (University of Navarra Clinic-Body Fat Estimator), which is based on BMI, sex, and age. BMI and CUN-BAE index were used to assess their contribution to mortality risk from any cause in the Asturias Study cohort.
Material and methodsThe Asturias Study is a cohort study including 1.034 individuals aged 30–75 years who participated in the first study phase (1998–1999). The study included a clinical survey, physical examination, and an oral glucose tolerance test. Vital status was determined in the cohort after 18 years of follow-up.
ResultsTwo hundred and four subjects died: 93 females and 111 males (16.6% females and 23.5% males). Baseline values of both BMI and %BF suggesting obesity (BMI>30kg/m2 and CUN-BAE >25% in males and >35% in females) were found in most subjects. After adjusting for T2DM, HBP, CVD, and tobacco, the risk of all-cause and cardiovascular mortality was significantly higher as CUN-BAE increased, especially in females.
ConclusionsThe CUN-BAE equation is a useful tool, especially in females, to detect those who will have a greater risk of mortality, regardless of cardiovascular risk factors.
Conocemos que el exceso de grasa corporal (GC) se asocia con factores de riesgo cardiovascular, algunos tipos de cáncer y otras causas principales de muerte. Se ha definido un nuevo método antropométrico: el índice CUN-BAE (Clínica Universidad de Navarra-Estimador de Adiposidad Corporal), que se basa en el IMC, el sexo y la edad. Hemos utilizado IMC y CUN-BAE para evaluar su contribución en la asociación con mortalidad en la cohorte del Estudio Asturias.
Material y métodosEl Estudio Asturias se trata de un estudio de cohortes que incluyó a 1.034 individuos de 30-75años de edad que participaron en la primera fase del estudio (1998-1999), realizando encuesta, exploración física y sobrecarga oral de glucosa. Se registraron los fallecimientos en la cohorte tras 18años de seguimiento.
Resultados204 personas fallecieron: 93 mujeres y 111 varones (16,6% de las mujeres y 23,5% de los varones). Valores basales tanto de IMC como de %GC determinantes de obesidad (>30kg/m2 para IMC; >25% en hombres y >35% en mujeres para CUN-BAE) fueron mayoritarios en los datos de individuos fallecidos. Tras ajuste por DM2, HTA, ECV y tabaco, el riesgo de mortalidad por todas las causas y cardiovascular es significativamente mayor según se incrementa el CUN-BAE, sobre todo en mujeres.
ConclusionesLa ecuación CUN-BAE es una herramienta útil en mujeres para detectar las que van a presentar un mayor riesgo de mortalidad, independientemente de factores de riesgo.
The measures most commonly used in the general population to define excess body fat (BF) are the body mass index (BMI) and waist circumference (WC). The BMI has several limitations that complicate its use in certain population subgroups, and it probably does not reflect all the problems related to BF.
Epidemiological studies and clinical research use a number of instruments as anthropometric measures of BF, such as WC, height-related body weight or the BMI (kg/m2).1 The BMI is the most common means of assessing both overweight and obesity. There are limitations in this regard, however, such as the failure to take into account characteristics that condition variations in percentage BF such as sex, age or race,2,3 as well as the classification of people with high muscle mass as being overweight or obese.4 In this respect, a number of new adiposity estimators are recognized as offering a more reliable estimate, including the body adiposity index (BAI)5 and the Clínica Universitaria de Navarra Body Adiposity Estimator (CUN-BAE) index.6 The BAI was previously evaluated in a Norwegian population based on hip circumference and height.7 This index showed a good overall correlation to percentage BF (%BF) of the population, except when males and females were evaluated separately, possibly because of the better correlation between hip circumference and %BF in women than in men. In addition, the BAI substantially underestimated %BF in obese and overweight individuals (>25kg/m2).
The index on which the present study focuses is the CUN-BAE, which is based on patient age, sex and the BMI.6,8 This index was developed following the compilation of anthropometric data from 6510 individuals aged 18–80 years, and showed a strong correlation to %BF as measured by air displacement and plethysmography, compared with other anthropometric measures.6 In this same study, the authors reported similar results in a different cohort of Caucasian men and women between 17 and 76 years of age (n=1149). In addition, the CUN-BAE index better correlated with cardiovascular risk factors than the BMI and WC in a third group of 634 Caucasian men and women.
This growing interest in estimating BF is fundamentally attributable to the association between BF and chronic disorders such as type 2 diabetes mellitus (DM2), cardiovascular disease (CVD) and cancer.9,10 Accordingly, the clinical usefulness of this parameter largely depends on its ability to predict morbidity and mortality related to obesity. Studies have already been made of the associations between the CUN-BAE index and CVD risk markers and the odds ratio (OR) of hypertension in DM2.11,12 Moreover, this index has been shown to be more closely associated with the subsequent development of DM2 and CVD than the BMI in gender stratified analyses.13 However, no data are available on the association of the CUN-BAE index with mortality risk.
The purpose of the present study was to assess the association of the CUN-BAE index with mortality from all causes in the Asturias Study cohort and to compare it with the estimate afforded by the BMI.
Material and methodsThe Asturias StudyThe Asturias Study is a prospective population-based cohort trial on diabetes mellitus (DM) and cardiovascular risk factors centered on the global population of the province of Asturias (Spain).14,15 The first phase was conducted in 1998–1999 to determine the prevalence of both confirmed and unconfirmed DM2 and of prediabetes in the above-mentioned population. In 1998, Asturias had a population of 1,073,761 inhabitants, most of whom were of Caucasian origin. Approximately half of the population lived in urban areas. A two-stage cluster sampling technique was used for sample selection: 15 basic health areas (BHAs) of the 76 found in Asturias were randomly selected, with a probability proportional to the number of health cards of the individuals between 30 and 75 years of age in each area.
Subsequently, 125 individuals from each BHA were randomly selected using a software application. The final sample consisted of 1875 individuals; 87 people were excluded for various reasons (type 1 diabetes mellitus, pregnancy, severe illness, hospitalization, treatment with glycemia-elevating drugs). A further 162 were excluded due to a lack of contact information. The final sample thus comprised 1626 individuals, of which 1034 participated in the study (63.6%).
The trial was approved by the Ethics Committee of the Health Service of the Principality of Asturias, and all individuals gave their informed consent.
The participating subjects underwent a health survey including demographic data, smoking habit, physical activity, socioeconomic status and any family history of diabetes.
All the subjects, except those diagnosed with diabetes, underwent an oral glucose tolerance test (OGTT), with venous blood sampling at baseline and at two hours, according to the recommendations of the World Health Organization (WHO). The criteria of the American Diabetes Association (ADA 2018)16 were used to define the existence of diabetes at that time.
Anthropometric measures and calculation of indicesHeight, weight and the BMI (weight in kilograms divided by the square of height in meters) were measured with the subject in light clothing and without shoes.
Overweight and obesity were defined according to the WHO definition as a BMI 25–29.9 and ≥30kg/m2, respectively.
The CUN-BAE was calculated as −44.988+(0.503×age)+(10.689×sex)+(3.172×BMI)−(0.026×BMI2)+(0.181×BMI×sex)−(0.02×BMI×age)−(0.005×BMI2×sex)+(0.00021×BMI2×age), where males=0 and females=1 with respect to sex, and measuring age in years.6
The following classifications were used to stratify the subjects into the different overweight and obesity categories:
- •
CUN-BAE:
- ∘
Male population: <20% normal weight, 20–25% overweight, >25% obesity.
- ∘
Female population: <30% normal weight, 30–35% overweight, >35% obesity.
- •
BMI:
- ∘
Both sexes: 18–25kg/m2 normal weight, 25–30kg/m2 overweight, >30kg/m2 obesity.
In December 2016, the vital status of the initial cohort (studied in 1998–1999) was updated, after 18 years of follow-up. Deaths were recorded from the data of the health card of the Principality of Asturias. In the case of participants not living in Asturias, use was made of the database provided by the Spanish National Statistics Institute.
The cause of death was determined from our mortality registry. All deaths were coded according to the ICD-10 (WHO) code.17 Codes I00-I99 (cardiovascular diseases) or R96 (sudden death, unknown cause) are considered to be included within cardiovascular mortality because sudden death is generally attributable to CVD.18 Codes C00-D48 defined death due to cancer.
Statistical analysisAll calculations were performed using the SPSS version 21.0 statistical package. The reported p-values were based on a two-tailed test, with statistical significance being considered for p<0.05. Cox regression analysis was used to analyze the corresponding hazard ratios (HRs) of death, adjusted for age and the presence of diabetes, a history of prior CVD, smoking and a history of arterial hypertension in both the male and female groups.
Multivariate/univariate regression analysis was used to assess differences between groups based on the characteristics analyzed.
Sensitivity and specificity tables were generated for different cut-off points referring to the BMI and %BF according to the CUN-BAE, independently in men and women, with subsequent plotting in the form of receiver operating characteristic (ROC) curves. The best cut-off point was defined as that closest to the upper left angle of the ROC curve. An area of 1.0 was taken to be indicative of perfect discrimination, while an area of 0.50 indicated no discrimination.19
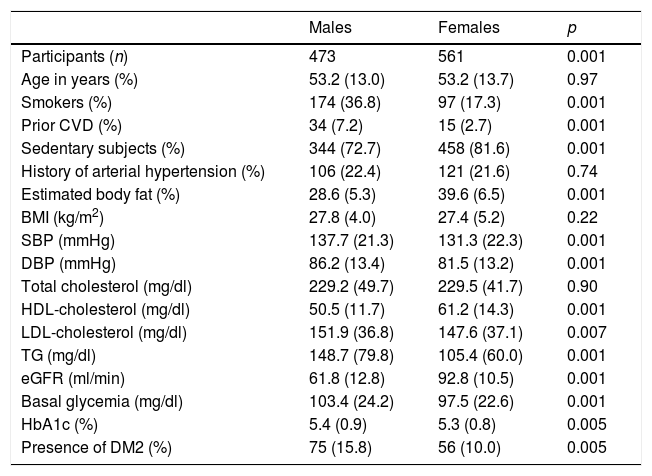
ResultsStudy characteristicsThe initial study population (1034 individuals) consisted of 561 women and 473 men. Males had a greater prevalence of CVD, smoking and diabetes (Table 1).
Cardiovascular and metabolic risk parameters according to sex during the first phase of the study (1998–1999).
| Males | Females | p | |
|---|---|---|---|
| Participants (n) | 473 | 561 | 0.001 |
| Age in years (%) | 53.2 (13.0) | 53.2 (13.7) | 0.97 |
| Smokers (%) | 174 (36.8) | 97 (17.3) | 0.001 |
| Prior CVD (%) | 34 (7.2) | 15 (2.7) | 0.001 |
| Sedentary subjects (%) | 344 (72.7) | 458 (81.6) | 0.001 |
| History of arterial hypertension (%) | 106 (22.4) | 121 (21.6) | 0.74 |
| Estimated body fat (%) | 28.6 (5.3) | 39.6 (6.5) | 0.001 |
| BMI (kg/m2) | 27.8 (4.0) | 27.4 (5.2) | 0.22 |
| SBP (mmHg) | 137.7 (21.3) | 131.3 (22.3) | 0.001 |
| DBP (mmHg) | 86.2 (13.4) | 81.5 (13.2) | 0.001 |
| Total cholesterol (mg/dl) | 229.2 (49.7) | 229.5 (41.7) | 0.90 |
| HDL-cholesterol (mg/dl) | 50.5 (11.7) | 61.2 (14.3) | 0.001 |
| LDL-cholesterol (mg/dl) | 151.9 (36.8) | 147.6 (37.1) | 0.007 |
| TG (mg/dl) | 148.7 (79.8) | 105.4 (60.0) | 0.001 |
| eGFR (ml/min) | 61.8 (12.8) | 92.8 (10.5) | 0.001 |
| Basal glycemia (mg/dl) | 103.4 (24.2) | 97.5 (22.6) | 0.001 |
| HbA1c (%) | 5.4 (0.9) | 5.3 (0.8) | 0.005 |
| Presence of DM2 (%) | 75 (15.8) | 56 (10.0) | 0.005 |
DM2: type 2 diabetes mellitus; CVD: cardiovascular disease; eGFR: estimated glomerular filtration rate; HbA1c: glycosylated hemoglobin; HDL: high density lipoprotein; AHT: arterial hypertension; BMI, body mass index; LDL: low density lipoprotein; DBP: diastolic blood pressure; SBP: systolic blood pressure; TG: triglycerides.
Values reported as the mean; in parentheses, standard deviation or number (percentage).
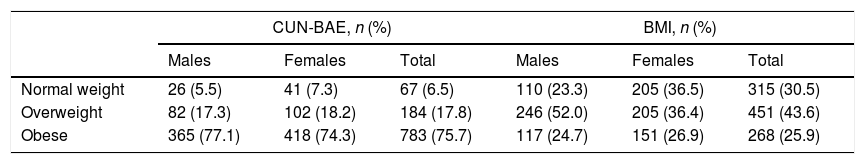
The estimation of BF according to the CUN-BAE was expressed as the mean (standard deviation [SD]): 39.60% (±6.5) in women and 28.6% (±5.6) in men. In all, 76.7% of the men were overweight or obese (BMI>25kg/m2), as compared to 63.3% of the women. On using the CUN-BAE estimate, this percentage was seen to increase to over 90% in both sexes (Tables 2 and 3).
Classification as normal weight, overweight or obese according to the CUN-BAE index and the BMI.
| CUN-BAE, n (%) | BMI, n (%) | |||||
|---|---|---|---|---|---|---|
| Males | Females | Total | Males | Females | Total | |
| Normal weight | 26 (5.5) | 41 (7.3) | 67 (6.5) | 110 (23.3) | 205 (36.5) | 315 (30.5) |
| Overweight | 82 (17.3) | 102 (18.2) | 184 (17.8) | 246 (52.0) | 205 (36.4) | 451 (43.6) |
| Obese | 365 (77.1) | 418 (74.3) | 783 (75.7) | 117 (24.7) | 151 (26.9) | 268 (25.9) |
CUN-BAE: Clínica Universidad de Navarra-Body Adiposity Estimator; BMI: body mass index.
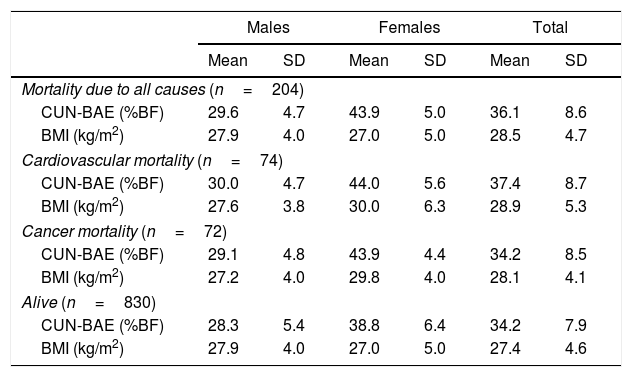
Anthropometric characteristics according to the vital status of the population.
| Males | Females | Total | ||||
|---|---|---|---|---|---|---|
| Mean | SD | Mean | SD | Mean | SD | |
| Mortality due to all causes (n=204) | ||||||
| CUN-BAE (%BF) | 29.6 | 4.7 | 43.9 | 5.0 | 36.1 | 8.6 |
| BMI (kg/m2) | 27.9 | 4.0 | 27.0 | 5.0 | 28.5 | 4.7 |
| Cardiovascular mortality (n=74) | ||||||
| CUN-BAE (%BF) | 30.0 | 4.7 | 44.0 | 5.6 | 37.4 | 8.7 |
| BMI (kg/m2) | 27.6 | 3.8 | 30.0 | 6.3 | 28.9 | 5.3 |
| Cancer mortality (n=72) | ||||||
| CUN-BAE (%BF) | 29.1 | 4.8 | 43.9 | 4.4 | 34.2 | 8.5 |
| BMI (kg/m2) | 27.2 | 4.0 | 29.8 | 4.0 | 28.1 | 4.1 |
| Alive (n=830) | ||||||
| CUN-BAE (%BF) | 28.3 | 5.4 | 38.8 | 6.4 | 34.2 | 7.9 |
| BMI (kg/m2) | 27.9 | 4.0 | 27.0 | 5.0 | 27.4 | 4.6 |
CUN-BAE: Clínica Universidad de Navarra-Body Adiposity Estimator; BMI: body mass index.
Over 18 years of follow-up, a total of 204 individuals (16.6% of the women and 23.5% of the men) died. Baseline values of both the BMI and %BF indicative of obesity (>30kg/m2 for the BMI and >25% in men and >35% in women for CUN-BAE) were more prevalent in the data of the deceased individuals (Table 3).
The coefficient of determination between the BMI and CUN-BAE was R2=0.67, and improved when sex and age were included in the equation (R2>0.90).
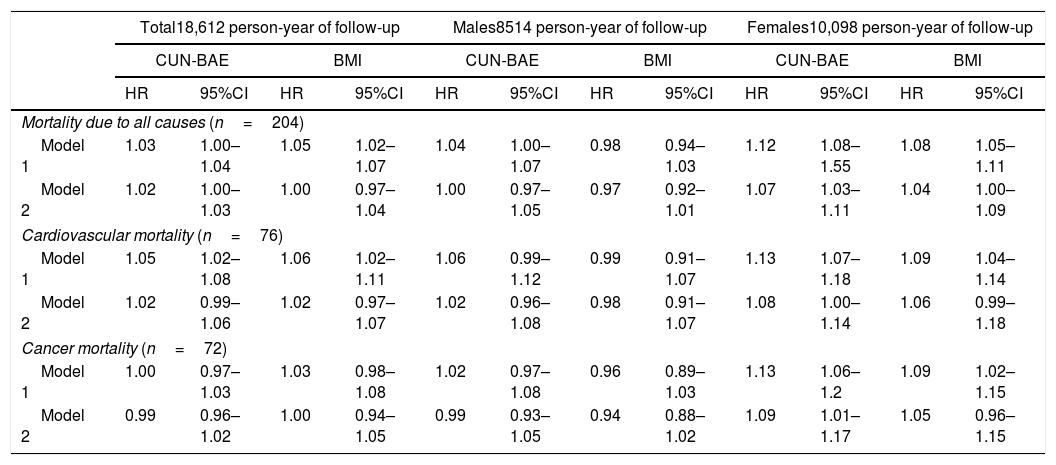
Table 4 shows the HR for death due to all causes and for cardiovascular and cancer mortality, corresponding to a 1% increase in the BMI or CUN-BAE at the start of the study in the analyses, before (model 1) and after adjustment (model 2) for smoking habit, any history of arterial hypertension, the presence of diabetes and prior CVD, added to age (and sex in analyses of the total population).
Hazard ratios and 95%CI for death due to all causes and specific cardiovascular and cancer mortality by 1% ranges in the BMI and the CUN-BAE index at baseline in the population of the Asturias Study (data obtained in 1998).
| Total18,612 person-year of follow-up | Males8514 person-year of follow-up | Females10,098 person-year of follow-up | ||||||||||
|---|---|---|---|---|---|---|---|---|---|---|---|---|
| CUN-BAE | BMI | CUN-BAE | BMI | CUN-BAE | BMI | |||||||
| HR | 95%CI | HR | 95%CI | HR | 95%CI | HR | 95%CI | HR | 95%CI | HR | 95%CI | |
| Mortality due to all causes (n=204) | ||||||||||||
| Model 1 | 1.03 | 1.00–1.04 | 1.05 | 1.02–1.07 | 1.04 | 1.00–1.07 | 0.98 | 0.94–1.03 | 1.12 | 1.08–1.55 | 1.08 | 1.05–1.11 |
| Model 2 | 1.02 | 1.00–1.03 | 1.00 | 0.97–1.04 | 1.00 | 0.97–1.05 | 0.97 | 0.92–1.01 | 1.07 | 1.03–1.11 | 1.04 | 1.00–1.09 |
| Cardiovascular mortality (n=76) | ||||||||||||
| Model 1 | 1.05 | 1.02–1.08 | 1.06 | 1.02–1.11 | 1.06 | 0.99–1.12 | 0.99 | 0.91–1.07 | 1.13 | 1.07–1.18 | 1.09 | 1.04–1.14 |
| Model 2 | 1.02 | 0.99–1.06 | 1.02 | 0.97–1.07 | 1.02 | 0.96–1.08 | 0.98 | 0.91–1.07 | 1.08 | 1.00–1.14 | 1.06 | 0.99–1.18 |
| Cancer mortality (n=72) | ||||||||||||
| Model 1 | 1.00 | 0.97–1.03 | 1.03 | 0.98–1.08 | 1.02 | 0.97–1.08 | 0.96 | 0.89–1.03 | 1.13 | 1.06–1.2 | 1.09 | 1.02–1.15 |
| Model 2 | 0.99 | 0.96–1.02 | 1.00 | 0.94–1.05 | 0.99 | 0.93–1.05 | 0.94 | 0.88–1.02 | 1.09 | 1.01–1.17 | 1.05 | 0.96–1.15 |
CUN-BAE: Clínica Universidad de Navarra-Body Adiposity Estimator; HR: hazard ratio; CI: confidence interval; BMI: body mass index.
Model 1: unadjusted analysis; Model 2: analysis adjusted for smoking, any history of arterial hypertension, previous cardiovascular disease and the presence of diabetes mellitus, age (and sex in the case of stratified analysis) being added for the BMI.
In the total population, the HR for death due to all causes was higher for the BMI than for CUN-BAE in the unadjusted model; however, after adjusting for the above factors, the HR was higher according to CUN-BAE (Table 4).
In terms of cardiovascular and cancer mortality, the HR proved similar in both model 1 and model 2 for both measures.
However, in the analysis stratified by sex, differences were found between the risks obtained with CUN-BAE and the BMI. In women, an increase in %BF was associated with an increased risk of cardiovascular mortality and death due to all causes. However, in males no such significant association was seen on applying model 2.
On applying model 2, a 1% increase in CUN-BAE in women was associated with an 8% increase in the risk of cardiovascular mortality. This did not apply to men, however (no statistical significance). On applying the BMI value, the risk decreased to 6% in women.
In all the studied categories, the pattern of results was quite similar for the BMI and CUN-BAE. However, on considering the global data of the total population applying model 2, the risk of cardiovascular mortality and death due to all causes was seen to increase significantly with increasing CUN-BAE, but not with an increasing BMI.
On comparing the associations of CUN-BAE in men versus women (in model 2), a more consistent association was obtained between an increase in both CUN-BAE and the BMI and a greater risk of cardiovascular mortality in women compared with men (1.08 and 1.06 in women versus 1.02 and 0.98 in men, respectively).
With regard to cancer mortality, a 1% increase in both the BMI and CUN-BAE was associated with an increase of approximately 9% in mortality attributable to cancer. This was not seen in men, however.
ROC curves and total mortalityThe analysis of the ROC curves (Fig. 1, table) showed %BF according to CUN-BAE to be more adequate than the BMI in determining mortality risk in both women and men, considering the criterion of the largest area under the curve (AUC) or the curve closest to the 100% sensitivity and specificity point.

Receiver operating characteristic curves comparing the association according to gender of the BMI and %BF according to the CUN-BAE with mortality due to all causes. The detailed data are presented in the table. CUN-BAE: Clínica Universidad de Navarra – Body Adiposity Estimator; HR: hazard ratio; CI: confidence interval; BMI: body mass index.
On choosing a %BF value according to CUN-BAE of close to 41% in women (sensitivity [Se]=74%; specificity [Sp]=72%) and 29.3% in men (Se=57.6%; Sp=57.1%), a better balance was obtained between sensitivity and specificity. For the BMI, the optimal values were 28.4kg/m2 in women (Se=68% and Sp=60%) and 27.1kg/m2 (Se=51% and Sp=51%) in men.
DiscussionAccording to our results, an increase in CUN-BAE was associated with a statistically significant increase in the risk of cardiovascular mortality and death due to all causes. However, on using the BMI as the estimator index, the mentioned association was no longer significant.
In addition, both the BMI and CUN-BAE (the latter being considered a better anthropometric predictor of mortality according to the area under the ROC curve) were established as useful tools for calculating the risk of total, cardiovascular and cancer mortality in Caucasian women.
The CUN-BAE index is essentially a measurement of the BMI that takes into account patient age- and sex-related differences in adiposity. Accordingly, since %BF is different in men and women with one same given BMI,20 the latter parameter measured at the same time as CUN-BAE was stratified by sex. As previously shown by Fuster-Parra et al.21 and Vinknes et al.,13 in the multiple regression models with %BF as the dependent variable, the BMI was found to be a good predictor of actual BF%, after adjusting for age and sex.
Despite the apparent redundancy between CUN-BAE and other BF estimator indices, the former is clearly useful in epidemiological studies where body composition data is unobtainable.
The association between obesity and the subsequent total and specific mortality risk has been widely investigated. Taking into account that the male sex is an independent risk factor for CVD22 and the known sexual dimorphism in %BF,20 studies linking obesity to CVD tend to perform sex-stratified analyses.23,24 In analyses by sex, the CUN-BAE index better correlated to mortality in both sexes than the BMI. This relationship persisted after adjusting for smoking, any personal history of CVD, and the presence of diabetes.
The strong association between increased BF in women and increased mortality risk in females needs to be emphasized. In general, women have a greater capacity to store subcutaneous fat than men, and concomitantly a lesser tendency to store visceral fat, which is comparatively more harmful. Since subcutaneous fat storage capacity is lower in men, excess adipose tissue is more rapidly circumscribed to visceral and ectopic tissues such as the liver and skeletal muscle, thus favoring insulin resistance and interfering with insulin signaling pathways.25 Women need to accumulate a greater amount of total adiposity, thereby reaching a higher BMI value than men, in order to saturate their subcutaneous fat storage capacity and to start depositing fat in visceral and ectopic tissues, so leading to insulin resistance and the development of diabetes.25,26 This gender difference in BF location (subcutaneous in women versus visceral/ectopic in men) and the associated metabolic changes may be crucial in explaining the difference in the prevalence of diabetes according to sex (lower in adult women) as well as the different complications rates once diabetes has developed.
With regard to increased cancer mortality, a meta-analysis published in 201727 and comprising 204 studies found increased adiposity (none of them using the CUN-BAE to define obesity) to be associated with the development of 11 types of cancer (adenocarcinoma of the esophagus, multiple myeloma, and tumors of the cardia, stomach, colon, rectum, biliary tract, pancreas, endometrium, ovary, and kidney) out of the 36 locations studied. The authors thus suggested that obesity is the second most important modifiable cause (after smoking) for the development of cancer.
Previous studies27–29 had already examined the effect of obesity upon the incidence of malignant disease. Possible reasons why obesity is related to cancer include increased insulin levels and insulin-like growth factor 1 (IGF-1), a chronic inflammatory state and the estrogen excess produced by fatty tissue (predisposing to breast and endometrial cancer), regulating other growth factors.
According to data from our study, the increase in BF measured by both CUN-BAE and the BMI after adjusting for cardiovascular risk factors is directly related to the increase in total and specific mortality in women.
Financial supportThis study was partially funded in its initial phase by the Health Research Fund (Fondo de Investigación Sanitaria) (98/0462) and Sanofi Laboratories.
Conflicts of interestThe authors declare that they have no conflicts of interest.
Thanks are due to all the volunteers in Asturias who participated in the study; the investigation would not have been possible without their help.
Thanks are also due to all the primary care teams of the selected areas, to Ismael Huerta, Shura Rozada and the Mortality Registry of the Principality of Asturias (especially Dr. José Ramón Quirós), as well as to all the Departments of Endocrinology and Nutrition of the Principality of Asturias.
Please cite this article as: Ares Blanco J, Valdés Hernández S, Botas Cervero P, Sánchez-Ragnarsson C, Pujante Alarcón P, Menéndez-Torre E, et al. Estimación de grasa corporal según ecuación CUN-BAE e IMC y riesgo de mortalidad por sexos en la cohorte del Estudio Asturias. Endocrinol Diabetes Nutr. 2019;66:487–494.
