


To validate regression equations that predict the state of maturity (MS) to evaluate the physical growth and body fatness of Chilean children and adolescents.
Material and methodsA transversal study was carried out in 8094 school children between 6.0 and 18.9 years old. Weight, standing height, sitting height, and waist circumference (WC) were evaluated. Peak growth rate (PVC) was estimated by the mathematical model 1 of Preece-Baines (MPB). Mirwald’s equations (based on age, weight, standing height, sitting height, and leg length) and Moore’s equations (based on age, weight, and standing height) were used to estimate MS. The body mass index (BMI) was calculated.
ResultsThe BMP showed that the PVC in men was 10.33 ± 0.29 years and in women was 12.81 ± 0.27 years. Using Mirwald’s equation, men reached MS at 14.09 ± 0.8 APVC and women at 11.6 ± 0.9 APVC, while using Moore’s equation, men reached 13.7 ± 0.6 APVC and women at 12.1 ± 0.6 APVC. There were significant differences between MPB with Mirwald, MPB with Morre, and between Mirwald and Moore (p < 0.001). Explanation values by MS category were Mirwald’s equation [men (early R2 = 0.81, mean R2 = 0.69 and late R2 = 0.09) and women (early R2 = 0.83, mean R2 = 0.83 and late R2 = 0.77)], Moore’s equation [men (early R2 = 0.93, mean R2 = 0.70 and late R2 = 0.79) and women (early R2 = 0.89, mean R2 = 0.89 and late R2 = 0.83)]. Percentiles were created for weight, height, CC and BMI.
ConclusionIt was verified that Moore’s and Mirwald’s equations differ with the mathematical model MPB in both sexes. However, Moore’s equation could be useful for the evaluation of MS in Chilean children and adolescents.
Validar ecuaciones de regresión que predicen el estado de madurez (EM) para evaluar el crecimiento físico y adiposidad corporal de niños y adolescentes chilenos.
Material y métodosSe efectuó un estudio transversal en 8.094 escolares de entre 6,0 y 18,9 años. Se evaluó el peso, la estatura de pie, la estatura sentada y la circunferencia de cintura (CC). El pico de velocidad de crecimiento (PVC) se estimó por el modelo matemático 1 de Preece-Baines (MPB). Para estimar el EM, se utilizaron las ecuaciones de Mirwald (basadas en edad, peso, estatura de pie, estatura sentada y longitud de piernas) y las ecuaciones de Moore (basadas en edad, peso y estatura de pie). Se calculó el índice de masa corporal (IMC).
ResultadosEl MPB evidenció que el PVC en hombres fue de 10,33 ± 0,29 años y en mujeres fue a los 12,81 ± 0,27 años. Por medio de la ecuación de Mirwald, los hombres alcanzaron el EM a los 14,09 ± 0,8 APVC y las mujeres los 11,6 ± 0,9 APVC, mientras que, por la ecuación de Moore, los hombres alcanzaron a los 13,7 ± 0,6 APVC y las mujeres a los 12,1 ± 0,6 APVC. Hubo diferencias significativas entre el MPB con Mirwald, MPB con Moore y entre Mirwald con Moore (p < 0,001). Los valores de explicación por categoría de EM fueron: ecuación de Mirwald [hombres (precoz R2 = 0,81, promedio R2 = 0,69 y tardío R2 = 0,09) y mujeres (precoz R2 = 0,83, promedio R2 = 0,83 y tardío R2 = 0,77)], ecuación de Moore [hombres (precoz R2 = 0,93, promedio R2 = 0,70 y tardío R2 = 0,79) y mujeres (precoz R2 = 0,89, promedio R2 = 0,89 y tardío R2 = 0,83)]. Se crearon percentiles para peso, estatura, CC e IMC.
ConclusiónSe verificó que las ecuaciones de Moore y Mirwald difieren con el modelo matemático MPB en ambos sexos, aunque, la ecuación de Moore podría ser útil para la evaluación del EM en niños y adolescentes chilenos.
Physical growth is considered to be a dynamic, complicated and long process that continues throughout infancy, childhood and adolescence,1 while maturation is a process of major physiological changes that manifest most intensely during adolescence.
Both are complex physiological processes that are controlled and affected by hormonal, environmental, and genetic factors,2 and they occur simultaneously.3
Infancy, childhood and adolescence are obviously very interesting stages in research in the health sciences; of particular interest are evaluation and follow-up of physical growth, nutritional status, changes in maturity stage (MS) and lifestyle, among other matters.
During these stages, opportunities arise for the individual to express his or her genetic potential; these opportunities may in turn be modified by the individual’s environment. Studies of these factors are important in paediatric research, since they involve constant monitoring, diagnosis and follow-up in growth and biological maturation processes with the goal of identifying children at nutritional risk.4 Some recent studies in this regard have found early puberty to be associated with higher risks of overweight and obesity.5,6 Hence, there is an urgent need to include MS indicators in the evaluation of growth and body composition, as this may provide a more accurate means of adjustment in the evaluation of nutritional status during growth and development.
In general, methods of MS evaluation (bone age and secondary sex characteristics, age of menarche and percentage of adult height) are often impractical and considered invasive.7–9 This is a major drawback for epidemiology research and prevents their use in and application to large populations.
As such, two non-invasive techniques based on somatic indicators that enable prediction of MS in children and adolescents have been proposed in recent years. The first, from Mirwald et al.,10 is based on variables of age, weight, height, sitting height and leg length (height minus sitting height). The second, from Moore et al.,11 uses chronological age, weight and height.
Both techniques have been developed from the same database and have been widely used in studies having to do with monitoring of and participation in programmes of physical activity,12 follow-up of physical growth,13 strength training in athletes,14 and identification of talent in sport,15 among other studies.
Kozieł and Malina 16 recently validated both techniques in Polish children and adolescents using a longitudinal criterion, noting that the Moore et al.11 equations, despite having significant limitations, are useful in children and adolescents. However, to the best of our knowledge, in South America in general and Chile in particular, no studies have compared and validated these equations according to a cross-sectional and/or longitudinal design. Identifying the technique best suited to the Chilean population could aid in interpreting physical growth and body fat parameters in paediatric populations.
Thus, based on these premises, this study had the following objective: to validate the regression equations that predict MS in a sample of Chilean children and adolescents (the Mirwald et al.10 and Moore et al.11 equations), using Preece and Baines’ mathematical model 117 for cross-sectional samples, or Preece and Baines’ model (PBM), as a criterion method. This model enables estimation of growth velocity, especially in large samples of children and adolescents.18
This information may help to determine nutritional risk in children who are advanced in terms of maturity,6 since puberty intensity and duration are specific to each individual and may vary considerably across individuals.13
MethodsStudy type and sampleA cross-sectional (comparative) study was conducted in children and adolescents from the Maule region of Chile. The sample population consisted of 31,696 students with ages ranging from 6.0 to 18.9 years. The students were from four provinces in the Maule region (Cauquenes, Curicó, Linares and Talca). They attended 12 municipal primary and secondary schools. Probabilistic (random) sampling was used to calculate sample size, yielding a sample of 8094 subjects (4260 [13.43%] males and 3834 [12.0%] females) with a 95% CI.
The students’ parents and/or guardians signed the informed consent form, and each student signed the informed assent form. The study was conducted in accordance with the Declaration of Helsinki for human beings and the suggestions of the independent ethics committee of the Universidad Autónoma de Chile [Autonomous University of Chile] (protocol no. 238/2013). Students who voluntarily agreed to participate and completed the anthropometric evaluations were included. Those who were not in attendance on the day of the evaluation or did not complete the anthropometric evaluations were excluded.
Techniques and proceduresAnthropometric variables were measured at the schools’ facilities during school hours (8:00 AM–12:30 PM and 2:30 PM–6:00 PM) between Monday and Friday. This was done in 2015 and 2016. For purposes of evaluation, a team of six experienced evaluators trained in anthropometric evaluations was formed. All variables were evaluated twice, and rates of intra-evaluator and inter-evaluator errors in measurement technique (EMT) were 1%–2%.
Anthropometric measurements were evaluated as recommended by Ross and Marfell-Jones.19 Measurements were taken with the students wearing minimal clothing: a light shirt, shorts and no shoes. Body weight (kg) was determined using electronic scales (Tanita, United Kingdom) capable of weighing 0–150 kg with accuracy within 100 g. Standing height was determined using a portable stadiometer (Seca GmbH & Co. KG, Hamburg, Germany) with accuracy within 0.1 mm, according to the Frankfurt plane. Sitting height was measured on a wooden bench (a flat box with a height of 50 cm) with a stadiometer (SECA, Hamburg, Germany) with accuracy within 0.1 mm. Waist circumference (WC) (cm) was measured at the midpoint between the lower ribs and the upper part of the iliac crest with a metal anthropometric tape measure (Seca brand), graduated in millimetres with accuracy within 0.1 cm. Body mass index (BMI) was calculated using the following formula: BMI = weight (kg)/height2 (m).
The criterion method for evaluating peak height velocity (PHV) in children and adolescents was the PBM.17 This model is employed in cross-sectional and longitudinal studies of growth20 and used to infer growth acceleration and determine the age at which adult height is reached. This exponential logistic model multiplied was:
This model represents five parameters: h1 represents the upper asymptote (adult height), hθ is related to height, S0 and S1 are related to mean increases in growth (shape of the peak), and the θ parameter is related to hθ age.
The MS of the students studied was determined through years of peak height velocity (PHV). It was calculated using the regression equation proposed by Mirwald et al.10 This method includes standing height, sitting height, leg length (standing height minus sitting height) and their interactions:
Females: Maturity stage (years) = −9.376 + (0.0001882 × [leg length × sitting height]) + (0.0022 × [age × leg length]) + (0.005841 × [age × standing height]) − (0.002658 × [age × weight]) + (0.07693 × [weight-to-height ratio × 100]).
Males: Maturity stage (years) = −9.236 + (0.0002708 × [leg length × sitting height]) + (−0.001663 × [age × leg length]) + (0.007216 × [age × standing height]) + (0.02292 × [weight-to-height ratio × 100]).
The equations proposed by Moore et al.11 use age and standing height for both sexes:
Females: Maturity stage (years) = −7.709133 + (0.0042232 × [age × height]).
Males: Maturity stage (years) = −7.999994 + (0.0036124 × [age × height]).
To classify MS, the method suggested by Malina and Koziel was used,16 with young people within −1 to +1 years of PHV classified as average, those under −1 years of PHV classified as early and those over +1 years of PHV classified as late.
StatisticsThe normal distribution of the data was verified using the Kolmogorov–Smirnov (K–S) test. Descriptive statistics (mean, standard deviation, range, frequency and percentage) were calculated. The differences between the two sexes were determined using the independent samples t test. Comparisons between the PBM and the regression equations were made using the related samples test. Relationships between variables were verified using Pearson’s r, adjusted R2 and standard error of estimate (SEE). In all cases, p < 0.05 was considered significant. Calculations were performed in Excel spreadsheets and SPSS 18.0. The PBM was calculated and the PHV graph prepared in the R software environment.
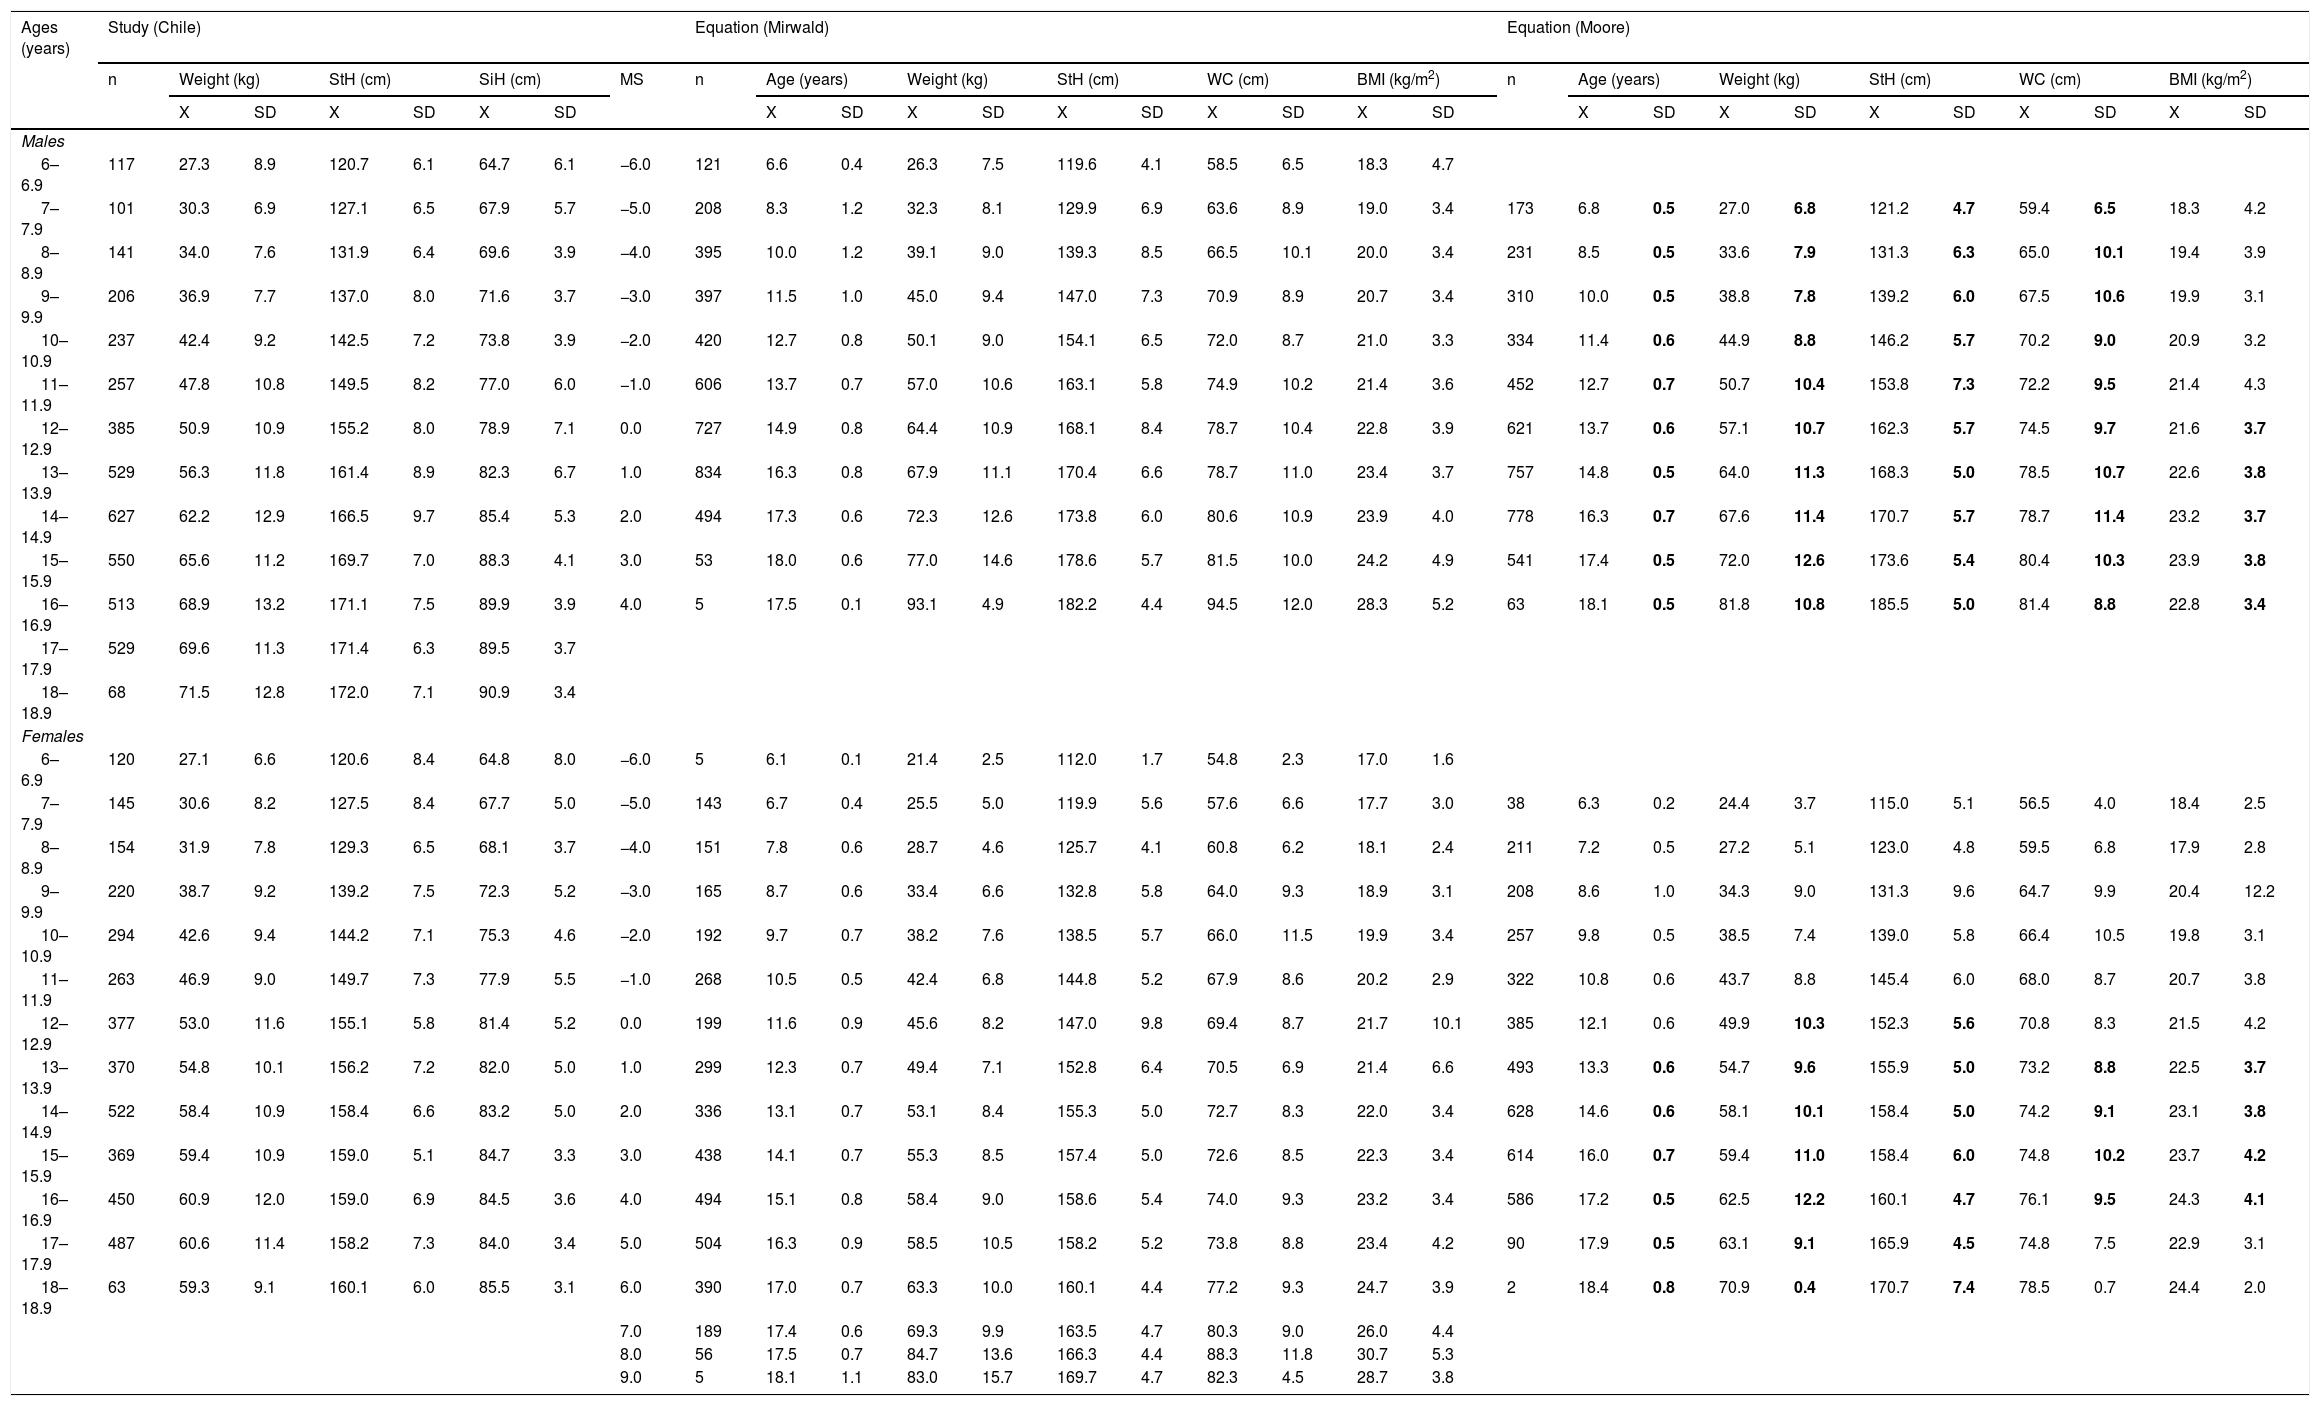
ResultsTable 1 shows the comparisons of the physical growth and body fat variables, aligned by MS for both equations. For the Mirwald equation, MS ranged in males from −6 to +4 years of PHV and in females from −6 to +9 years of PHV. For the Moore equation, MS values ranged from −5 to +5 years of PHV in males and from −5 to +6 years of PHV in females.
Physical growth and body fat variables, aligned by chronological age and MS in children and adolescents of both sexes.
| Ages (years) | Study (Chile) | Equation (Mirwald) | Equation (Moore) | |||||||||||||||||||||||||||
|---|---|---|---|---|---|---|---|---|---|---|---|---|---|---|---|---|---|---|---|---|---|---|---|---|---|---|---|---|---|---|
| n | Weight (kg) | StH (cm) | SiH (cm) | MS | n | Age (years) | Weight (kg) | StH (cm) | WC (cm) | BMI (kg/m2) | n | Age (years) | Weight (kg) | StH (cm) | WC (cm) | BMI (kg/m2) | ||||||||||||||
| X | SD | X | SD | X | SD | X | SD | X | SD | X | SD | X | SD | X | SD | X | SD | X | SD | X | SD | X | SD | X | SD | |||||
| Males | ||||||||||||||||||||||||||||||
| 6–6.9 | 117 | 27.3 | 8.9 | 120.7 | 6.1 | 64.7 | 6.1 | −6.0 | 121 | 6.6 | 0.4 | 26.3 | 7.5 | 119.6 | 4.1 | 58.5 | 6.5 | 18.3 | 4.7 | |||||||||||
| 7–7.9 | 101 | 30.3 | 6.9 | 127.1 | 6.5 | 67.9 | 5.7 | −5.0 | 208 | 8.3 | 1.2 | 32.3 | 8.1 | 129.9 | 6.9 | 63.6 | 8.9 | 19.0 | 3.4 | 173 | 6.8 | 0.5 | 27.0 | 6.8 | 121.2 | 4.7 | 59.4 | 6.5 | 18.3 | 4.2 |
| 8–8.9 | 141 | 34.0 | 7.6 | 131.9 | 6.4 | 69.6 | 3.9 | −4.0 | 395 | 10.0 | 1.2 | 39.1 | 9.0 | 139.3 | 8.5 | 66.5 | 10.1 | 20.0 | 3.4 | 231 | 8.5 | 0.5 | 33.6 | 7.9 | 131.3 | 6.3 | 65.0 | 10.1 | 19.4 | 3.9 |
| 9–9.9 | 206 | 36.9 | 7.7 | 137.0 | 8.0 | 71.6 | 3.7 | −3.0 | 397 | 11.5 | 1.0 | 45.0 | 9.4 | 147.0 | 7.3 | 70.9 | 8.9 | 20.7 | 3.4 | 310 | 10.0 | 0.5 | 38.8 | 7.8 | 139.2 | 6.0 | 67.5 | 10.6 | 19.9 | 3.1 |
| 10–10.9 | 237 | 42.4 | 9.2 | 142.5 | 7.2 | 73.8 | 3.9 | −2.0 | 420 | 12.7 | 0.8 | 50.1 | 9.0 | 154.1 | 6.5 | 72.0 | 8.7 | 21.0 | 3.3 | 334 | 11.4 | 0.6 | 44.9 | 8.8 | 146.2 | 5.7 | 70.2 | 9.0 | 20.9 | 3.2 |
| 11–11.9 | 257 | 47.8 | 10.8 | 149.5 | 8.2 | 77.0 | 6.0 | −1.0 | 606 | 13.7 | 0.7 | 57.0 | 10.6 | 163.1 | 5.8 | 74.9 | 10.2 | 21.4 | 3.6 | 452 | 12.7 | 0.7 | 50.7 | 10.4 | 153.8 | 7.3 | 72.2 | 9.5 | 21.4 | 4.3 |
| 12–12.9 | 385 | 50.9 | 10.9 | 155.2 | 8.0 | 78.9 | 7.1 | 0.0 | 727 | 14.9 | 0.8 | 64.4 | 10.9 | 168.1 | 8.4 | 78.7 | 10.4 | 22.8 | 3.9 | 621 | 13.7 | 0.6 | 57.1 | 10.7 | 162.3 | 5.7 | 74.5 | 9.7 | 21.6 | 3.7 |
| 13–13.9 | 529 | 56.3 | 11.8 | 161.4 | 8.9 | 82.3 | 6.7 | 1.0 | 834 | 16.3 | 0.8 | 67.9 | 11.1 | 170.4 | 6.6 | 78.7 | 11.0 | 23.4 | 3.7 | 757 | 14.8 | 0.5 | 64.0 | 11.3 | 168.3 | 5.0 | 78.5 | 10.7 | 22.6 | 3.8 |
| 14–14.9 | 627 | 62.2 | 12.9 | 166.5 | 9.7 | 85.4 | 5.3 | 2.0 | 494 | 17.3 | 0.6 | 72.3 | 12.6 | 173.8 | 6.0 | 80.6 | 10.9 | 23.9 | 4.0 | 778 | 16.3 | 0.7 | 67.6 | 11.4 | 170.7 | 5.7 | 78.7 | 11.4 | 23.2 | 3.7 |
| 15–15.9 | 550 | 65.6 | 11.2 | 169.7 | 7.0 | 88.3 | 4.1 | 3.0 | 53 | 18.0 | 0.6 | 77.0 | 14.6 | 178.6 | 5.7 | 81.5 | 10.0 | 24.2 | 4.9 | 541 | 17.4 | 0.5 | 72.0 | 12.6 | 173.6 | 5.4 | 80.4 | 10.3 | 23.9 | 3.8 |
| 16–16.9 | 513 | 68.9 | 13.2 | 171.1 | 7.5 | 89.9 | 3.9 | 4.0 | 5 | 17.5 | 0.1 | 93.1 | 4.9 | 182.2 | 4.4 | 94.5 | 12.0 | 28.3 | 5.2 | 63 | 18.1 | 0.5 | 81.8 | 10.8 | 185.5 | 5.0 | 81.4 | 8.8 | 22.8 | 3.4 |
| 17–17.9 | 529 | 69.6 | 11.3 | 171.4 | 6.3 | 89.5 | 3.7 | |||||||||||||||||||||||
| 18–18.9 | 68 | 71.5 | 12.8 | 172.0 | 7.1 | 90.9 | 3.4 | |||||||||||||||||||||||
| Females | ||||||||||||||||||||||||||||||
| 6–6.9 | 120 | 27.1 | 6.6 | 120.6 | 8.4 | 64.8 | 8.0 | −6.0 | 5 | 6.1 | 0.1 | 21.4 | 2.5 | 112.0 | 1.7 | 54.8 | 2.3 | 17.0 | 1.6 | |||||||||||
| 7–7.9 | 145 | 30.6 | 8.2 | 127.5 | 8.4 | 67.7 | 5.0 | −5.0 | 143 | 6.7 | 0.4 | 25.5 | 5.0 | 119.9 | 5.6 | 57.6 | 6.6 | 17.7 | 3.0 | 38 | 6.3 | 0.2 | 24.4 | 3.7 | 115.0 | 5.1 | 56.5 | 4.0 | 18.4 | 2.5 |
| 8–8.9 | 154 | 31.9 | 7.8 | 129.3 | 6.5 | 68.1 | 3.7 | −4.0 | 151 | 7.8 | 0.6 | 28.7 | 4.6 | 125.7 | 4.1 | 60.8 | 6.2 | 18.1 | 2.4 | 211 | 7.2 | 0.5 | 27.2 | 5.1 | 123.0 | 4.8 | 59.5 | 6.8 | 17.9 | 2.8 |
| 9–9.9 | 220 | 38.7 | 9.2 | 139.2 | 7.5 | 72.3 | 5.2 | −3.0 | 165 | 8.7 | 0.6 | 33.4 | 6.6 | 132.8 | 5.8 | 64.0 | 9.3 | 18.9 | 3.1 | 208 | 8.6 | 1.0 | 34.3 | 9.0 | 131.3 | 9.6 | 64.7 | 9.9 | 20.4 | 12.2 |
| 10–10.9 | 294 | 42.6 | 9.4 | 144.2 | 7.1 | 75.3 | 4.6 | −2.0 | 192 | 9.7 | 0.7 | 38.2 | 7.6 | 138.5 | 5.7 | 66.0 | 11.5 | 19.9 | 3.4 | 257 | 9.8 | 0.5 | 38.5 | 7.4 | 139.0 | 5.8 | 66.4 | 10.5 | 19.8 | 3.1 |
| 11–11.9 | 263 | 46.9 | 9.0 | 149.7 | 7.3 | 77.9 | 5.5 | −1.0 | 268 | 10.5 | 0.5 | 42.4 | 6.8 | 144.8 | 5.2 | 67.9 | 8.6 | 20.2 | 2.9 | 322 | 10.8 | 0.6 | 43.7 | 8.8 | 145.4 | 6.0 | 68.0 | 8.7 | 20.7 | 3.8 |
| 12–12.9 | 377 | 53.0 | 11.6 | 155.1 | 5.8 | 81.4 | 5.2 | 0.0 | 199 | 11.6 | 0.9 | 45.6 | 8.2 | 147.0 | 9.8 | 69.4 | 8.7 | 21.7 | 10.1 | 385 | 12.1 | 0.6 | 49.9 | 10.3 | 152.3 | 5.6 | 70.8 | 8.3 | 21.5 | 4.2 |
| 13–13.9 | 370 | 54.8 | 10.1 | 156.2 | 7.2 | 82.0 | 5.0 | 1.0 | 299 | 12.3 | 0.7 | 49.4 | 7.1 | 152.8 | 6.4 | 70.5 | 6.9 | 21.4 | 6.6 | 493 | 13.3 | 0.6 | 54.7 | 9.6 | 155.9 | 5.0 | 73.2 | 8.8 | 22.5 | 3.7 |
| 14–14.9 | 522 | 58.4 | 10.9 | 158.4 | 6.6 | 83.2 | 5.0 | 2.0 | 336 | 13.1 | 0.7 | 53.1 | 8.4 | 155.3 | 5.0 | 72.7 | 8.3 | 22.0 | 3.4 | 628 | 14.6 | 0.6 | 58.1 | 10.1 | 158.4 | 5.0 | 74.2 | 9.1 | 23.1 | 3.8 |
| 15–15.9 | 369 | 59.4 | 10.9 | 159.0 | 5.1 | 84.7 | 3.3 | 3.0 | 438 | 14.1 | 0.7 | 55.3 | 8.5 | 157.4 | 5.0 | 72.6 | 8.5 | 22.3 | 3.4 | 614 | 16.0 | 0.7 | 59.4 | 11.0 | 158.4 | 6.0 | 74.8 | 10.2 | 23.7 | 4.2 |
| 16–16.9 | 450 | 60.9 | 12.0 | 159.0 | 6.9 | 84.5 | 3.6 | 4.0 | 494 | 15.1 | 0.8 | 58.4 | 9.0 | 158.6 | 5.4 | 74.0 | 9.3 | 23.2 | 3.4 | 586 | 17.2 | 0.5 | 62.5 | 12.2 | 160.1 | 4.7 | 76.1 | 9.5 | 24.3 | 4.1 |
| 17–17.9 | 487 | 60.6 | 11.4 | 158.2 | 7.3 | 84.0 | 3.4 | 5.0 | 504 | 16.3 | 0.9 | 58.5 | 10.5 | 158.2 | 5.2 | 73.8 | 8.8 | 23.4 | 4.2 | 90 | 17.9 | 0.5 | 63.1 | 9.1 | 165.9 | 4.5 | 74.8 | 7.5 | 22.9 | 3.1 |
| 18–18.9 | 63 | 59.3 | 9.1 | 160.1 | 6.0 | 85.5 | 3.1 | 6.0 | 390 | 17.0 | 0.7 | 63.3 | 10.0 | 160.1 | 4.4 | 77.2 | 9.3 | 24.7 | 3.9 | 2 | 18.4 | 0.8 | 70.9 | 0.4 | 170.7 | 7.4 | 78.5 | 0.7 | 24.4 | 2.0 |
| 7.0 | 189 | 17.4 | 0.6 | 69.3 | 9.9 | 163.5 | 4.7 | 80.3 | 9.0 | 26.0 | 4.4 | |||||||||||||||||||
| 8.0 | 56 | 17.5 | 0.7 | 84.7 | 13.6 | 166.3 | 4.4 | 88.3 | 11.8 | 30.7 | 5.3 | |||||||||||||||||||
| 9.0 | 5 | 18.1 | 1.1 | 83.0 | 15.7 | 169.7 | 4.7 | 82.3 | 4.5 | 28.7 | 3.8 | |||||||||||||||||||
Bold indicates a significant difference in relation to the Mirwald according to maturity stage.
BMI: body mass index; MS: maturity stage; SD: standard deviation; SiH: sitting height; StH: standing height; WC: waist circumference; X: arithmetic mean.
Significant differences were seen in males; the MS values calculated using the Mirwald equation were higher for age, weight and height compared to the Moore equation on all levels. However, in WC, differences were seen from −5 to 0 years of PHV, and from +2 to +4 years of PHV, and in BMI, differences were seen from 0 to +5 years of PHV. There were no differences in BMI from −6 to −1 years of PHV (p > 0.05).
In females, there were no significant differences in age, weight or height from −5 to −1 years of PHV; however, differences started to appear from 0 to +6 years of PHV in the physical growth variables (age, weight and height) (p < 0.05), while in the body fat variables (WC and BMI), differences were found from +1 to +4 years of PHV, with the Moore equation showing higher values than the Mirwald equation. In addition, there were no significant differences in the body fat variables from −5 to 0 years of PHV and +5 and +6 years of PHV (p > 0.05).
Fig. 1 shows the curve of PHV by chronological age determined by the PBM. Note that PHV was determined at 10.33 ± 0.29 years of age in females and at 12.81 ± 0.27 years of age in males. Growth velocity was 6.90 ± 0.96 cm per year in females and 7.11 ± 1.47 cm per year in males.
 curves for both sexes determined by the PBM for the cross-sectional sample of Chilean children and adolescents.")
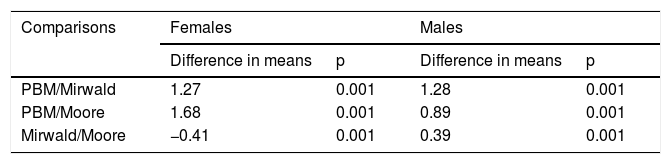
Table 2 shows the comparisons between the PBM and the Mirwald and Moore equations for both sexes. The PBM differed significantly from both equations in both sexes (p < 0.001); in addition, there were differences between the Mirwald and Moore equations in both sexes (p < 0.001).
Comparison of mean peak height velocity (PHV) values in children and adolescents of both sexes.
| Comparisons | Females | Males | ||
|---|---|---|---|---|
| Difference in means | p | Difference in means | p | |
| PBM/Mirwald | 1.27 | 0.001 | 1.28 | 0.001 |
| PBM/Moore | 1.68 | 0.001 | 0.89 | 0.001 |
| Mirwald/Moore | −0.41 | 0.001 | 0.39 | 0.001 |
PBM: Preece and Baines’ model.
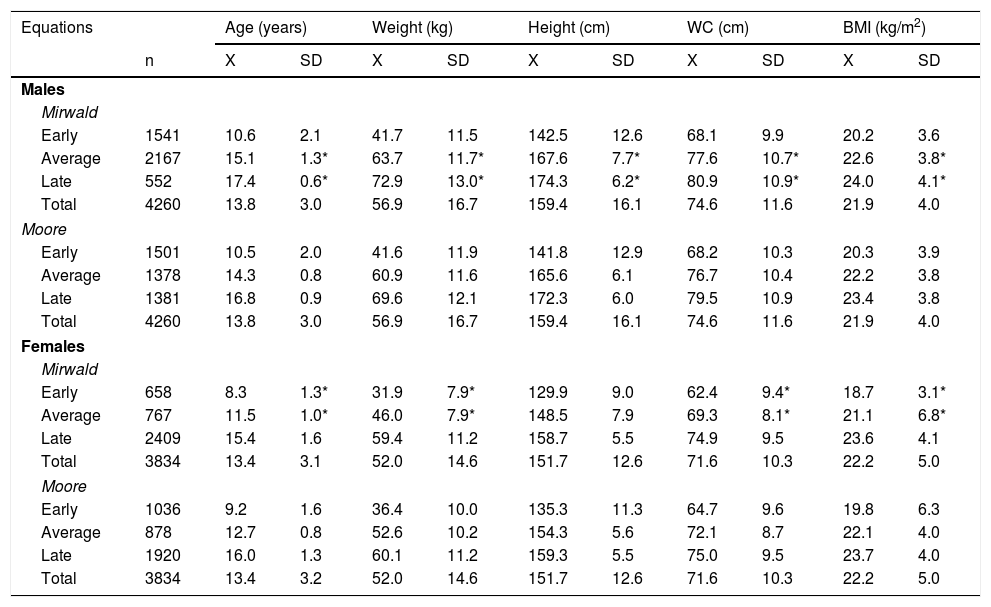
Table 3 shows the MS categories according to the physical growth and body fat variables for both equations. Significant differences between the two equations were found in both sexes. In males, the Mirwald equation showed higher values for age, weight and height in the average and late categories (p < 0.05), while in the early category there were no significant differences (p > 0.05). In females, the Moore equation showed higher values for age, weight and height in the average and late categories; however, in the late category, there were no significant differences between the two equations (p > 0.05).
Comparison of physical growth and body fat variables, categorised by MS for both sexes and equations.
| Equations | Age (years) | Weight (kg) | Height (cm) | WC (cm) | BMI (kg/m2) | ||||||
|---|---|---|---|---|---|---|---|---|---|---|---|
| n | X | SD | X | SD | X | SD | X | SD | X | SD | |
| Males | |||||||||||
| Mirwald | |||||||||||
| Early | 1541 | 10.6 | 2.1 | 41.7 | 11.5 | 142.5 | 12.6 | 68.1 | 9.9 | 20.2 | 3.6 |
| Average | 2167 | 15.1 | 1.3* | 63.7 | 11.7* | 167.6 | 7.7* | 77.6 | 10.7* | 22.6 | 3.8* |
| Late | 552 | 17.4 | 0.6* | 72.9 | 13.0* | 174.3 | 6.2* | 80.9 | 10.9* | 24.0 | 4.1* |
| Total | 4260 | 13.8 | 3.0 | 56.9 | 16.7 | 159.4 | 16.1 | 74.6 | 11.6 | 21.9 | 4.0 |
| Moore | |||||||||||
| Early | 1501 | 10.5 | 2.0 | 41.6 | 11.9 | 141.8 | 12.9 | 68.2 | 10.3 | 20.3 | 3.9 |
| Average | 1378 | 14.3 | 0.8 | 60.9 | 11.6 | 165.6 | 6.1 | 76.7 | 10.4 | 22.2 | 3.8 |
| Late | 1381 | 16.8 | 0.9 | 69.6 | 12.1 | 172.3 | 6.0 | 79.5 | 10.9 | 23.4 | 3.8 |
| Total | 4260 | 13.8 | 3.0 | 56.9 | 16.7 | 159.4 | 16.1 | 74.6 | 11.6 | 21.9 | 4.0 |
| Females | |||||||||||
| Mirwald | |||||||||||
| Early | 658 | 8.3 | 1.3* | 31.9 | 7.9* | 129.9 | 9.0 | 62.4 | 9.4* | 18.7 | 3.1* |
| Average | 767 | 11.5 | 1.0* | 46.0 | 7.9* | 148.5 | 7.9 | 69.3 | 8.1* | 21.1 | 6.8* |
| Late | 2409 | 15.4 | 1.6 | 59.4 | 11.2 | 158.7 | 5.5 | 74.9 | 9.5 | 23.6 | 4.1 |
| Total | 3834 | 13.4 | 3.1 | 52.0 | 14.6 | 151.7 | 12.6 | 71.6 | 10.3 | 22.2 | 5.0 |
| Moore | |||||||||||
| Early | 1036 | 9.2 | 1.6 | 36.4 | 10.0 | 135.3 | 11.3 | 64.7 | 9.6 | 19.8 | 6.3 |
| Average | 878 | 12.7 | 0.8 | 52.6 | 10.2 | 154.3 | 5.6 | 72.1 | 8.7 | 22.1 | 4.0 |
| Late | 1920 | 16.0 | 1.3 | 60.1 | 11.2 | 159.3 | 5.5 | 75.0 | 9.5 | 23.7 | 4.0 |
| Total | 3834 | 13.4 | 3.2 | 52.0 | 14.6 | 151.7 | 12.6 | 71.6 | 10.3 | 22.2 | 5.0 |
BMI: body mass index; MS: maturity stage; SD: standard deviation; WC: waist circumference; X: arithmetic mean.
In the body fat variables (WC and BMI), in males, the Mirwald equation showed significantly higher values than the Moore equation in the average and late categories for WC and BMI (p < 0.05). There were no differences in the early category in both body fat indicators (WC and BMI) (p > 0.05). In females, the Moore equation showed higher values than the Mirwald equation in WC and BMI in the early and average categories (p < 0.05). However, in the late category, no significant differences were seen in either WC or in BMI (p > 0.05).
Relationships between chronological age and each MS category are shown in Figs. 2 and 3. Coefficient of determination values by MS category, using the Mirwald equation, were relatively low compared to the Moore equation in both sexes. Using the Mirwald equation, R2 values ranged from 0.09 to 0.81 in males and from 0.57 to 0.83 in females. Using the Moore equation, said values ranged from 0.63 to 0.93 in males and from 0.71 to 0.98 in females.
 for both equations (Mirwald and Moore) in males.")
 for both equations (Mirwald and Moore) in females.")
The results of the study demonstrated significant differences between the PBM and the Mirwald and Moore equations in both sexes. These findings indicate that both anthropometric equations for predicting MS in children and adolescents could not be applied to Chilean children and adolescents.
Indeed, years of PHV determined by the PBM reflected much earlier ages than the regression equations: 10.33 ± 0.29 years in females and 12.81 ± 0.27 years in males; therefore, there is a difference in upper means when predicting using the Mirwald and Moore equations (∼0.89 to ∼1,68 years).
In addition, years of PHV in this study determined by the PBM were verified to be similar to those reported in samples from cross-sectional studies from Peru21 and Mexico,22 with which this evidence confirms that girls generally exhibit earlier growth and reach their final size before their male counterparts.
The results also confirmed that there were significant differences between the two regression equations in both males and females. The Mirwald equation showed higher values in males (in the growth and body fat variables) in the average and late categories compared to the Moore equation; by contrast, in females, the Mirwald equation showed lower values (weight, height, WC and BMI) in the early and average categories compared to the Moore equation. There were no differences in males when classified with late maturity, while there were no differences in females when classified with early maturity.
As a result, after the differences between the two equations were verified, the relationship between chronological age and each MS category (early, average and late) was examined to verify the degree of association of each equation. The Moore equations in both sexes were found to reflect relatively higher values than the Mirwald equation in the three MS categories. This suggests that they could be applied to samples of Chilean children and adolescents, although both equations in their studies show similar powers of explanation (89% and 90%).
These results obtained in this study could be associated with a lower SEE in the Moore equation compared to the Mirwald equation, since previous studies had already warned of some limitations of the Mirwald equation,10,23 especially in individuals further away from their years of PHV.16,23
In fact, the regressions observed in this study indicate that in the late MS category, the percentages of explanation in both sexes were lower with respect to the Moore equation, especially in males, confirming a lower power of explanation in young people with more advanced years of PHV, as seen in some studies.10,24
To date, the Mirwald equation has been widely used and applied in various populations around the world13,24,25 and in Chile,26,27 perhaps because it is older and has been more widely circulated since its publication; the equation proposed by Moore was published five years ago, and it may take longer to be circulated and gain recognition in the fields of health sciences and sport sciences.
In this regard, it should be noted that the SEE of the equations proposed to non-invasively determine MS and the number of predictors will be subject to further research in various sociocultural contexts, as there is a common interest in arriving at accurate and precise estimates, and consequently external validity, although on the other hand each population must develop its own equations10 reflecting its own reality.
It must also be clarified that maturation is a biological process of progress towards maturity and varies across body systems.16 It has two important dimensions: stage and timing. The former refers to the level of maturation at the time of observation, and the latter refers to the age at which specific maturation occurs.3 The equations investigated in this study deal with years of PHV reached for a particular chronological age; however, maturity stage cannot be determined using the equations analysed. This is an important gap to be filled by further research.
Controlling for the effects of maturity and the substantial range in terms of rate and timing of growth in paediatric populations remains a challenge,11 especially in the field of research, and offers new opportunities and prospects for professionals to continue to propose non-invasive, easy-to-use alternatives in health sciences and sport sciences.
In general, this study has various strengths related to its sample size and selection type, as well as the reliability of its anthropometric measurements, which showed EMT values of less than 2%. It is even the first large-scale study conducted in Chile to monitor MS. However, future studies should attend to other criteria for validation of regression equations to estimate MS, since this study was limited solely to validation through the PBM as longitudinal samples were not available. Future studies of Chilean children and adolescents should be longitudinal in nature; with them, new equations specific to regional populations could be proposed.
ConclusionIn conclusion, the Moore and Mirwald equations were confirmed to differ from the PBM in both sexes; however, the Moore equation could be useful for evaluating MS in Chilean children and adolescents, as its proposed equations showed a smaller error of estimate.
Conflicts of interestThe authors declare that they have no conflicts of interest.
Please cite this article as: Cossio-Bolaños M, Vidal-Espinoza R, Castelli Correia de Campos LF, Sulla-Torres J, Cossio-Bolaños W, Urra Albornoz C, et al. Ecuaciones que predicen el estado de madurez: Validación en una muestra transversal para evaluar el crecimiento físico y adiposidad corporal en niños y adolescentes chilenos. Endocrinol Diabetes Nutr. 2021;68:689–698.
