


Prevalence of overweight and obesity, a condition that promotes development of chronic degenerative diseases, has increased in Mexico in recent years. Implementation of strategies to increase daily consumption of vegetables, legumes, whole grain cereals, and fruits by the population will result in an adequate intake of soluble fiber, antioxidants, protein of vegetable origin, and vitamins.
ObjectiveTo assess the effect of a commercial food product prepared using 6 legumes on some anthropometric and biochemical parameters in apparently healthy subjects.
MethodsA randomised dietary intervention trial where subjects in the study group received for three months 15 g of the product, administered daily in periods of five days with two days of rest. Before and after intervention, anthropometric and dietary assessments were performed, and serum glucose, lipid profile, insulin, ultrasensitive C-reactive protein, malondialdehyde (MDA) and insulin resistance (HOMA index) were measured. A Mann-Whitney U test was used and values of P < .05 were considered statistically significant.
ResultsSixty university students were included in the study (53% males). At the end of the intervention, decreases were seen in serum glucose levels (P = .001), MDA (P = .001) and HOMA index (P = .017), but there were no significant changes in all other parameters.
ConclusionsDaily intake of 15 g of the legume-based food product improved serum glucose and malondialdehyde levels in the study group, as well as insulin resistance; which could be attributed to the presence of polyphenols and isoflavones such as genistein in legumes.
En México, en los últimos años se ha incrementado la prevalencia de sobrepeso y obesidad, condición que favorece el desarrollo de enfermedades crónico-degenerativas. Implementar estrategias para incrementar en la población el consumo diario de vegetales, leguminosas, cereales de grano entero y frutas, implicará una ingesta adecuada de fibra soluble, antioxidantes, proteínas de origen vegetal y vitaminas.
ObjetivoEvaluar el efecto de un producto alimenticio comercial elaborado a base de 6 leguminosas sobre determinados parámetros antropométricos y bioquímicos en sujetos sanos.
MétodosEnsayo aleatorizado de intervención dietética, en el que los sujetos del grupo de estudio recibieron durante tres meses, 15 g del producto, administrados diariamente en periodos de cinco días con dos días de descanso. Antes y después de la intervención se realizó una valoración antropométrica y dietética, así como una cuantificación sérica de glucosa, perfil de lípidos, insulina, proteína C reactiva ultrasensible, malondialdehído (MDA) y resistencia a la insulina (índice HOMA). Se utilizó la prueba U de Mann Whitney y una significación estadística de P < 0,05.
ResultadosSe incluyeron 60 estudiantes universitarios (53% hombres). Al término de la intervención, en el grupo de estudio se obtuvo una disminución en los niveles séricos de glucosa (P = 0,001), MDA (P = 0,001) e índice HOMA (P = 0,017), sin cambios significativos en el resto de los parámetros.
ConclusionesLa ingesta diaria de 15 g de un producto a base de leguminosas mejoró en el grupo estudiado los niveles séricos de glucosa y malondialdehído, así como la resistencia a la insulina; lo cual podría atribuirse al contenido de polifenoles e isoflavonas como la genisteína presentes en las leguminosas.
Obesity is the main modifiable risk factor for the development of chronic degenerative diseases (CDDs) such as diabetes mellitus (DM) and cardiovascular diseases, which represent the leading causes of mortality worldwide, along with other complications.1,2 In Mexico, the prevalence of overweight and obesity has increased from 61.8% in 2000 to 72.5% in 2016.3 On analysing the results of the 2016 National Health Survey by geographical zones, the figures are seen to be even higher than the national average in the north of the country (73.9%3,4).
There is evidence that imbalanced nutrition is related to CDDs. In recent years, the trends in eating habits have been towards an increased consumption of fast foods that are high in saturated fat, sodium, proteins of animal origin, refined flour and sugar. The quantities consumed have also increased. As an example, soft drink cup servings tripled in size.5 On the other hand, these foods contain little fibre, which is why one of the strategies of the Mexican National Agreement on Food Health (Acuerdo Nacional para la Salud Alimentaria) has been to increase the daily consumption of vegetables, legumes, whole grain cereals and fruit—incrementing their availability and accessibility, and promoting their consumption.6,7
One way to address this problem is to recommend that concrete supplements and food products be included in the diet. These products must contribute to the specific needs and requirements of the population, ensuring that their intake does not cause problems of intolerance or malabsorption. Furthermore, they must be easy to prepare and should be agreeable from the organoleptic perspective, i.e., their colour, smell, texture and taste should be pleasant to encourage consumption with the recommended frequency.8
The aim of a food product is to improve the nutritional intake of the individual with a view to securing good health. Consumption of such products is mediated by factors such as culture, habits, physical environment and the availability of resources. These products are added to the normal diet of the individual and may be formulated based on vitamins, minerals, fibre, amino acids, proteins, fatty acids, carbohydrates, antioxidants, herbal extracts or concentrates and foods, among others, either alone or in different combinations. Food products or supplements can be packaged and supplied in the form of tablets, capsules, liquids or powders. Nevertheless, it must be taken into account that they are not a substitute for food, and do not constitute the only component of a correct diet.9
Few studies are available on food products and their effect on human health. In this regard, studies on plant proteins are mainly referred to soya, and publications on other legumes are scarce. It is important to develop and evaluate food products that encourage their consumption and afford nutritional benefits, leading to a more balanced and better quality diet. The purpose of this study was to assess the effect of a 6-legume powder product, prepared as no added sugar chocolate shake, upon the lipid profile and certain biochemical markers related to obesity, metabolic syndrome and CDDs in a group of healthy adults. The markers evaluated were serum malondialdehyde (MDA) as an indicator of lipid peroxidation; high-sensitivity C-reactive protein (hsCRP) as a mediator of inflammation and an indicator of coronary risk; and insulin resistance in the fasting state as estimated by the homeostatic model assessment (HOMA).
Material and methodsStudy designA randomised dietary intervention study was carried out involving a commercial food product based on legumes at the School of Medicine of the Universidad Autónoma de Baja California, in the city of Mexicali, Baja California, Mexico.
Study subjectsThe study sample comprised 60 students from the third semester of the degree in Medicine (School of Medicine of the Universidad Autónoma de Baja California, in the city of Mexicali, Baja California, Mexico), of either gender, apparently healthy, and between 18–30 years of age. Written informed consent was obtained in all cases. Subjects treated with vitamin supplements, antioxidants or any type of medication in the three months prior to the start of the project were excluded, as were those who failed to comply with the anthropometric, dietary and laboratory tests at the start and end of the intervention period. The participants were divided into two groups of 30 individuals each (study group and control group) through simple randomization using the EpiDat 3.1 package. The study was conducted in accordance with the ethical principles of the Declaration of Helsinki and its respective amendments.
Legume-based food productThe study product is marketed under the name Leggu Drik®, produced for VD Tecnología Nutricional (VDTEC), a Mexican company specializing in the formulation, manufacture and marketing of foods obtained through food engineering. The product is formulated as a powder for making a chocolate-flavoured, no added sugar beverage based on 6 legumes: soya (Glycine max), frijol bean (Phaseolus vulgaris), chickpea (Cicer arietinum), lentil (Lens culinaris), faba bean (Vicia faba) and kidney bean (Phaseolus vulgaris)—with soya being the main ingredient of the formulation. Based on the product label information, each 15 g portion contains 247.5 kJ (58.5 kcal), 1.026 g total fat, 0.0 g saturated fat, 4.7 g total carbohydrates, 0.55 g sugars (fructose), 1.5 g total fibre, 7.63 g protein, 0.0 g sodium, and 300 mg vitamin E.
Quantification of polyphenols in the legume food productTotal polyphenol levels in the food product were determined using the Folin Ciocalteu method10 as an estimate of its antioxidant capacity. Three samples of the product were taken at random, and each of them were quantified in triplicate. The total polyphenol content was expressed as milligrams of gallic acid (GA) equivalent per gram of product.
InterventionThe legume food product was prepared at the time of administration to the study participants, adding 15 g of product to 250 mL of water. Administration was from Monday to Friday during a period of three months, representing a total of 65 days of administration. To ensure 100% adherence to intake, the product was administered directly in the classroom. If a student, for some reason, was not in the classroom at the time of administration, he/she was contacted by phone and a time and place for administration was agreed. At the start and end of the intervention period, all subjects participating in the study underwent an anthropometric and dietary assessment, and a venous blood sample was collected for the biochemical tests.
Anthropometric assessmentBody weight and height were recorded using a scale with a stadiometer, while waist and hip circumference was measured using a fibreglass measuring tape (both instruments corresponding to the SECA® brand, Hamburg, Germany). The measurements were made using standardised procedures.11 Body mass index (BMI) was calculated by dividing the weight in kilograms by the height in meters, squared.
Dietary assessmentUse was made of a 7-day food frequency questionnaire (FFQ) comprising a list of 124 foods, to determine how often they were consumed during a period of one week.12 All the surveys were administered by the study supervisor. Natural size plastic models of the food portions were used to avoid discrepancies with the actual portion sizes. The questionnaire included 124 questions comprising food groups. Incorporation of a standard serving for each of the foods allowed quantification of their consumption and of the nutrients based on the ESHA® version 10.11 nutrition program (Salem, Oregon, USA).
Blood biochemical testsAll blood samples were collected in the clinical analyses laboratory of the School of Medicine of the Universidad Autónoma de Baja California through puncture of the antecubital vein and were placed in tubes without anticoagulant. To obtain the blood serum fraction, the sample was allowed to stand for no more than 30 min and was then centrifuged at 4500 rpm for 10 min, using an IEC (International Equipment Co.) clinical centrifuge. The serum obtained was separated and processed on the same day. The participants reported to the laboratory between 7:00 and 8:00 a.m., after a fasting period of at least 12 h, a good night’s rest (at least 6 h of sleep), good hydration, no vigorous physical activity in the three days prior to the venipuncture, and with no changes in their usual diet.
Serum glucose, total cholesterol, triglycerides, and HDL-cholesterol (HDL-C) were measured using commercial liquid chemistry reagents (SPINREACT, S.A., Spain) with a clinical chemistry analyser (Erbachem 7, Erba Diagnostics Mannheim GmbH, Germany). LDL-cholesterol (LDL-C) and VLDL-cholesterol levels were calculated using the Friedewald formula.13 Serum insulin and ultrasensitive C-reactive protein quantification was performed using immunoenzymatic assays (Monobind Inc., Lake Forest, CA, USA), employing a Bio Tek brand microplate reader and washer (Bio Tek Instruments, Inc. Winooski, VT, USA). Insulin resistance in the fasting state was assessed based on the HOMA index14 using the formula ([insulin (μIU/mL)] × [glucose (mmol/l)])/22.5. Quantification was made of the serum MDA levels as a lipoperoxidation marker, using the N-methyl-2-phenyl-indol method.15 Measurements requiring the use of commercial reagent kits were made following the instructions of the manufacturer and in accordance with the internal and external quality control protocols established in the laboratory.
Statistical analysisApplication of the Shapiro Wilk test showed the study variables to exhibit a non-normal distribution; the data were therefore expressed as the median and interquartile range (IQR). The Mann-Whitney U test was used to analyse differences between groups before and after the intervention. Statistical significance was considered for P < .05. The SPSS version 23 statistical package (SPSS Inc., USA) was used throughout.
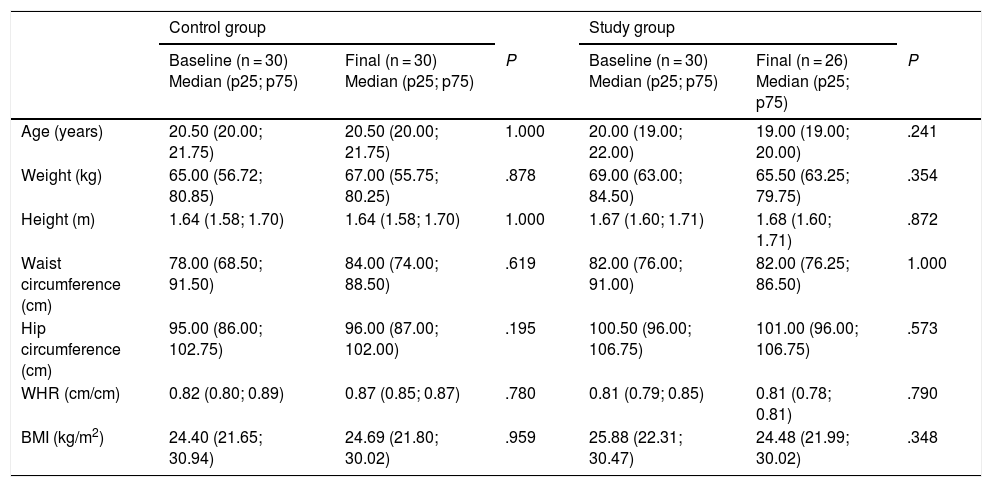
ResultsBased on the established screening criteria, the study included a total of 60 subjects, of which 53% were males. The study population was randomly divided into a control group (n = 30; 53% males) and a study group (n = 30; 46% males). Four subjects were excluded because they failed to comply with the anthropometric, dietary and laboratory tests at the end of the three-month intervention period (Fig. 1). Table 1 shows the anthropometric characteristics of both groups before and after the intervention.

Anthropometric characteristics of the control and study groups before and after the intervention.
| Control group | Study group | |||||
|---|---|---|---|---|---|---|
| Baseline (n = 30) Median (p25; p75) | Final (n = 30) Median (p25; p75) | P | Baseline (n = 30) Median (p25; p75) | Final (n = 26) Median (p25; p75) | P | |
| Age (years) | 20.50 (20.00; 21.75) | 20.50 (20.00; 21.75) | 1.000 | 20.00 (19.00; 22.00) | 19.00 (19.00; 20.00) | .241 |
| Weight (kg) | 65.00 (56.72; 80.85) | 67.00 (55.75; 80.25) | .878 | 69.00 (63.00; 84.50) | 65.50 (63.25; 79.75) | .354 |
| Height (m) | 1.64 (1.58; 1.70) | 1.64 (1.58; 1.70) | 1.000 | 1.67 (1.60; 1.71) | 1.68 (1.60; 1.71) | .872 |
| Waist circumference (cm) | 78.00 (68.50; 91.50) | 84.00 (74.00; 88.50) | .619 | 82.00 (76.00; 91.00) | 82.00 (76.25; 86.50) | 1.000 |
| Hip circumference (cm) | 95.00 (86.00; 102.75) | 96.00 (87.00; 102.00) | .195 | 100.50 (96.00; 106.75) | 101.00 (96.00; 106.75) | .573 |
| WHR (cm/cm) | 0.82 (0.80; 0.89) | 0.87 (0.85; 0.87) | .780 | 0.81 (0.79; 0.85) | 0.81 (0.78; 0.81) | .790 |
| BMI (kg/m2) | 24.40 (21.65; 30.94) | 24.69 (21.80; 30.02) | .959 | 25.88 (22.31; 30.47) | 24.48 (21.99; 30.02) | .348 |
WHR: waist-hip ratio; BMI: body mass index.
The p-value results from comparing the baseline and final levels in the study group and the control group. The Mann-Whitney U test was used. Statistical significance was considered for P < .05.
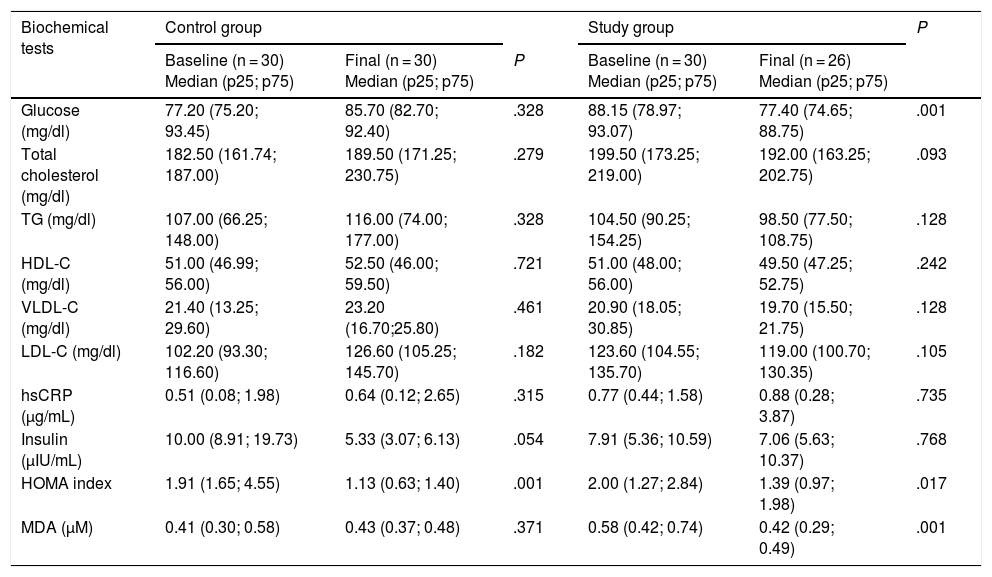
The biochemical test results are shown in Table 2. At the end of the intervention, the study group showed a significant decrease in MDA (P = .001), glucose (P = .001) and HOMA index (P = .017), with no significant changes in the rest of the blood parameters. However, a nonsignificant decrease in serum total cholesterol and LDL-C was observed (P = .092 and P = .105, respectively). In this same group, the serum glucose concentration decreased almost 10 mg/dl at the end of the intervention.
Results of the biochemical tests before and after the intervention.
| Biochemical tests | Control group | Study group | P | |||
|---|---|---|---|---|---|---|
| Baseline (n = 30) Median (p25; p75) | Final (n = 30) Median (p25; p75) | P | Baseline (n = 30) Median (p25; p75) | Final (n = 26) Median (p25; p75) | ||
| Glucose (mg/dl) | 77.20 (75.20; 93.45) | 85.70 (82.70; 92.40) | .328 | 88.15 (78.97; 93.07) | 77.40 (74.65; 88.75) | .001 |
| Total cholesterol (mg/dl) | 182.50 (161.74; 187.00) | 189.50 (171.25; 230.75) | .279 | 199.50 (173.25; 219.00) | 192.00 (163.25; 202.75) | .093 |
| TG (mg/dl) | 107.00 (66.25; 148.00) | 116.00 (74.00; 177.00) | .328 | 104.50 (90.25; 154.25) | 98.50 (77.50; 108.75) | .128 |
| HDL-C (mg/dl) | 51.00 (46.99; 56.00) | 52.50 (46.00; 59.50) | .721 | 51.00 (48.00; 56.00) | 49.50 (47.25; 52.75) | .242 |
| VLDL-C (mg/dl) | 21.40 (13.25; 29.60) | 23.20 (16.70;25.80) | .461 | 20.90 (18.05; 30.85) | 19.70 (15.50; 21.75) | .128 |
| LDL-C (mg/dl) | 102.20 (93.30; 116.60) | 126.60 (105.25; 145.70) | .182 | 123.60 (104.55; 135.70) | 119.00 (100.70; 130.35) | .105 |
| hsCRP (μg/mL) | 0.51 (0.08; 1.98) | 0.64 (0.12; 2.65) | .315 | 0.77 (0.44; 1.58) | 0.88 (0.28; 3.87) | .735 |
| Insulin (μIU/mL) | 10.00 (8.91; 19.73) | 5.33 (3.07; 6.13) | .054 | 7.91 (5.36; 10.59) | 7.06 (5.63; 10.37) | .768 |
| HOMA index | 1.91 (1.65; 4.55) | 1.13 (0.63; 1.40) | .001 | 2.00 (1.27; 2.84) | 1.39 (0.97; 1.98) | .017 |
| MDA (μM) | 0.41 (0.30; 0.58) | 0.43 (0.37; 0.48) | .371 | 0.58 (0.42; 0.74) | 0.42 (0.29; 0.49) | .001 |
HDL-C: high-density lipoprotein cholesterol; HOMA: homeostatic model assessment of insulin resistance; LDL-C: low-density lipoprotein cholesterol; MDA: malondialdehyde; hsCRP: high-sensitivity C-reactive protein; TG: triglycerides; VLDL-C: very low-density lipoprotein cholesterol.
The p-value results from comparing the baseline and final levels in the study group and the control group. The Mann-Whitney U test was used. Statistical significance was considered for P < .05.
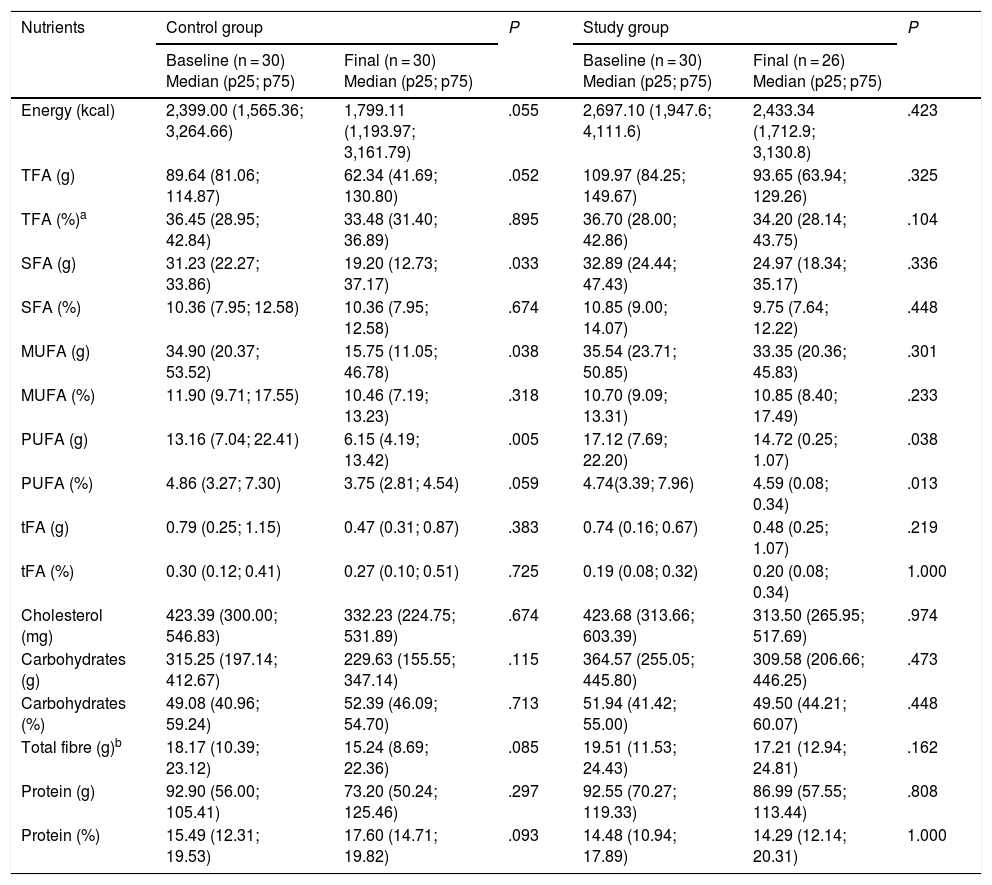
The diet of the participants showed no significant variations at the end of the study. However, the most relevant data were referred to the intake of total fatty acids, which was greater than the recommendation of 2%–30% daily, and to total fibre intake, which was lower than the 27−40 g daily advised by the World Health Organization (WHO),16 and the 25−35 g daily suggested by the American Dietetic Associatio.17 The data are shown in Table 3.
Distribution of nutrient intake in the control and study groups before and after the intervention.
| Nutrients | Control group | P | Study group | P | ||
|---|---|---|---|---|---|---|
| Baseline (n = 30) Median (p25; p75) | Final (n = 30) Median (p25; p75) | Baseline (n = 30) Median (p25; p75) | Final (n = 26) Median (p25; p75) | |||
| Energy (kcal) | 2,399.00 (1,565.36; 3,264.66) | 1,799.11 (1,193.97; 3,161.79) | .055 | 2,697.10 (1,947.6; 4,111.6) | 2,433.34 (1,712.9; 3,130.8) | .423 |
| TFA (g) | 89.64 (81.06; 114.87) | 62.34 (41.69; 130.80) | .052 | 109.97 (84.25; 149.67) | 93.65 (63.94; 129.26) | .325 |
| TFA (%)a | 36.45 (28.95; 42.84) | 33.48 (31.40; 36.89) | .895 | 36.70 (28.00; 42.86) | 34.20 (28.14; 43.75) | .104 |
| SFA (g) | 31.23 (22.27; 33.86) | 19.20 (12.73; 37.17) | .033 | 32.89 (24.44; 47.43) | 24.97 (18.34; 35.17) | .336 |
| SFA (%) | 10.36 (7.95; 12.58) | 10.36 (7.95; 12.58) | .674 | 10.85 (9.00; 14.07) | 9.75 (7.64; 12.22) | .448 |
| MUFA (g) | 34.90 (20.37; 53.52) | 15.75 (11.05; 46.78) | .038 | 35.54 (23.71; 50.85) | 33.35 (20.36; 45.83) | .301 |
| MUFA (%) | 11.90 (9.71; 17.55) | 10.46 (7.19; 13.23) | .318 | 10.70 (9.09; 13.31) | 10.85 (8.40; 17.49) | .233 |
| PUFA (g) | 13.16 (7.04; 22.41) | 6.15 (4.19; 13.42) | .005 | 17.12 (7.69; 22.20) | 14.72 (0.25; 1.07) | .038 |
| PUFA (%) | 4.86 (3.27; 7.30) | 3.75 (2.81; 4.54) | .059 | 4.74(3.39; 7.96) | 4.59 (0.08; 0.34) | .013 |
| tFA (g) | 0.79 (0.25; 1.15) | 0.47 (0.31; 0.87) | .383 | 0.74 (0.16; 0.67) | 0.48 (0.25; 1.07) | .219 |
| tFA (%) | 0.30 (0.12; 0.41) | 0.27 (0.10; 0.51) | .725 | 0.19 (0.08; 0.32) | 0.20 (0.08; 0.34) | 1.000 |
| Cholesterol (mg) | 423.39 (300.00; 546.83) | 332.23 (224.75; 531.89) | .674 | 423.68 (313.66; 603.39) | 313.50 (265.95; 517.69) | .974 |
| Carbohydrates (g) | 315.25 (197.14; 412.67) | 229.63 (155.55; 347.14) | .115 | 364.57 (255.05; 445.80) | 309.58 (206.66; 446.25) | .473 |
| Carbohydrates (%) | 49.08 (40.96; 59.24) | 52.39 (46.09; 54.70) | .713 | 51.94 (41.42; 55.00) | 49.50 (44.21; 60.07) | .448 |
| Total fibre (g)b | 18.17 (10.39; 23.12) | 15.24 (8.69; 22.36) | .085 | 19.51 (11.53; 24.43) | 17.21 (12.94; 24.81) | .162 |
| Protein (g) | 92.90 (56.00; 105.41) | 73.20 (50.24; 125.46) | .297 | 92.55 (70.27; 119.33) | 86.99 (57.55; 113.44) | .808 |
| Protein (%) | 15.49 (12.31; 19.53) | 17.60 (14.71; 19.82) | .093 | 14.48 (10.94; 17.89) | 14.29 (12.14; 20.31) | 1.000 |
MUFA: monounsaturated fatty acids; SFA: saturated fatty acids; PUFA: polyunsaturated fatty acids; TFA: total fatty acids, tFA: trans-fatty acids.
P-values are obtained on comparing baseline and final levels in the study and control groups. The Mann-Whitney U test was used. Statistical significance was considered for P < .05.
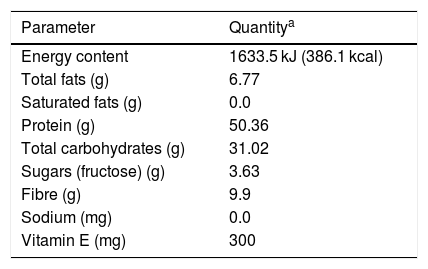
The labelling of the study food product offers nutritional information, indicating that it contains the following ingredients: legumes in powder form (soya [Glycine max], frijol bean [Phaseolus vulgaris], chickpea [Cicer arietinum ], lentils [Lens culinaris], faba bean [Vicia faba] and kidney bean [Phaseolus vulgaris]), vegetable fibre, fructose, cocoa, guar gum, carboxymethylcellulose, xanthan gum, cinnamon, silicon dioxide, lecithin, vitamin E acetate, sucralose and ethyl vanillin. Table 4 shows the nutritional information contained in the product labelling. It can be seen that the total protein and carbohydrate content corresponds to a little over 80% w/w of the product, while the fibre content practically reaches 10% w/w.
Nutritional information contained in the food product labelling.
| Parameter | Quantitya |
|---|---|
| Energy content | 1633.5 kJ (386.1 kcal) |
| Total fats (g) | 6.77 |
| Saturated fats (g) | 0.0 |
| Protein (g) | 50.36 |
| Total carbohydrates (g) | 31.02 |
| Sugars (fructose) (g) | 3.63 |
| Fibre (g) | 9.9 |
| Sodium (mg) | 0.0 |
| Vitamin E (mg) | 300 |
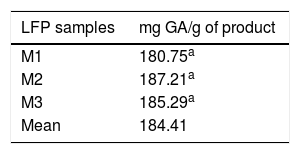
Table 5 shows the total polyphenol content in each of the three random samples of the food product. The mean value of these measurements was 184.41 mg of gallic acid equivalent per gram of product.
DiscussionIn recent years, and in coincidence with our own observations, a number of studies have reported a decrease in blood glucose levels with the consumption of legumes or dietary fibre. Among these studies, mention should be made of the article published by Simpson et al., who found that a diet high in carbohydrates and legume viscous fibre can improve glycemic control in both type 1 and type 2 diabetic patients.18 Yao et al. found fibre intake to decrease the risk of developing type 2 DM (T2DM). They suggested that the consumption of at least 25 g of dietary fibre daily could help prevent the development of T2DM.19 Chandalia et al. showed that a high fibre diet promotes glycemic control, decreasing hyperinsulinemic states and favouring a decrease in plasma lipid levels in patients with T2DM.20 Likewise, in 2013, Agrawal and Ebrahim reported that daily or weekly legume consumption is inversely associated to the presence of diabetes in a population in India. As they point out, however, further epidemiological research is needed to confirm this association.21 Other studies in the same line have related legume intake to a lower risk of developing diabetes.22–26
As regards the diet of the participants in our study, no significant differences in nutrient intake were seen before and after the intervention (Table 3). It should be noted that the control group showed a decrease in caloric intake of 600 kcal at the end of the study. However, this decrease only tended towards statistical significance (P = .055), in contrast to the situation in the study group (P = .44). With regard to the lack of correspondence in caloric intake in the control group, we believe that two factors may have exerted an influence. On one hand, the control group had no type of limitation in intake during the study, and on the other hand, the study ended at the close of the academic period: since these were individuals studying a career as demanding as Medicine, the control group very likely felt greater pressure as a result of their final examinations, and this could have influenced their caloric intake. It should be noted that the food frequency analysis did not include the intake of nutrients from the food product under study. The significant reductions in blood glucose and HOMA index recorded at the end of the intervention therefore could be explained at least in part by the intake of soluble fibre, which is abundant in legumes.21
In relation to the effect of the consumption of legumes upon the plasma levels of total cholesterol, LDL-C, triglycerides and HDL-C, a number of studies suggest that legumes, as part of the normal diet, exert beneficial effects upon the lipid profile, not only in diabetes, but also in individuals with metabolic syndrome and cardiovascular diseases.26 Such benefits include a reduction in total cholesterol, LDL-C and triglycerides,27 as well as an increase in HDL-C concentration,28 which was not evidenced in the present study. In contrast to the above information and in line with our own findings, Mackay and Ball reported no changes in the plasma concentrations of total cholesterol and LDL-C in hypercholesterolemic subjects consuming a diet rich in white beans and other legumes.29 However, in this study the group receiving the food product showed a decrease in serum LDL-C concentration from 123.6 mg/dl to 119.0 mg/dl at the end of the intervention—though the difference failed to reach statistical significance (P = .105).
On the other hand, with regard to the imbalance between antioxidant and oxidant species systemically present in the body—a phenomenon known as oxidative stress (OS)—it is now accepted that OS is responsible for an increase in undesirable processes that affect macromolecules such as proteins, lipids and DNA. Oxidative stress is associated to a large number of disorders, and particularly to chronic degenerative diseases such as T2DM, Parkinson’s disease, arterial hypertension, Alzheimer’s disease and atherosclerosis, to name but a few. In some cases OS has been identified as the causal agent of the disease, while in other cases it is a consequence of the disease.30 In recent years, a number of studies have shown that fruit and vegetable consumption can reduce morbidity and mortality due to such disease conditions, thanks to their high polyphenol content and protective effects as antioxidants.31,32
Polyphenols—particularly flavonoids and phenolic acids—are characterised by their wide distribution in foods commonly consumed by humans, such as fruit, vegetables and legumes, and by their important antioxidant properties.22,31,33 In addition, and mainly in soya, a number of isoflavones have been identified that exert significant inhibitory effects upon alpha-glucosidase. These isoflavones include genistein, daidzein and glycitein, which exert their effect in a dose-dependent manner—with genistein exhibiting the greatest inhibitory effect.34 This isoflavone has also been identified in frijol beans and lentils, and has been implicated in the improvement of glucose homeostasis, as reported by Squadrito et al.35 These authors, in a randomised, double-blind, controlled study involving the daily administration of 54 mg of genistin (the glycoside of genistein) during one year among 60 postmenopausal women with metabolic syndrome, observed a significant decrease in HOMA index at the end of the intervention. Despite the differences in trial design, these findings are consistent with those obtained in our study group.
In this same sense, it should be noted that the control group also showed a significant decrease in HOMA index (Table 2). However, it needs to be underscored that in this group four subjects had basal insulin levels > 20 μIU/mL, and three of them presented a baseline BMI of 30−32 kg/m2, which suggests that these individuals had insulin resistance. On recalculating the median HOMA scores before and after the intervention, without taking into account the data corresponding to these four subjects, the values were found to be 2.03 and 1.01, respectively. When compared using the Mann-Whitney U test, this resulted in P = .08.
The inhibitory effect of phytochemical extracts of isoflavones and soyasaponins upon alpha-glucosidase and alpha-amylase, as well as their hypoglycemic effect in DM, has been demonstrated in different animal models and with different designs.36–38 On the other hand, it has been seen that d-pinitol, an inositol derivative purified from soya, may be useful for controlling the postprandial increase in blood glucose in patients with T2DM.39
As regards the antioxidant properties of the study product, the quantification of its total polyphenol content using the Folin-Ciocalteu method yielded an mean of 184.06 ± 5.46 mg of gallic acid (GA) equivalent per gram of product. Based on this result, and in accordance with the recommended daily intake for this product (15 g/day), the subjects in the study group consumed a total amount of polyphenols of 2760 mg/day of GA equivalent during the intervention. This may explain our findings regarding the significant decrease in serum MDA levels at the end of the intervention.
Although little information is available on the intake of phenolic compounds from food, some authors suggest that polyphenol intake from the diet of some populations may range from 50 to 800 mg/day, depending on the consumption of the products containing them.40 However, a study conducted in a population in the United States found polyphenol intake to be 1000 mg/day,41 which can be achieved through a diet rich in fruit, vegetables and legumes, or by means of supplements providing this amount. It is important to mention that the consumption of other products with a good polyphenol content, such as cereals, tea, wine and coffee, also contribute to total polyphenol intake. In this regard, and based on the daily polyphenol intake found in the abovementioned United States population (1000 g/day), the daily consumption of 15 g of the food supplement evaluated in our study contributes more than twice this amount.
Limitations of the present study include the small sample size, the fact that subjects were not excluded based on BMI and insulin levels, and the fact that the food product was administered non-continuously during the intervention period (administration 5 days a week, with two days of rest, during three months). Nevertheless, despite these limitations, our study provides the basis for future research on the preparation, administration and effects of legumes as a dietary supplement upon oxidative stress marker levels and glycemic control.
ConclusionsThe daily administration of 15 g of a food supplement based on 6 legumes, during a period of three months, resulted in a significant decrease in blood glucose levels and insulin resistance (HOMA index) in the study sample, with no changes in insulin, hsCRP or the lipid profile, which could be attributed to legume contents referred to isoflavones such as genistein and total fiber. On the other hand, a significant decrease was observed in the levels of MDA, a lipoperoxidation marker associated to OS, which can be attributed to the consumption of 2760 mg of polyphenols of gallic acid (GA) equivalent contained in the daily portion of the product administered to the participants during the intervention. However, further studies involving larger sample sizes are needed to confirm these findings.
AuthorshipDr. Josefina Ruiz Esparza-Cisneros was involved in the design of the study, the application and processing of the food frequency survey before and after the intervention, the statistical analysis, preparation and administration of the supplement, and in writing and approval of the manuscript.
M.C. Javier de Jesús Vasconcelos-Ulloa participated in the standardization and performance of the laboratory tests (MDA, glucose and lipid profile), the literature search, and the writing of the results.
Dr. Daniel González-Mendoza participated in the quantification of total polyphenols in the dietary supplement and in the analysis of the results.
Dr. Guillermo Beltrán-González participated in the study design and collaborated in the analysis of the results.
Dr. Raúl Díaz-Molina participated in the study design, in standardization and performance of the laboratory tests (MDA, lipid profile, hsCRP, insulin and glucose), blood sample collection from the study subjects, and in writing and approval of the manuscript.
Financial supportThe present study was carried out with financial support from the National Council of Science and Technology of Mexico (Consejo Nacional de Ciencia y Tecnología de México [CONACYT]) through Innovation Stimulation Program 2015 (project no.: 221,394).
Conflicts of interestThe authors declare that they have no conflicts of interest.
The authors thank the voluntary participation of all the subjects included in the study. Thanks are also due to Dr. Isabel Campos-Cavada for her support in reviewing the draft of the manuscript.
Please cite this article as: Ruiz Esparza Cisneros J, Vasconcelos-Ulloa JJ, González-Mendoza D, Beltrán-González G, Díaz-Molina R. Efecto de una intervención dietética con un producto alimenticio a base de leguminosas sobre los niveles de malondialdehído, índice HOMA y perfil de lípidos. Endocrinol Diabetes Nutr. 2020;67:235–244.
