


To determine the sociodemographic and clinical profile of a representative sample of people with type 1 diabetes mellitus (DM1) in Spain and identify factors associated with glycemic control.
Material and methodsA cross-sectional observational study was carried out in adults and children with DM1 treated in 75 Spanish public hospitals, geographically distributed in order to be representative of the Spanish population. Within each center, the patients were included on a consecutive basis as they visited the clinic. They were interviewed, and their clinical histories were reviewed. A descriptive statistical analysis was made, and factors associated with HbA1c were analysed using multivariate linear regression analysis.
ResultsA total of 647 patients were included: 55.3% females, aged 36.6 ± 14.4 years, 97.2% Caucasians, BMI 24.7 ± 4.4 kg/m2 (12.1% ≥ 30 kg/m2), and 74.0% had secondary / university education. A total of 20.2% were active smokers. The mean time from the diagnosis of DM1 was 17.9 ± 12.0 years. A total of 48.7% presented comorbidities: 19.3% retinopathy and 16.4% hypothyroidism. As regards treatment for DM1, 76.5% received basal-bolus insulin therapy and 20.7% continuous subcutaneous insulin infusion (CSII); 51.0% of the patients used an insulin/carbohydrate ratio (ICR), with 4.6 ± 1.6 self-monitored capillary blood glucose (SMCBG) measurements a day, and 24.8% used continuous glucose monitoring (CGM). The mean HbA1c value was 7.6 ± 1.1% (30% below 7%). Metabolic control improved (lower HbA1c) with more daily SMCBG (B = −0.053; p = 0.009), a higher educational level (B = 0.461; P < 0.001), greater number of hypoglycemia episodes (B = −0.253; P = 0.018) and carbohydrate counting (B = −0.190; P = 0.048), and worsened the longer the duration of the disease (B = 0.010; P = 0.010), higher total dose of insulin (B = 0.010; P < 0.0001), poorer adherence to diet (B = 0.650; P < 0.0001) and a family history of DM (B = −0.233; P = 0.007).
ConclusionsThe management of patients with DM1 in Spain, as well as the treatment they receive, is similar to that seen in other Western countries. Blood glucose control is associated with educational level, disease duration, and the characteristics of treatment and self-care.
Conocer el perfil sociodemográfico y clínico en una muestra representativa de personas con diabetes mellitus tipo 1 (DM1) en España e identificar factores asociados con el control glucémico.
Material y métodosEstudio observacional, transversal en adultos y niños con DM1 tratados en las consultas de 75 hospitales públicos españoles, distribuidos geográficamente para ser representativos de la población española. Dentro de cada centro, los pacientes fueron incluidos de forma consecutiva según acudían a consulta. Se les entrevistó y se revisaron sus historias clínicas. Se realizó un análisis estadístico descriptivo y se analizaron los factores asociados con la HbA1c utilizando un análisis de regresión lineal multivariante.
ResultadosSe incluyeron 647 pacientes: 55,3% mujeres, edad 36,6 ± 14,4 años, 97,2% caucásicos, IMC 24,7 ± 4,4 kg/m2 (12,1% ≥ 30 kg/m2) y 74,0% tenía estudios secundarios/ universitarios. El 20,2% eran fumadores activos. El tiempo medio desde el diagnóstico de DM1 fue 17,9 ± 12,0 años. Un 48,7% presentaban comorbilidades: un 19,3% retinopatía y un 16,4% hipotiroidismo. Respecto al tratamiento para la DM1, 76,5% usaban insulinoterapia basal-bolo y 20,7% infusión subcutánea continua de insulina (ISCI); 51,0% de los pacientes utilizaban una ratio insulina/carbohidratos (ICR), realizaban 4,6 ± 1,6 autoanálisis de glucemia capilar (AAGC) diaria y 24,8% utilizaba monitorización continua de glucosa (MCG). El valor medio de HbA1c fue 7,6 ± 1,1% (30% inferior a 7%). El control metabólico fue mejor (menor HbA1c) a mayor número de AAGC diarios (B = −0,053; p = 0,009), mayor nivel de estudios (B = 0,461; p < 0,001), mayor número de hipoglucemias (B = −0,253; p = 0,018) y la realización de contaje de carbohidratos (B = −0,190; p = 0,048), y peor a mayor duración de la enfermedad (B = 0,010; p = 0,010), mayor dosis total de insulina (B = 0,010; p < 0,0001), peor adherencia a la dieta (B = 0.650; p < 0,0001) y con antecedentes familiares de DM (B = −0,233; p = 0,007).
ConclusionesEl manejo de pacientes DM1 en España, así como el tratamiento que reciben, es similar al observado en otros países occidentales. El control glucémico está asociado al nivel de estudios, la duración de la enfermedad y características del tratamiento y autocuidado.
Type 1 diabetes mellitus (T1DM) is characterised by an absolute or near-absolute insulin deficiency such that patients require a daily supply of exogenous insulin. Europe has one of the highest rates of T1DM incidence in children, with an estimated 21,600 new cases per year.1 There are few incidence and prevalence studies with up-to-date data in Spain; however, it can be estimated that the incidence is around 11–15 cases per 100,000 population under 15 years of age2–4 and the prevalence would be 0.08%–0.2%.5
T1DM is associated with a substantially higher risk of premature death compared to the general population.6 Among people with diabetes under 30 years of age, excess mortality is largely explained by acute complications of diabetes, including diabetic ketoacidosis and hypoglycaemia.7–9 Cardiovascular disease is, however, the leading cause of death.7–10
The goals of T1DM management were initially established in 1993 by the Diabetes Control and Complications Trial (DCCT).11 It is important to keep blood glucose levels in a near-normal range to prevent long-term microvascular and macrovascular complications.12,13 However, this landmark study showed that recurring episodes of hypoglycaemia constitute a fundamental limitation for achieving intensive control objectives; hence, a relatively low percentage of people with T1DM achieve the recommended glycated haemoglobin (HbA1c) levels.14 Other factors could also influence ongoing blood glucose control: age, motivation, compliance, knowledge of diabetes and diabetes management skills.15
An HbA1c <7% is accepted as a general goal for blood glucose control.16 The current strategy for achieving blood glucose control and keeping HbA1c at these levels is imitating normal insulin secretion with either continuous subcutaneous insulin infusion (CSII) or multiple doses of insulin (MDI).
Different studies conducted in Spain have identified variables related to metabolic control in patients with T1DM: a study by Gómez-Peralta et al. identified matters such as poor diet adherence, frequency of self-monitoring of blood glucose (SMBG) and physical activity as variables linked to metabolic control,17 while Amor et al. reported that the prevalence of cardiovascular complications decreased in patients with T1DM after a specific follow-up programme.18 The objective of this study was to describe the management and clinical situation of the population with T1DM in Spain, as well as possible factors linked to the metabolic control of the disease.
Material and methodsType of designThis was a cross-sectional, multicentre, observational, non-interventional study with retrospective data collection on a nationally representative sample of adults and children with T1DM treated at the practices of endocrinologists belonging to the SED, from 75 public hospitals in Spain, under routine clinical practice conditions (Supplementary materials Tables S1–S2). The study was classified by the Agencia Española de Medicamentos y Productos Sanitarios [Spanish Agency of Medicines and Medical Devices] (AEMPS) and approved by the Institutional Review Board (IRB) of the participating sites.
Study populationThe sample size had to be sufficient to describe the sociodemographic and clinical profile of patients with T1DM. As it was based on a description of the study population, the minimum sample size required to estimate any dichotomous variables that might appear with a probability of 0.50 (value requiring the maximum sample size) was calculated. Assuming a total Spanish population size of 46,454,535 inhabitants (according to Instituto Nacional de Estadística [Spanish National Statistics Institute] (INE) data from 01/07/2016), with a prevalence of T1DM of 0.1%, the population of patients with T1DM was estimated at 46,455. To estimate dichotomous variables with a p of 0.5, an accuracy of 0.04 and a level of significance of 0.05, a sample of at least 594 adult patients with T1DM had to be included. Supplementary materials Table S3 describes the approximate distribution of participating sites by Autonomous Community (AC) and estimation of patients to be included at each site to maintain the geographic distribution of the Spanish population.
A total of 75 selected clinical sites took part in the study, with AC-level representativeness taken into account, thus providing representation of paediatric and adult patients with T1DM and covering the minimum sample required. Each site had to consecutively include a certain number of adult patients with T1DM, and paediatric sites had to include at least four patients, to maintain geographic representativeness.
Patients had to meet the following criteria: patients diagnosed with T1DM, with a medical record at the site, with at least 2 HbA1c values available in the study visit and written informed consent granted by patients themselves in the case of adults or parents/guardians in the case of minor participants. Patients with a diagnosis of type 2 diabetes mellitus (T2DM) and patients with a history of pancreas and/or islet cell transplantation were excluded.
Study variablesThe information for the variables described below was obtained through medical records or directly from patients during the study visit.
Variables obtained through medical recordsAge, gender, height, weight, waist circumference, blood pressure, heart rate, family history, relative's age at diagnosis, T1DM, T2DM, early cardiovascular disease, adrenal insufficiency, hypothyroidism, hyperthyroidism, date of T1DM diagnosis, diabetes education (received: yes/no), source (multidisciplinary team, endocrinologist, dietician, nursing, primary care), content (T1DM information, diet, exercise), self-management of blood glucose (SMBG) (performance/interpretation), care/hygiene, self-adjustment of insulin doses and materials used (in-person sessions, leaflets, Internet, associations, communication media), presence of hypertension (date of diagnosis and drug treatment) and hyperlipidaemia (date of diagnosis and need for drug treatment), comorbidities and complications associated with T1DM (micro- and macroangiopathic complications, other autoimmune diseases), lipid panel (total cholesterol, triglycerides, HDL and LDL), vaccination, hospitalisations in the past 12 months (number of admissions, reason) and visits related to T1DM, frequency of laboratory tests and values, and cardiovascular risk factors.
Variables obtained by patient survey/clinical assessmentRace (Caucasian/white, black, Asian), level of education (no education, primary education, secondary education, university education or similar), suitability/frequency of SMBG (preprandial and postprandial target glucose range; performance of blood glucose checks and daily frequency), continuous glucose sensor (frequency of daily or seasonal use), data from the latest blood glucose check (2 latest blood glucose panels performed in the past 15 days), recommended eating plan (yes/no, calories per day, meals per day and use of carbohydrate counting), subjective diet adherence (very good, good, fair, poor, very poor), episodes of hypoglycaemia in the month prior to the study visit and type (symptomatic/asymptomatic), tobacco and alcohol use, and treatment at the time of the visit (treatment with insulin and concomitant treatment). The following were recorded: type and number of insulin injections, basal and rapid-acting insulin, method of administration (basal-bolus insulin therapy, premixed insulin, continuous infusion pump), number of units of basal insulin (morning, afternoon, night), use of adjustment for insulin-to-carbohydrate ratio, corrective doses and calculated insulin sensitivity factor. To analyse the effects of diabetes education and insulin treatment adherence considered optimal on an international level, these three characteristics (use of insulin-to-carbohydrate ratio, carbohydrate counting and calculation of insulin sensitivity factor) were grouped and jointly deemed “use of advanced treatment with insulin”.
All this information was included by the investigators in an electronic case report form (CRF) expressly designed for this study.
Data analysis managementData are summarised in terms of means ± SDs or percentages. For analysis of metabolic control the mean of the two HbA1c values was used. The following age groups were described separately: 0−13, 14−17, 18−25 and 26−49 years of age. The relationship between HbA1c level and presence of hypoglycaemia was analysed with the following variables: carbohydrate counting, use of insulin-to-carbohydrate ratio and calculation of insulin sensitivity factor. When these three conditions were met at the same time, they were considered a single variable, "use of advanced treatment with insulin", and jointly analysed for each patient included.
Comparative analyses were performed using the Mann–Whitney U test or Friedman test on continuous variables, and the chi-squared test on categorical variables. A multivariate regression model was prepared by including the factors that previously obtained a p value <0.1 in the univariate analysis and applying a stepwise selection method to arrive at the final model.
In all the statistical tests performed with the endpoints, a level of statistical significance of 0.05 was used. The statistical software package SAS®, version 9.4 for Windows®, was used for data analysis.
ResultsDescription of the study populationA total of 650 patients were included consecutively: three of the patients did not meet the criterion of having at least two HbA1c levels prior to the visit, and so, ultimately, the total number of eligible patients with T1DM was 647.
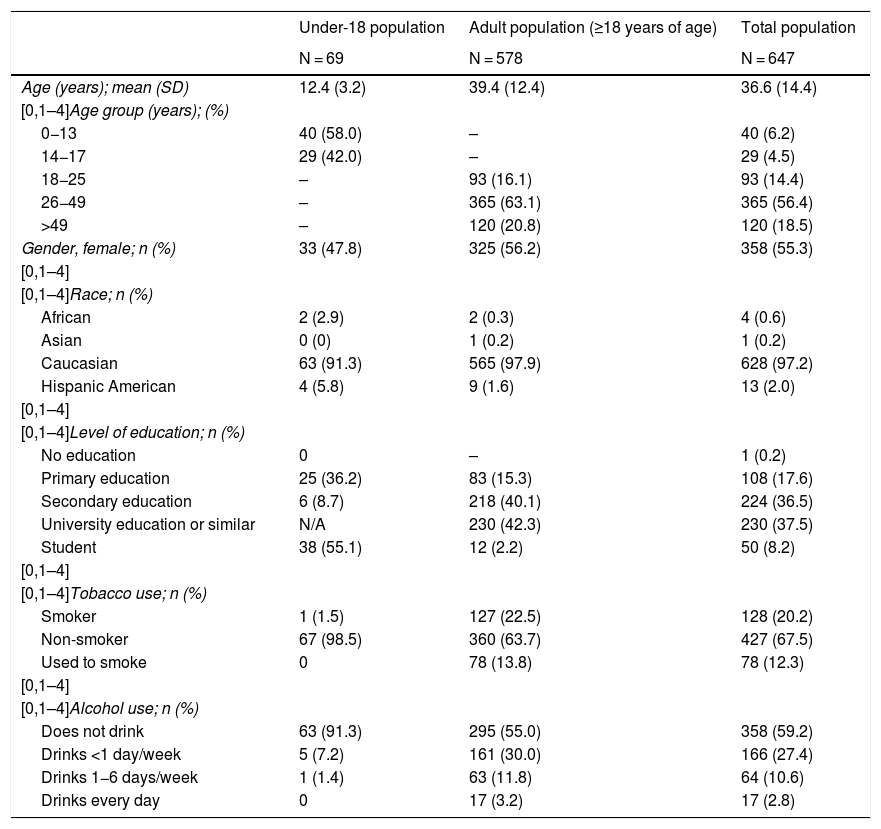
Demographic, personal and family history dataTable 1 summarises the demographic data for the sample: 69 patients <18 years of age (mean age: 12.4 ± 3.2 years) and 578 patients ≥18 years of age (39.4 ± 12.4 years of age). Of the patients, 55.3% were women and 97.2% were Caucasian. The adult population had a rate of university education or similar of 42.3%. Smokers accounted for 20.2% of the population. Patients had a family history of T2DM in 33.4% of cases, a family history of T1DM in 26.1% of cases and a family history of hypothyroidism in 17.2% of cases (Table 2).
Demographic variables of the study population.
| Under-18 population | Adult population (≥18 years of age) | Total population | |
|---|---|---|---|
| N = 69 | N = 578 | N = 647 | |
| Age (years); mean (SD) | 12.4 (3.2) | 39.4 (12.4) | 36.6 (14.4) |
| [0,1–4]Age group (years); (%) | |||
| 0−13 | 40 (58.0) | – | 40 (6.2) |
| 14−17 | 29 (42.0) | – | 29 (4.5) |
| 18−25 | – | 93 (16.1) | 93 (14.4) |
| 26−49 | – | 365 (63.1) | 365 (56.4) |
| >49 | – | 120 (20.8) | 120 (18.5) |
| Gender, female; n (%) | 33 (47.8) | 325 (56.2) | 358 (55.3) |
| [0,1–4] | |||
| [0,1–4]Race; n (%) | |||
| African | 2 (2.9) | 2 (0.3) | 4 (0.6) |
| Asian | 0 (0) | 1 (0.2) | 1 (0.2) |
| Caucasian | 63 (91.3) | 565 (97.9) | 628 (97.2) |
| Hispanic American | 4 (5.8) | 9 (1.6) | 13 (2.0) |
| [0,1–4] | |||
| [0,1–4]Level of education; n (%) | |||
| No education | 0 | – | 1 (0.2) |
| Primary education | 25 (36.2) | 83 (15.3) | 108 (17.6) |
| Secondary education | 6 (8.7) | 218 (40.1) | 224 (36.5) |
| University education or similar | N/A | 230 (42.3) | 230 (37.5) |
| Student | 38 (55.1) | 12 (2.2) | 50 (8.2) |
| [0,1–4] | |||
| [0,1–4]Tobacco use; n (%) | |||
| Smoker | 1 (1.5) | 127 (22.5) | 128 (20.2) |
| Non-smoker | 67 (98.5) | 360 (63.7) | 427 (67.5) |
| Used to smoke | 0 | 78 (13.8) | 78 (12.3) |
| [0,1–4] | |||
| [0,1–4]Alcohol use; n (%) | |||
| Does not drink | 63 (91.3) | 295 (55.0) | 358 (59.2) |
| Drinks <1 day/week | 5 (7.2) | 161 (30.0) | 166 (27.4) |
| Drinks 1−6 days/week | 1 (1.4) | 63 (11.8) | 64 (10.6) |
| Drinks every day | 0 | 17 (3.2) | 17 (2.8) |
N/A: not applicable; SD: standard deviation.
Clinical and T1DM characteristics of the study population.
| Under-18 population | Adult population (≥18 years of age) | Overall population | |
|---|---|---|---|
| N = 69 | N = 578 | N = 647 | |
| Height (m); mean (SD) | 153.78 (18.3) | 167.50 (9.0) | 166.03 (11.2) |
| Weight (kg); mean (SD) | 49.65 (17.1) | 71.03 (13.7) | 68.75 (15.6) |
| BMI (kg/m2); mean (SD) | 20.25 (3.8) | 25.27 (4.2) | 24.73 (4.4) |
| [0,1–4]Classes of BMI; n (%) | |||
| <18.5 kg/m2 | 24 (34.8) | 8 (1.4) | 32 (5.0) |
| 18.5−24.9 kg/m2 | 38 (55.1) | 314 (54.8) | 352 (54.8) |
| 25−26.9 kg/m2 | 4 (5.8) | 92 (16.1) | 96 (15.0) |
| 27−29.9 kg/m2 | 1 (1.4) | 83 (14.5) | 84 (13.1) |
| ≥30 kg/m2 | 2 (2.9) | 76 (13.3) | 78 (12.1) |
| Waist circumference (cm); mean (SD) | 67.15 (9.0) | 87.35 (12.8) | 85.05 (14.1) |
| Normal: adults ≤80 women ≤94 men; n (%) | N/A | 111 (52.9) | 111 (52.9) |
| Abnormal: adults >80 women >94 men; n (%) | N/A | 99 (47.1) | 99 (47.1) |
| SBP (mmHg); mean (SD) | 108.95 (12.3) | 124.47 (15.9) | 122.86 (16.2) |
| DBP (mmHg); mean (SD) | 64.47 (7.0) | 73.51 (9.1) | 72.57 (9.3) |
| Heart rate in beats per minute; mean (SD) | 78.48 (13.0) | 77.67 (12.3) | 77.76 (12.3) |
| [0,1–4] | |||
| [0,1–4]Family history; n (%) | |||
| T1DM | 13 (19.1) | 114 (22.0) | 127 (21.6) |
| T2DM | 16 (23.5) | 180 (34.7) | 196 (33.4) |
| Hypothyroidism | 11 (16.2) | 90 (17.3) | 101 (17.2) |
| Years since T1DM diagnosis; mean (SD) | 4.7 ± 3.4 | 19.5 ± 11.7 | 17.9 ± 12.0 |
| Age at diagnosis; mean (SD) | 7.5 ± 4.0 | 20.1 ± 12.1 | 18.7 ± 12.1 |
| [0,1–4] | |||
| [0,1–4]HbA1c; mean ± standard deviation (%) | |||
| Latest level | 7.5 ± 1.1 | 7.6 ± 1.1 | 7.6 ± 1.1 |
| Latest two levels | 7.6 ± 0.9 | 7.6 ± 1.1 | 7.6 ± 1.1 |
BMI: body mass index; DBP: diastolic blood pressure; HbA1c: glycated haemoglobin; SBP: systolic blood pressure; SD: standard deviation; T1DM: type 1 diabetes mellitus; T2DM: type 2 diabetes mellitus.
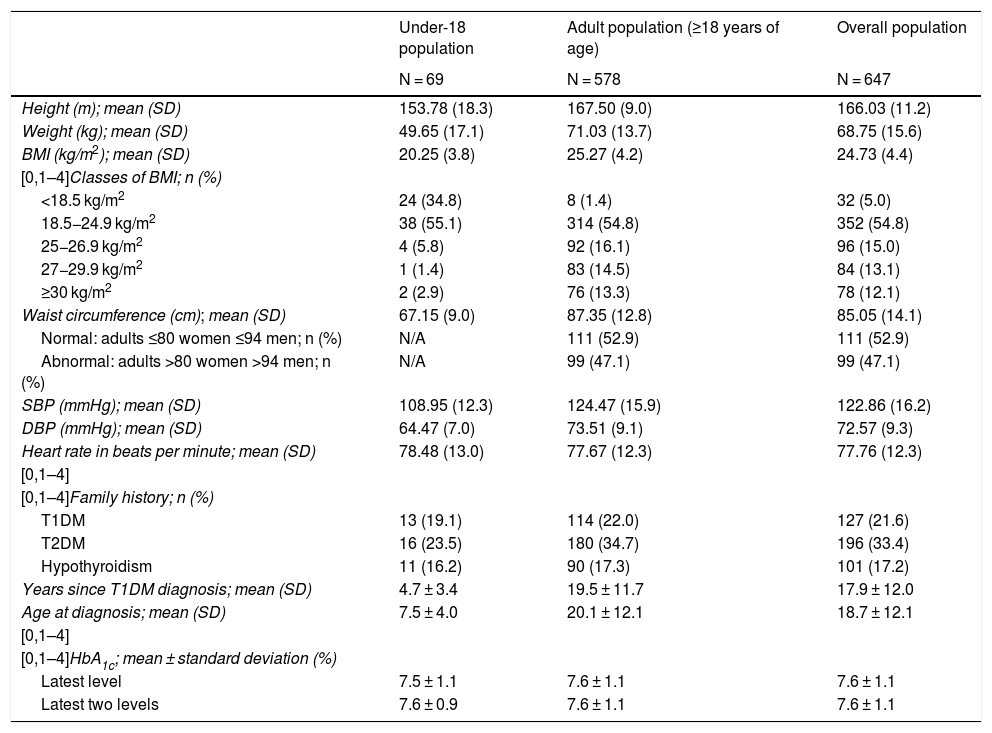
Overweight or obesity (BMI > 25 kg/m2) was present in 43.9% of adults (>18 years of age).
Characteristics of diabetes mellitus and comorbiditiesMean (SD) age at diagnosis was 18.7 ± 12.1 years and mean time since diagnosis of T1DM was 17.9 ± 12.0 years (4.7 ± 3.5 in patients <18 years of age and 19.5 ± 11.7 in adult patients). More than half the adult population (52.9%) had at least one comorbidity and/or complication associated with T1DM, with retinopathy being the most common (21.6%), followed by hypothyroidism (18.2%) and dyslipidaemia (14.2%). In the population <18 years of age, the most common comorbidity was coeliac disease, present in 7.2%. Concomitant treatment was being received at the time of the study visit by 49.2% of the sample (Supplementary materials Table S4 and laboratory and capillary blood glucose panel data, Tables S5 and S6).
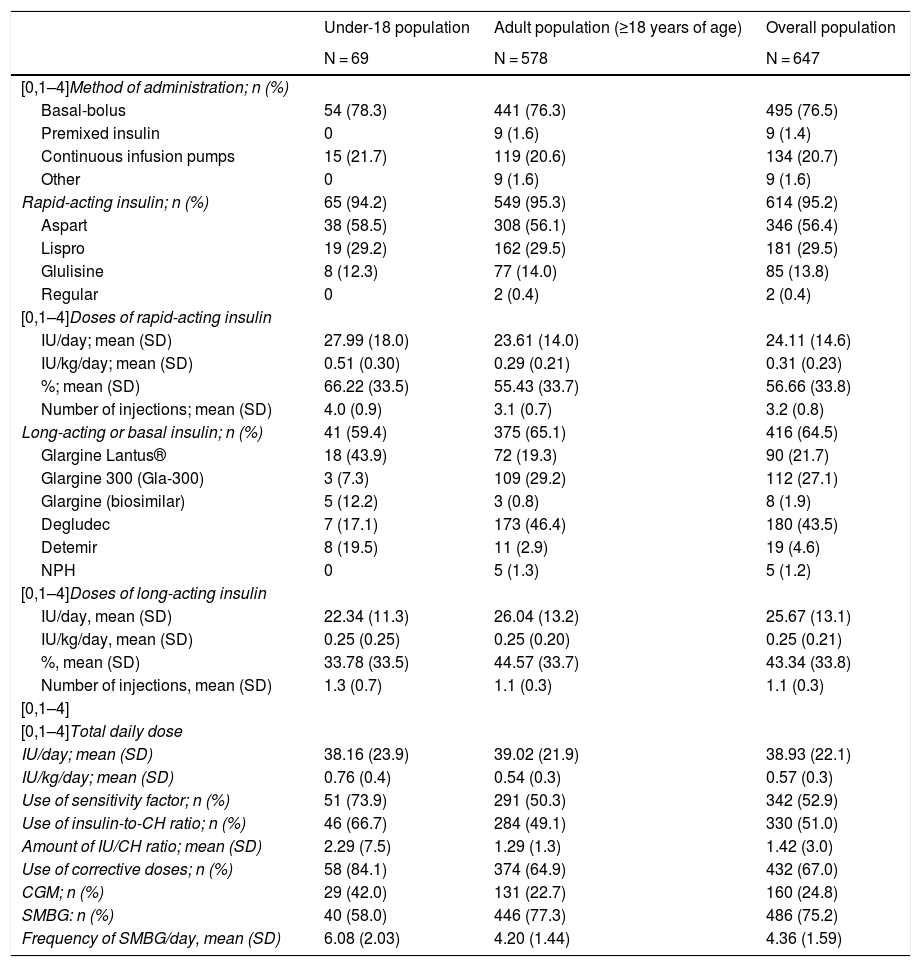
Insulin treatmentThe most common method of insulin administration in the overall population was basal-bolus insulin therapy (76.5%), followed by CSII (20.7%) and premixed insulin (1.4%). This distribution was also maintained when a distinction was made between adult patients and patients under 18 years of age (Table 3).
Treatments with insulin.
| Under-18 population | Adult population (≥18 years of age) | Overall population | |
|---|---|---|---|
| N = 69 | N = 578 | N = 647 | |
| [0,1–4]Method of administration; n (%) | |||
| Basal-bolus | 54 (78.3) | 441 (76.3) | 495 (76.5) |
| Premixed insulin | 0 | 9 (1.6) | 9 (1.4) |
| Continuous infusion pumps | 15 (21.7) | 119 (20.6) | 134 (20.7) |
| Other | 0 | 9 (1.6) | 9 (1.6) |
| Rapid-acting insulin; n (%) | 65 (94.2) | 549 (95.3) | 614 (95.2) |
| Aspart | 38 (58.5) | 308 (56.1) | 346 (56.4) |
| Lispro | 19 (29.2) | 162 (29.5) | 181 (29.5) |
| Glulisine | 8 (12.3) | 77 (14.0) | 85 (13.8) |
| Regular | 0 | 2 (0.4) | 2 (0.4) |
| [0,1–4]Doses of rapid-acting insulin | |||
| IU/day; mean (SD) | 27.99 (18.0) | 23.61 (14.0) | 24.11 (14.6) |
| IU/kg/day; mean (SD) | 0.51 (0.30) | 0.29 (0.21) | 0.31 (0.23) |
| %; mean (SD) | 66.22 (33.5) | 55.43 (33.7) | 56.66 (33.8) |
| Number of injections; mean (SD) | 4.0 (0.9) | 3.1 (0.7) | 3.2 (0.8) |
| Long-acting or basal insulin; n (%) | 41 (59.4) | 375 (65.1) | 416 (64.5) |
| Glargine Lantus® | 18 (43.9) | 72 (19.3) | 90 (21.7) |
| Glargine 300 (Gla-300) | 3 (7.3) | 109 (29.2) | 112 (27.1) |
| Glargine (biosimilar) | 5 (12.2) | 3 (0.8) | 8 (1.9) |
| Degludec | 7 (17.1) | 173 (46.4) | 180 (43.5) |
| Detemir | 8 (19.5) | 11 (2.9) | 19 (4.6) |
| NPH | 0 | 5 (1.3) | 5 (1.2) |
| [0,1–4]Doses of long-acting insulin | |||
| IU/day, mean (SD) | 22.34 (11.3) | 26.04 (13.2) | 25.67 (13.1) |
| IU/kg/day, mean (SD) | 0.25 (0.25) | 0.25 (0.20) | 0.25 (0.21) |
| %, mean (SD) | 33.78 (33.5) | 44.57 (33.7) | 43.34 (33.8) |
| Number of injections, mean (SD) | 1.3 (0.7) | 1.1 (0.3) | 1.1 (0.3) |
| [0,1–4] | |||
| [0,1–4]Total daily dose | |||
| IU/day; mean (SD) | 38.16 (23.9) | 39.02 (21.9) | 38.93 (22.1) |
| IU/kg/day; mean (SD) | 0.76 (0.4) | 0.54 (0.3) | 0.57 (0.3) |
| Use of sensitivity factor; n (%) | 51 (73.9) | 291 (50.3) | 342 (52.9) |
| Use of insulin-to-CH ratio; n (%) | 46 (66.7) | 284 (49.1) | 330 (51.0) |
| Amount of IU/CH ratio; mean (SD) | 2.29 (7.5) | 1.29 (1.3) | 1.42 (3.0) |
| Use of corrective doses; n (%) | 58 (84.1) | 374 (64.9) | 432 (67.0) |
| CGM; n (%) | 29 (42.0) | 131 (22.7) | 160 (24.8) |
| SMBG: n (%) | 40 (58.0) | 446 (77.3) | 486 (75.2) |
| Frequency of SMBG/day, mean (SD) | 6.08 (2.03) | 4.20 (1.44) | 4.36 (1.59) |
CGM: continuous glucose monitoring; CH: carbohydrates; CSII: continuous subcutaneous insulin infusion; IU: insulin units; NPH: intermediate-acting insulin; SD: standard deviation; SMBG: self-management of blood glucose.
Of the patients who used basal-bolus insulin therapy, 95.2% received treatment with rapid-acting insulin, with a mean dose of 24.1 ± 14.6 U/day and a mean of 3.2 ± 0.8 injections. Aspart (56.4%) and lispro (29.5%) were the most commonly administered rapid-acting insulins. The mean dose of long-acting insulin in basal-bolus treatment was 25.7 ± 13.10 U/day, and the mean number of injections was 1.1 ± 0.3. Degludec (43.5%) followed by glargine U300 (21.7%) were the most commonly administered long-acting insulins. Patients under 18 years of age used rapid-acting versus long-acting insulin in a higher proportion (66.2%) than the adult population (55.3%).
Corrective doses of insulin were used by 67.0% of the overall population (mean: 1 IU per 54 mg/dl of excess blood glucose). Of the patients in the population, 51% used an insulin-to-carbohydrate ratio for adjustment: the mean (SD) dose of IU/carbohydrate ratio was 1.4 ± 3.0.
Blood glucose monitoringDaily SMBG was performed by 75.2% of the patients (with a mean ± SD frequency of 4.36 ± 1.59 checks per day), and regular HbA1c checks were performed by 98.8%.
Some sort of continuous glucose monitoring (CGM) was used by 24.8% of the patients; 40.3% were treated with CSII and 20.5% used basal-bolus insulin therapy (Supplementary materials Fig. S1).
Nutrition managementAmong the patients, 81.5% had received an eating plan recommended by their medical team, and 67.2% were considered to have good or very good diet adherence.
Analysis of metabolic controlGlycated haemoglobinThe mean of the two most recent HbA1c determinations in the study population was 7.6% ± 1.1% (7.6% ± 0.9% in the population <18 years of age and 7.6% ± 1.1% in adults). Of the total sample included in the study, 29.7% had HbA1c levels <7%. Fig. 1 describes the distribution of the population by HbA1c range and age group.
 and adults (≥18 years of age).")
Metabolic control was linked to a higher level of education (p < 0.0001) (Fig. 2A).

In general, patients who used CSII showed better blood glucose control, except in the 14−17 age group, where the mean HbA1c in the basal-bolus group was lower (7.9% versus 8.4%) (Fig. 2B). This group also showed a general increase in mean HbA1c levels compared to all other age groups. The difference in HbA1c with the use of CSII achieved statistical significance only in the adult population (7.3% ± 0.7% versus 7.7% ± 1.1%; p < 0.005).
HbA1c levels were significantly lower in adult patients who used CGM than in those who used SMBG: 7.5% versus 7.6% in patients under 18 years of age (p = 0.995) and 7.3% versus 7.6% in adult patients (p = 0.002). By age groups, patients 14−17 years of age had higher mean HbA1c levels, regardless of their use of CGM (8.1%) or SMBG (7.8%), compared to other groups. By contrast, the group of patients 26−49 years of age showed greater differences in HbA1c levels (p < 0.001) depending on whether they used CGM (7.2%) or SMBG (7.6%) (Fig. 2C).
The greater the frequency of SMBG, the lower the HbA1c level observed: 8.0% with 0–3 checks per day, 7.5% with 4–6 checks per day and 7.1% with 7–9 checks per day (p < 0.0001). Statistical significance was maintained in the separate analysis of the adult population (p < 0.0001) (Fig. 2D).
Fig. 3 describes the HbA1c levels in the adult population and in the population <18 years of age, according to total insulin dose. In the adult population, statistically significant differences were seen (p < 0.0001) in HbA1c control according to amount of insulin used (both by insulin units per day and by insulin units per kilogram per day), with mean HbA1c levels of 7.3, 7.7 and 8.1 for <30, 30–60 and >60 units per day, and 7.3, 7.4 and 7.9 for 0−0.2, 0.2−0.6 and >0.6 units per kilogram per day, respectively. By contrast, no correlation was seen between proportion of rapid-acting/long-acting insulin and HbA1c levels (Pearson’s r = −0.041 and p = 0.341 in adult patients and Pearson’s r = −0.050 and p = 0.326 in patients under 18 years of age).
Episodes of hypoglycaemia
Episodes of hypoglycaemia in the month prior to the study visit were reported by 78.3% of the study population; most (84.6%) were symptomatic. By study population, 78.6% of patients under 18 years of age and 81.1% of adult patients with HbA1c levels <7% had episodes of hypoglycaemia.
No statistically significant (p = 0.921) relationship was observed between the insulin dose cut-off points and the presence of hypoglycaemia (Fig. 4).

In addition, no statistically significant relationship was seen in either of the two study populations between the presence of hypoglycaemia and the use of CSII or basal-bolus insulin therapy (p = 0.544 in patients under 18 years of age and p = 0.168 in adults), with the use of CGM or SMBG (p = 0.809 in patients under 18 years of age and p = 0.125 in adult patients).
Association of diabetes education factors with glycated haemoglobin levels and presence of hypoglycaemiaSignificantly lower HbA1c levels were seen in the adult population who used carbohydrate counting compared to the adult population who did not (7.3% ± 1.0% versus 7.7% ± 1.1%; p = 0.0037).
No relationship was seen between the use of carbohydrate counting (p = 0.467 in patients under 18 years of age and p = 0.302 in adult patients) and the presence of hypoglycaemia.
A statistically significant relationship was seen between the use of an insulin-to-carbohydrate ratio for adjustment and lower HbA1c levels both in the population under 18 years of age (7.4%±0.8% versus 8.0%±1.1%; p = 0.014) and in the population over 18 (7.4%±0.9% versus 7.8%±1.2%; p < 0.0001), and on analysing the total population (p < 0.0001). However, a greater presence of hypoglycaemia was seen in the adult population in those who used an insulin-to-carbohydrate ratio for adjustment (83.5%) versus those who did not (74.6%) (p = 0.009).
Lower HbA1c levels were seen in patients who calculated insulin sensitivity factor (7.4%±1.0% versus 7.6%±1.2%; p = 0.0273, in the total population). The presence of hypoglycaemia in those who calculated insulin sensitivity factor was greater: 83.6% versus 74.1% in the adult population (p = 0.005) and 82.2% versus 74.0% in the total population (p = 0.012).
When these three characteristics (carbohydrate counting, use of an insulin-to-carbohydrate ratio and calculation of insulin sensitivity factor) were grouped and jointly deemed "use of advanced treatment with insulin", a statistically significant relationship with HbA1c levels was observed in the total population: "advanced treatment with insulin" was associated with lower HbA1c levels (7.4%±1.0% versus 7.6%±1.1%; p = 0.041). However, a relationship was seen between use of advanced treatment with insulin and a higher percentage of hypoglycaemia in the adult population (89.3%) versus non-use of advanced treatment with insulin (77.8%) (p = 0.045).
Multiple linear regression analysis of variables related to metabolic controlThe multiple linear regression model in adults included the following variables: age, level of education, BMI, time since diagnosis, family history, HTN, hyperlipidaemia, diet adherence, number of self-checks performed, episodes of hypoglycaemia, infusion pump, CGM, insulin ratio, insulin dose, carbohydrate counting plan, use of sensitivity factor and use of treatment with advanced insulin.
HbA1c was lower with a higher frequency of daily SMBG (B = −0.053; p = 0.009), a higher level of education (university education versus primary education [B = 0.461; p < 0.001]), more episodes of hypoglycaemia in the past 12 months (B = −0.253; p = 0.018) and carbohydrate counting (B = −0.190; p = 0.048).
Metabolic control was worse (higher HbA1c) with a higher number of years elapsed since T1DM diagnosis (B = 0.010; p = 0.010), a higher total insulin dose (B = 0.010; p < 0.0001), poor diet adherence (B = 0.650; p < 0.0001) and a family history of DM (B = −0.233; p = 0.007).
DiscussionFew descriptive studies have been conducted in a Spanish population with T1DM in clinical practice. The results of the SED1 study provide descriptive information on metabolic control and the management of the disease.
The overall blood glucose control (HbA1c) data in the Spanish population with T1DM are similar to those reported in other European populations19 and American populations.20 Our results indicate that lower HbA1c levels are associated with the presence of hypoglycaemia. This should not be interpreted to mean that people with T1DM can feel free of this risk by keeping their HbA1c levels above the recommended targets.
However, no statistically significant relationship was seen between the use of CSII or CGM and the presence of hypoglycaemia. Unfortunately, the results of this study even indicate that measures particular to advanced insulin treatment (based on concepts of treatment education and personal motivation such as use of insulin-to-carbohydrate ratio for adjustment or calculation of insulin sensitivity factor) show a higher rate of hypoglycaemia. Of course, conclusions as to causality cannot be drawn from this relationship.
An increase in sensitivity in this population to recognising these events, which were self-reported in our study, can probably partly account for the result. The result might also be explained by the fact that treatment with CSII or CGM was started in people with a high presence of hypoglycaemia. In any case, these data point to hypoglycaemia as an unresolved problem in the daily lives of people with T1DM. New insulins and administration systems and, in particular, automated hypoglycaemia prevention systems are sources of hope for the future.21
Previously published data indicated a rate of CSII use in Spain around 5% in patients with T1DM, with a major difference compared to other countries around Spain.20 The percentage of patients treated with CSII in countries that dedicate a similar percentage of the budget for expenditure on medicinal products and medical devices greatly exceeds this figure: Italy (12%) and France, Germany and the Netherlands (20%).22 However, in our study, 20.7% of patients used CSII. The percentage of CGM users also approached those recently published in the United States, although the data for this study were collected before CGM was widely funded by public health systems. This increase may confirm that Spain shares the trend towards increased use of technologies applied to diabetes seen in other countries.20 However, the possibility of bias in our study cannot be ruled out, as it featured participating sites in major cities, with more advanced services and technologies, and might not reflect the actual percentage of their use in all patients with T1DM.
The use of CSII was associated with lower HbA1c levels (0.3%–0.6%) when compared to basal-bolus users. Similarly, this study also found lower HbA1c levels in CGM compared to SMBG in both paediatric and adult patients. However, these data should be analysed with caution, because a causal relationship cannot be inferred for this difference obtained with an observational design. In the case of CGM, there does seem to be a benefit in HbA1c reduction, consistent with published studies.23 Nevertheless, in the analysis by age groups, patients at more typical adolescent ages (14−17 years of age) had higher mean HbA1c values, regardless of whether they were using CGM or CSII. This fact could confirm that individual factors, beyond administration systems and insulin monitoring, have a great deal of influence on blood glucose control. A study by Foster et al. showed the same HbA1c peak around this difficult group.20
Some individual factors that might influence blood glucose control are indicated in our study. Several are independent of T1DM management, such as level of education, but others are indirect indicators of the extent of treatment education received. The indicators in our study of advanced treatment with insulin, such as carbohydrate counting, good diet adherence and frequency of SMBG, as reported by Miller et al. in their study, showed better HbA1c control.24
The prevalence of overweight/obesity in the Spanish adult population is high (53%)25; the same is true of the population with T1DM (43.9% in our study) and it requires a specific approach. Weight gain with intensive insulin treatment has been observed for decades and the hyperinsulinism generated by this treatment is a possible cause.26 Recently proposed adjuvant treatments to exclusive insulin treatment in T1DM, aimed at reducing body weight and insulin doses, could be beneficial in this regard.27
The main limitation of this study was related to its cross-sectional, retrospective design and its manner of data collection. Information quality was limited by the information available in the medical records. Despite this, the study design enabled collection of data with sufficient accuracy to identify the characteristics and management of patients with T1DM seen at endocrinology practices in Spain. Another limitation could be selection bias: so as to mitigate this bias, patients who visited endocrinology practices were included consecutively. Although in general patients with greater morbidity account for more visits, patients with diabetes are usually seen on a regular basis to manage their disease, regardless of whether or not they are experiencing any worsening thereof. Hence, the patients included are considered representative of the Spanish population with T1DM.
It should be noted that in the process of calculating the sample size, the numbers of sites and patients that had to be included per Autonomous Community were also calculated such that proportionate representation of the Spanish population was ensured and the results can be extrapolated to the whole of that population. This is not the case of the paediatric sample, which is not representative of the Spanish paediatric population with T1DM. It was considered appropriate to include a sample of T1DM patients under 18 years of age, which despite being statistically insufficient in itself was calculated to be proportionate to the prevalence of T1DM (in children it is more incident but much less prevalent than in adults, as cases of all ages of onset gradually accumulate in the latter group). In any case, to determine specific data representative of the paediatric population, a specific study should be conducted.
ConclusionThe clinical characteristics and treatment of patients with T1DM in Spain are similar to those of other Western countries. Less than one third of patients have target HbA1c levels. While the rate of use of technologies in treatment (CSII and CGM) is higher than that previously published, and could confirm the trend observed in other countries, it remains lower than these. Greater adherence to treatment education recommendations in diabetes on self-monitoring and the use of specific tools to optimise insulin therapy are associated with better blood glucose control.
FundingSanofi (code DIREGL08156) provided logistical support for the study, statistical advising and medical writing through an unrestricted grant to the Sociedad Española de Diabetes [Spanish Diabetes Society] (SED). The study concept and design were developed and the data collection, analysis and interpretation performed thanks to the unconditional efforts of all the participating investigators, who are members of the SED.
Conflicts of interestFernando Gómez-Peralta has served on expert panels for Abbott Diabetes, Novartis, AstraZeneca, Sanofi and Novo Nordisk; has participated as principal investigator in clinical trials funded by Sanofi, Novo Nordisk, Boehringer Ingelheim Pharmaceuticals and Lilly; and has acted as a speaker for Abbott Diabetes, Novartis, Sanofi, Novo Nordisk, Boehringer Ingelheim Pharmaceuticals, AstraZeneca Pharmaceuticals LP, Bristol-Myers Squibb Co. and Lilly.
Edelmiro Luis Menéndez Torre has participated as an investigator in clinical trials funded by Sanofi and Novo Nordisk; has acted as a speaker for Abbott Diabetes, Sanofi, Novo Nordisk, AstraZeneca, Menarini and Lilly; and has received funding for education and research from Sanofi, Roche and Medtronic.
Santiago Conde Barreiro has acted as an adviser for Sanofi; has acted as a speaker for Lilly and Roche; and has received funding to participate in conference courses from Abbott Diabetes, Ascensia, Sanofi, Lilly and Novo Nordisk.
Ignacio Conget has received funding as an adviser and speaker for Medtronic, Bayer, Ascendia, GlaxoSmithKline, Eli Lilly, Novo Nordisk, Sanofi-Aventis, Novartis and MSD.
Anna Novials declares that she has no conflicts of interest.
Francisco Tinahones MadueÑo
Florentino Carral San Laureano
Martín López de la Torre
Alberto Moreno Carazo
Javier Acha Pérez
Edelmiro Menéndez Torre
Lluís Masmiquel Comas
Ignacio Llorente Gómez
Juan Angel Hernández Bayo
Cristina Abreu
Daniel de Luis y Gonzalo Díaz Soto
Antonio López-Guzmán
Benito Blanco Samper
Ignacio Conget Donlo
Manuel Pérez Maraver
Ismael Capel Flores
Wifredo Ricart Engel
Francisco Javier Ampudia Blasco
Antonio Hernández Mijares
Carlos Sánchez Juan
Antonio Picó Alfonos
José Ramón Domínguez Escribano
Pablo Abellán Galiana
Paolo Rossetti
Francisco M. Morales-Pérez
Fidel Enciso Izquierdo
Alfonso Soto González
Diego Bellido Guerrero
José Manuel García López
Víctor M. Andía Melero
José Alfonso Arranz Martín
Miguel Brito Sanfiel
Alfonso Calle Pascual
Manuel Ángel Gargallo Fernández
Antonio M. Hernández Martínez
Lluis Forga Llenas
Juan Pedro López-Siguero
Alfonso María Lechuga Sancho
Roque Cardona Hernández
Francisco Javier Arroyo Diez
Ignacio Diez López
Isabel Serrano Olmedo
Orosia Bandrés Nivela
Francisca Payeras Mas
Coral Montalbán Carrasco
Estefania Santos Mazo
Luz Mª López Jiménez
Visitacion Alvarez de Frutos
Ana Chico Ballesteros
Belen Dalama Gómez
Berta Soldevila Madorell
Marta Hernández García
Ana Megia Colet
Elisenda Climent Biescas
CarmiÑa Fajardo MontaÑana
Mª Teresa Pedro Font
Reyes Luna Cano
Sharona Azriel Mira
Marta Botella Serrano
Noemí González Pérez de Villar
Fátima Illán Gómez
Virginia Bellido Castañeda y Pedro González
Clara Rosario Fuentes Gómez
Amelia Oleaga Alday
Mª Ángeles Martínez de Salinas Santamaría
Ana Lucía Gómez-Gila
Marta Ferrer Lozano
Isolina Riaño Galán
María Caimari Jaume
María Clemente León
Gemma Carreras González
Paloma Cabanas Rodríguez
Mª Belén Roldán Martín
Purificación Ros Pérez
Itxaso Rica Echevarría
Please cite this article as: Gómez-Peralta F, Menéndez E, Conde S, Conget I, Novials A. Características clínicas y manejo de la diabetes tipo 1 en España. Estudio SED1. Endocrinología. Diabetes Nutr. 2021;68:642–653.
