


Lifestyle changes in medical nutrition therapy (MNT) are associated to HbA1c decreases ranging from 0.3 to 2%. Evidence shows that people with barriers are less likely to adhere to a long-term nutritional plan. Little information is available on the barriers that prevent the implementation of a healthy nutritional plan, and the strategies used to overcome them.
ObjectiveTo report the longitudinal changes in perceptions of barriers to adherence to a nutritional plan in T2DM.
MethodsA prospective cohort study with intervention. Follow-up was assessed at two years, and all patients received comprehensive care according to the CAIPaDi model. A questionnaire was used to detect the most common barriers to adherence to a nutritional plan at baseline and at 3 months and 1 and 2 years of follow-up. The analysis included data from 320 patients with complete evaluations from baseline to 2 years. Patients with T2DM aged 53.8±9.1 years (55.9% women), BMI 29.2±4.4kg/m2, and time since the diagnosis 1 (0–5) years were included in the study.
ResultsAt baseline, 78.4% of patients reported any barrier that limited adherence to a nutritional plan. The most common were “Lack of information on an adequate diet” (24.7%), “I eat away from home most of the time” (19.7%), and “Denial or refusal to make changes in my diet” (14.4%). After a structured nutritional intervention including strategies to eliminate each barrier, a 37% reduction (p<0.001) was seen in barriers at 2 years of follow-up. Patients with persistent barriers at two years had a greater proportion of HbA1c values >7% (24.7%) and triglyceride levels >150mg/dL (27.5%) out of the control range as compared to those with no barriers (11.6% and 14.4% respectively, p<0.05).
ConclusionsIdentification of barriers to adherence to a nutritional plan may allow healthcare professionals design interventions with the specific behavioral components needed to overcome such barrier, thus improving adherence to the nutritional plan with the resultant long-term changes.
Los cambios en el estilo de vida en la terapia médica nutricional (TMN), se asocian con una disminución en la hemoglobina glucosilada A1c (HbA1c) del 0,3–2%. La evidencia muestra que las personas con barreras tienen menos probabilidades de adherirse a un plan nutricional a largo plazo. Hay información limitada sobre las barreras que impiden la implementación de un plan nutricional saludable y sobre las estrategias utilizadas para superarlas.
ObjetivoDescribir los cambios longitudinales en las percepciones de las barreras para la adherencia a un plan nutricional con diabetes tipo 2 (T2D).
MétodosEstudio prospectivo de cohorte con intervención, se evaluó el seguimiento a 2 años, todos los pacientes recibieron atención integral de acuerdo con el estudio CAIPaDi. Se utilizó un cuestionario para detectar las barreras más comunes para realizar un plan nutricional al inicio del estudio a los 3 meses, uno y 2 años de seguimiento. El análisis incluyó datos de 320 pacientes que tenían evaluaciones completas desde el basal hasta 2 años. Se incluyeron pacientes con T2D de 53,8±9,1 años, 55,9% mujeres, IMC 29,2±4,4kg/m2 y tiempo desde el diagnóstico de 1 (0–5) año.
ResultadosAl inicio del estudio, el 78,4% de los pacientes refirieron alguna barrera que limita la adherencia a un plan nutricional. Las barreras más frecuentes fueron «Falta de información sobre una dieta correcta» (24,7%), «Como fuera de casa la mayor parte del tiempo» (19,7%) y «Negación o rechazo a hacer cambios en mi dieta» (14,4%). Después de una intervención nutricional estructurada, que incluyó estrategias para reducir cada barrera, observamos un porcentaje de reducción del 37% (p<0,001). Los sujetos que presentaban barreras persistentes a los 2 años de seguimiento, muestran una mayor proporción fuera del rango de control para la HbA1c el 24,7% (>7%) y triglicéridos el 27,5% (>150mg/dl) en comparación con aquellos sin barreras (11,6 y 14,4%, respectivamente) p<0,05.
ConclusionesLa identificación de las barreras para la adherencia a un plan de alimentación puede permitir a los profesionales de la salud diseñar intervenciones con los componentes de comportamiento específicos necesarios para superar dicha barrera, mejorando la adherencia al plan de alimentación con cambios sostenidos a largo plazo.
Type 2 diabetes (T2D) is one of the main public health problems around the world. Medical nutritional therapy (MNT) is an important aspect in a multidisciplinary approach. Life-style changes in MNT are associated with a decrease in A1C from 0.3 to 2%. This decrease is similar or higher than what is expected with pharmacological treatments.1,2 MNT focuses on the adoption of different dietary patterns and adequate decision making about food choices. It must be included in every educational diabetes self-care program.1 Evidence shows that people with barriers are less likely to adhere to a long term nutritional plan. There is limited information about barriers that prevent the implementation of a healthy nutritional plan, and on strategies used to overcome them.3–5
Main objective was to measure the changes in barriers at 3 months, 1 and 2-years of follow-up after the implementation of strategies to overcome each barrier. Secondary measures were the changes in dietary intake, anthropometric and biochemical variables evaluated among participants who presented or not barriers to adherence to a nutritional plan.
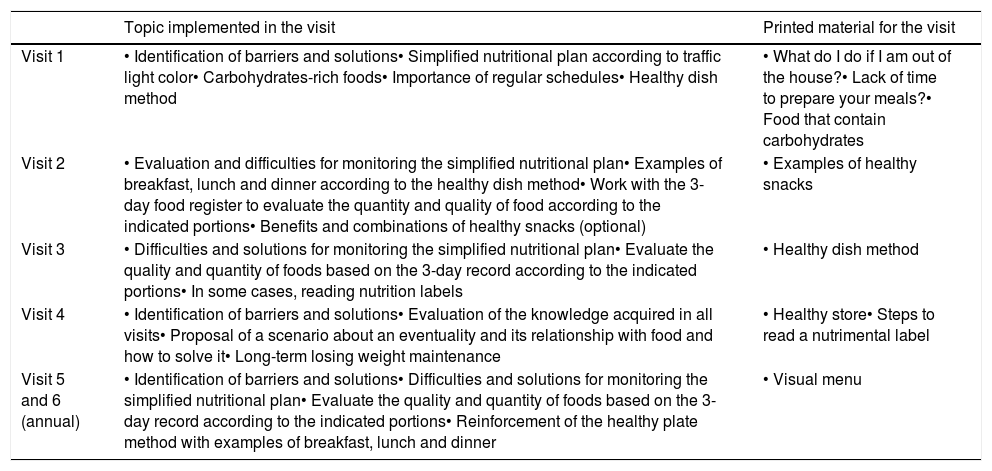
MethodsResearch designThis is a prospective cohort study, data presented here is part of the “Validation of an Integrated Attention Model for Patients with Type 2 Diabetes (CAIPaDi)” study, approved by the Ethics and Research Committees (Ref 1198) at the Instituto Nacional de Ciencias Médicas y Nutrición Salvador Zubirán and registered in ClinicalTrials.gov NCT02836808. Patients were attended in the Center for Comprehensive Care for Patients with Diabetes (CAIPaDi). The program's description has been before published by Hernández-Jiménez et al.6 Broadly, the CAIPaDi program includes patients with type 2 diabetes, between 18 and 70 years old, with less than 5 years of diagnosis, non-smokers, and without disabling complications. The selection of these criteria is based on the fact that this is the population in which such a program will have the greatest impact in reducing future complications.6 We included patients with T2D, aged 53.8±9.1 years, 55.9% women, BMI 29.2±4.4kg/m2, time since the diagnosis 1 (0–5) years. For this study we included 320 patients with complete evaluations from basal to 2 years of follow-up. The first phase comprises a baseline and 3 monthly visits (one visit per month), and the second consists of annual evaluations. In each visit they received evaluation from ten different specialists on the same day. The interventions include nutritional education strategies with specific goals for each visit. They also received printed material to help them overcome each barrier. During the first visit we use materials on topics such as ¿What can I do if I eat away from home? ¿Do you have enough time to cook your meals? We also instruct patients about a simplified nutritional plan. It included foods commonly used by Mexican population, grouping them as a traffic light. Green is for foods with low caloric content and can be eaten with a higher frequency. Yellow is for foods with carbohydrates, fats and low-fat animal products (moderate consumption). Red is for foods with high content of added sugars and saturated fat (avoid consumption).
Data collectionThe survey was designed to detect barriers to adherence to a nutritional plan. This tool was developed and validated by 3 nutritionists, 1 endocrinologist, and 1 psychologist. The survey included barriers reported by the patients and in the literature. The 3 nutritionists determined, by in-person interviews, the most common barriers. These were compared to others reported in the literature. A group of 60 persons were asked the main reason for not being able to follow a nutritional plan. The most common barriers were: (1) Lack of information about a correct diet, (2) I did not understand instructions, (3) Economic problems, (4) Lack of time to prepare my meals, (5) I eat away from home most of the time, (6) Denial or refusal to make changes in my diet, and (7) none. Those options were included as answers in the final item used for the patients in this study. In this phase, patients were only allowed to choose a single option. We implemented a structured intervention for nutritional education (Table 1) and strategies to reduce barriers:
- 1.
Lack of information about a correct diet: Simplified nutritional plan brochure according to traffic light color, “Carbohydrate-rich foods” flashcards, “Examples of visual snacks” flashcards.
- 2.
I did not understand instructions: Examples of breakfast, lunch and dinner according to the healthy dish method and portions indicated in the simplified feeding plan.
- 3.
Economic problems: Examples of low cost foods, menu and easy access for the patient, vegetables and fruits in season.
- 4.
Lack of time to prepare my meals: “Lack of time to prepare your meals?” flashcards, creation of a menu with practical and simple dishes, have stewed or chopped vegetables in the refrigerator, make shopping list and plan to go to the supermarket.
- 5.
I eat away from home most of the time: “What can I do if I’m away from home?” flashcards, “Healthy Dish Method” flashcards, examples of how to improve the selection of food.
- 6.
Denial or refusal to make changes in my diet: Explains the benefits of changing inappropriate eating habits, identify the motivation to carry out the simplified feeding plan.
Strategies to reduce each barrier in a structured nutritional intervention.
| Topic implemented in the visit | Printed material for the visit | |
|---|---|---|
| Visit 1 | • Identification of barriers and solutions• Simplified nutritional plan according to traffic light color• Carbohydrates-rich foods• Importance of regular schedules• Healthy dish method | • What do I do if I am out of the house?• Lack of time to prepare your meals?• Food that contain carbohydrates |
| Visit 2 | • Evaluation and difficulties for monitoring the simplified nutritional plan• Examples of breakfast, lunch and dinner according to the healthy dish method• Work with the 3-day food register to evaluate the quantity and quality of food according to the indicated portions• Benefits and combinations of healthy snacks (optional) | • Examples of healthy snacks |
| Visit 3 | • Difficulties and solutions for monitoring the simplified nutritional plan• Evaluate the quality and quantity of foods based on the 3-day record according to the indicated portions• In some cases, reading nutrition labels | • Healthy dish method |
| Visit 4 | • Identification of barriers and solutions• Evaluation of the knowledge acquired in all visits• Proposal of a scenario about an eventuality and its relationship with food and how to solve it• Long-term losing weight maintenance | • Healthy store• Steps to read a nutrimental label |
| Visit 5 and 6 (annual) | • Identification of barriers and solutions• Difficulties and solutions for monitoring the simplified nutritional plan• Evaluate the quality and quantity of foods based on the 3-day record according to the indicated portions• Reinforcement of the healthy plate method with examples of breakfast, lunch and dinner | • Visual menu |
Fasting concentrations of glucose, lipids and HbA1c were assessed in each evaluation. Body composition was assessed by bioimpedance using the Body Composition Analyzer JAWON medical ioi353, height and weight were measured with the same equipment.
Data analysisAnalysis was performed using X2 test to evaluate changes between visits 1, 4, 5 and 6 to analyze changes in the survey for barriers to the nutritional plan. We used Student's T test to determine differences in anthropometric variables (continuous variables) and X2 test for categorical variables between patients with and without barriers. A value of p<0.05 was considered as statistically significant. All analyses were performed using IBM SPSS Statistics, v 21.
ResultsWe determined the proportion of each barrier between the first at 4th, 5th and 6th visits, there were statistically significant differences (p<0.001).
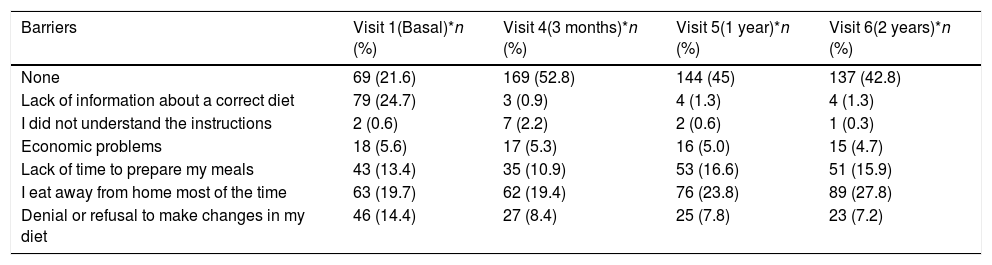
Table 2 shows the analyzed barriers, in order of frequency and the changes between visits. After two years of follow-up, 42.8% of patients had no barriers, compared with only 21.6% at visit 1 (p<0.001).
Changes in barriers after the implementation of strategies to reduce each barrier.
| Barriers | Visit 1(Basal)*n (%) | Visit 4(3 months)*n (%) | Visit 5(1 year)*n (%) | Visit 6(2 years)*n (%) |
|---|---|---|---|---|
| None | 69 (21.6) | 169 (52.8) | 144 (45) | 137 (42.8) |
| Lack of information about a correct diet | 79 (24.7) | 3 (0.9) | 4 (1.3) | 4 (1.3) |
| I did not understand the instructions | 2 (0.6) | 7 (2.2) | 2 (0.6) | 1 (0.3) |
| Economic problems | 18 (5.6) | 17 (5.3) | 16 (5.0) | 15 (4.7) |
| Lack of time to prepare my meals | 43 (13.4) | 35 (10.9) | 53 (16.6) | 51 (15.9) |
| I eat away from home most of the time | 63 (19.7) | 62 (19.4) | 76 (23.8) | 89 (27.8) |
| Denial or refusal to make changes in my diet | 46 (14.4) | 27 (8.4) | 25 (7.8) | 23 (7.2) |
Total n=320.
Data are frequency and (%).
X2 *p<0.001 (the value the p is for differences in V1–V4, V1–V5, V1–V6 and V4–V5, V5–V6).
From 320 patients, 24.7% reported “Lack of information about a correct diet” as the main barrier at baseline, this percentage changed to 0.9% at 3 months, 1.3% at 1 year, and 1.3% at 2 years, this barrier reduced 94.9% at two-years follow-up (p<0.001). The patients reported “I did not understand the instructions” were at basal visit of 0.6%, in visit 4 (2.2%), and visit 5 (0.6%), in visit 6, 0.6% reported this barrier (p<0.001). The “Economic problems” barrier was present in 5.6% of patients at basal. This variable decreased at the 3 months at 5.3%, 1-year visit 5% and visit 6 at 4.7% (p<0.001). We observed increased in “Lack of time to prepare my meals” the important change was perceived on visit 1 (13.4%) at visit 6 (15.9%) (p<0.001). The “I eat away from home most of the time” was present in 19.7% of patients, this number decreased to 19.4% for visit 4, but increased to 23.8% and 27.8% at visits 4, 5 and 6 respectively, as the main obstacle at two-years follow-up (p<0.0001) this barrier represents an increase of 41.1% compared to baseline. The barrier “Denial or refusal to make changes in my diet” was present in 14.4% of patients at baseline. This percentage reduced to 8.4% at visit 4, 7.8% at the 1-year evaluation and 7.2% at two-year. This barrier represented a 50% reduction compared to baseline.
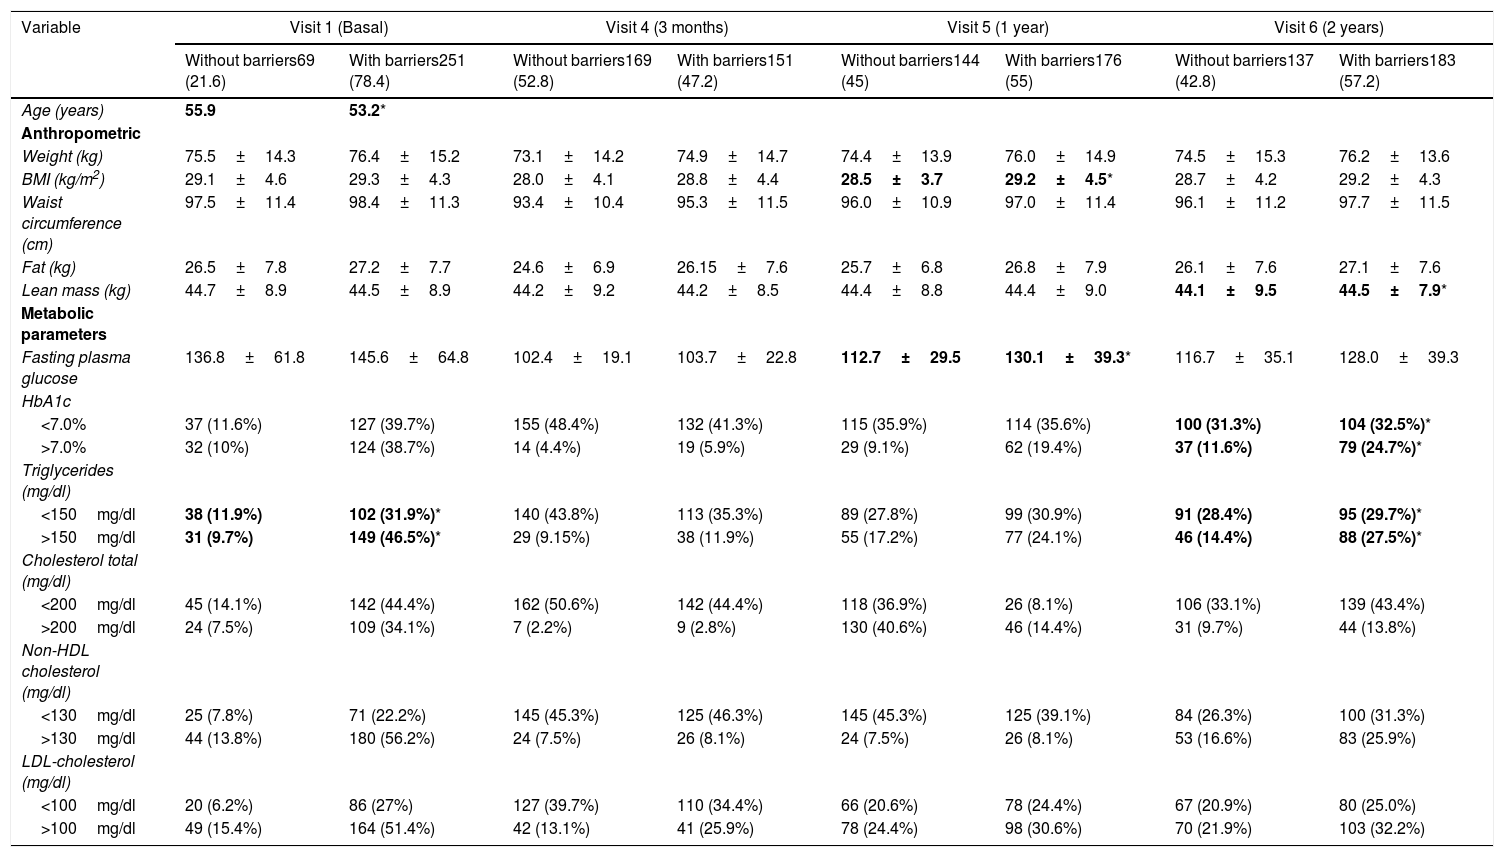
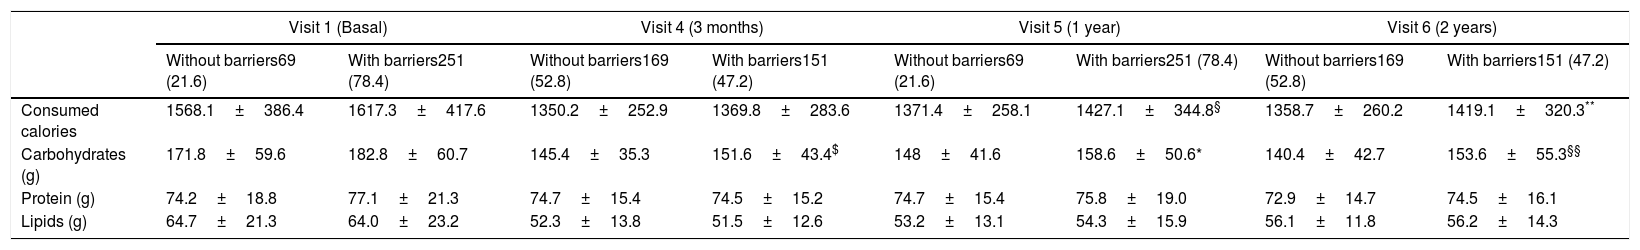
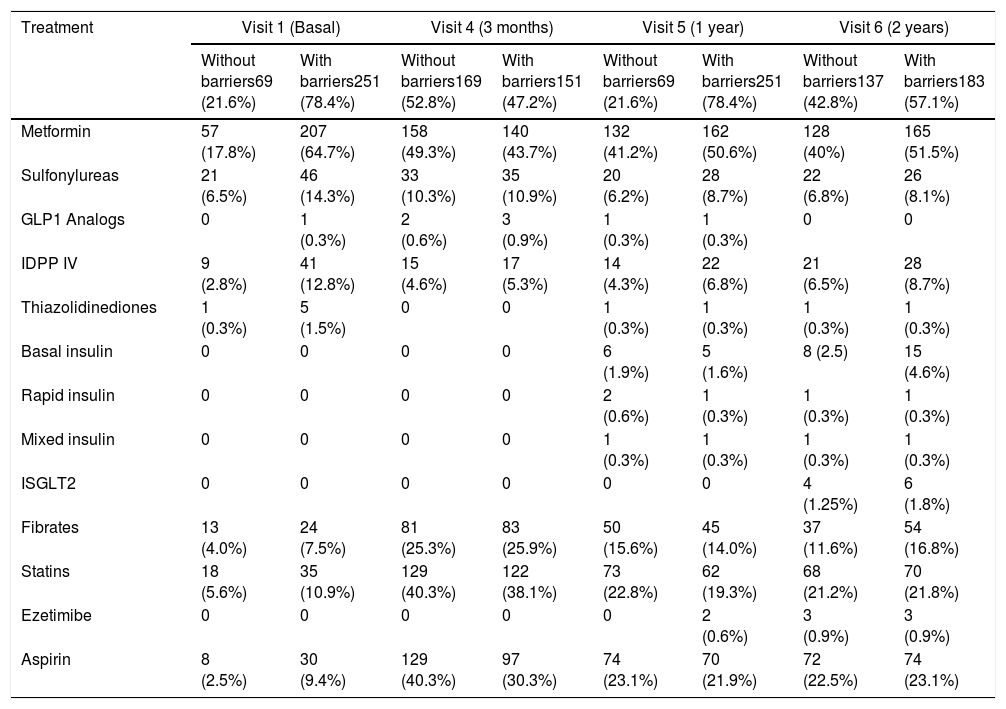
As a secondary aim, we compared metabolic and anthropometric variables between groups in each visit (Table 3). When analyzing the anthropometric and biochemical variables between the participants with and without barriers (Table 3) we found changes in the BMI at visit 5 (1 year) and visit 6 for lean mass. For the first, the significance (p=<0.05) is lost in the follow-up at 2 years. It should be noted that it is 0.7kg/m2 and for lean mass of 0.4kg being higher in the group with barriers. In the metabolic parameters we found significant differences (p=<0.05) at 2 years of follow-up for the metabolic control by HbA1c and triglycerides. The proportion of subjects outside of control goals for these two variables doubles for subjects who present barriers for the adherence to nutritional plan. Something similar happens in the alimentary variables (Table 4). Consumption of carbohydrates which is higher in the subjects who report having barriers to follow the nutritional plan. When evaluating dietary consumption, we found a difference of means of 55.7 and 60.3 kilocalories. For visits 5 and 6 respectively, the highest consumption was observed in subjects with barriers, V5 (p=0.003) and in V6 (p=0.009). No significant differences were found between the pharmacological treatment for diabetes and dyslipidemia (Table 5).
Changes in anthropometric and metabolic parameters.
| Variable | Visit 1 (Basal) | Visit 4 (3 months) | Visit 5 (1 year) | Visit 6 (2 years) | ||||
|---|---|---|---|---|---|---|---|---|
| Without barriers69 (21.6) | With barriers251 (78.4) | Without barriers169 (52.8) | With barriers151 (47.2) | Without barriers144 (45) | With barriers176 (55) | Without barriers137 (42.8) | With barriers183 (57.2) | |
| Age (years) | 55.9 | 53.2* | ||||||
| Anthropometric | ||||||||
| Weight (kg) | 75.5±14.3 | 76.4±15.2 | 73.1±14.2 | 74.9±14.7 | 74.4±13.9 | 76.0±14.9 | 74.5±15.3 | 76.2±13.6 |
| BMI (kg/m2) | 29.1±4.6 | 29.3±4.3 | 28.0±4.1 | 28.8±4.4 | 28.5±3.7 | 29.2±4.5* | 28.7±4.2 | 29.2±4.3 |
| Waist circumference (cm) | 97.5±11.4 | 98.4±11.3 | 93.4±10.4 | 95.3±11.5 | 96.0±10.9 | 97.0±11.4 | 96.1±11.2 | 97.7±11.5 |
| Fat (kg) | 26.5±7.8 | 27.2±7.7 | 24.6±6.9 | 26.15±7.6 | 25.7±6.8 | 26.8±7.9 | 26.1±7.6 | 27.1±7.6 |
| Lean mass (kg) | 44.7±8.9 | 44.5±8.9 | 44.2±9.2 | 44.2±8.5 | 44.4±8.8 | 44.4±9.0 | 44.1±9.5 | 44.5±7.9* |
| Metabolic parameters | ||||||||
| Fasting plasma glucose | 136.8±61.8 | 145.6±64.8 | 102.4±19.1 | 103.7±22.8 | 112.7±29.5 | 130.1±39.3* | 116.7±35.1 | 128.0±39.3 |
| HbA1c | ||||||||
| <7.0% | 37 (11.6%) | 127 (39.7%) | 155 (48.4%) | 132 (41.3%) | 115 (35.9%) | 114 (35.6%) | 100 (31.3%) | 104 (32.5%)* |
| >7.0% | 32 (10%) | 124 (38.7%) | 14 (4.4%) | 19 (5.9%) | 29 (9.1%) | 62 (19.4%) | 37 (11.6%) | 79 (24.7%)* |
| Triglycerides (mg/dl) | ||||||||
| <150mg/dl | 38 (11.9%) | 102 (31.9%)* | 140 (43.8%) | 113 (35.3%) | 89 (27.8%) | 99 (30.9%) | 91 (28.4%) | 95 (29.7%)* |
| >150mg/dl | 31 (9.7%) | 149 (46.5%)* | 29 (9.15%) | 38 (11.9%) | 55 (17.2%) | 77 (24.1%) | 46 (14.4%) | 88 (27.5%)* |
| Cholesterol total (mg/dl) | ||||||||
| <200mg/dl | 45 (14.1%) | 142 (44.4%) | 162 (50.6%) | 142 (44.4%) | 118 (36.9%) | 26 (8.1%) | 106 (33.1%) | 139 (43.4%) |
| >200mg/dl | 24 (7.5%) | 109 (34.1%) | 7 (2.2%) | 9 (2.8%) | 130 (40.6%) | 46 (14.4%) | 31 (9.7%) | 44 (13.8%) |
| Non-HDL cholesterol (mg/dl) | ||||||||
| <130mg/dl | 25 (7.8%) | 71 (22.2%) | 145 (45.3%) | 125 (46.3%) | 145 (45.3%) | 125 (39.1%) | 84 (26.3%) | 100 (31.3%) |
| >130mg/dl | 44 (13.8%) | 180 (56.2%) | 24 (7.5%) | 26 (8.1%) | 24 (7.5%) | 26 (8.1%) | 53 (16.6%) | 83 (25.9%) |
| LDL-cholesterol (mg/dl) | ||||||||
| <100mg/dl | 20 (6.2%) | 86 (27%) | 127 (39.7%) | 110 (34.4%) | 66 (20.6%) | 78 (24.4%) | 67 (20.9%) | 80 (25.0%) |
| >100mg/dl | 49 (15.4%) | 164 (51.4%) | 42 (13.1%) | 41 (25.9%) | 78 (24.4%) | 98 (30.6%) | 70 (21.9%) | 103 (32.2%) |
Note: Mean and standard deviation are presented for the continuous variables and frequencies and percentages for the categorical variables.
Changes in the total calories consumed per day and in the grams of macronutrients between groups.
| Visit 1 (Basal) | Visit 4 (3 months) | Visit 5 (1 year) | Visit 6 (2 years) | |||||
|---|---|---|---|---|---|---|---|---|
| Without barriers69 (21.6) | With barriers251 (78.4) | Without barriers169 (52.8) | With barriers151 (47.2) | Without barriers69 (21.6) | With barriers251 (78.4) | Without barriers169 (52.8) | With barriers151 (47.2) | |
| Consumed calories | 1568.1±386.4 | 1617.3±417.6 | 1350.2±252.9 | 1369.8±283.6 | 1371.4±258.1 | 1427.1±344.8§ | 1358.7±260.2 | 1419.1±320.3** |
| Carbohydrates (g) | 171.8±59.6 | 182.8±60.7 | 145.4±35.3 | 151.6±43.4$ | 148±41.6 | 158.6±50.6* | 140.4±42.7 | 153.6±55.3§§ |
| Protein (g) | 74.2±18.8 | 77.1±21.3 | 74.7±15.4 | 74.5±15.2 | 74.7±15.4 | 75.8±19.0 | 72.9±14.7 | 74.5±16.1 |
| Lipids (g) | 64.7±21.3 | 64.0±23.2 | 52.3±13.8 | 51.5±12.6 | 53.2±13.1 | 54.3±15.9 | 56.1±11.8 | 56.2±14.3 |
Changes in oral antidiabetic drugs, insulin and lipid lowering agent.
| Treatment | Visit 1 (Basal) | Visit 4 (3 months) | Visit 5 (1 year) | Visit 6 (2 years) | ||||
|---|---|---|---|---|---|---|---|---|
| Without barriers69 (21.6%) | With barriers251 (78.4%) | Without barriers169 (52.8%) | With barriers151 (47.2%) | Without barriers69 (21.6%) | With barriers251 (78.4%) | Without barriers137 (42.8%) | With barriers183 (57.1%) | |
| Metformin | 57 (17.8%) | 207 (64.7%) | 158 (49.3%) | 140 (43.7%) | 132 (41.2%) | 162 (50.6%) | 128 (40%) | 165 (51.5%) |
| Sulfonylureas | 21 (6.5%) | 46 (14.3%) | 33 (10.3%) | 35 (10.9%) | 20 (6.2%) | 28 (8.7%) | 22 (6.8%) | 26 (8.1%) |
| GLP1 Analogs | 0 | 1 (0.3%) | 2 (0.6%) | 3 (0.9%) | 1 (0.3%) | 1 (0.3%) | 0 | 0 |
| IDPP IV | 9 (2.8%) | 41 (12.8%) | 15 (4.6%) | 17 (5.3%) | 14 (4.3%) | 22 (6.8%) | 21 (6.5%) | 28 (8.7%) |
| Thiazolidinediones | 1 (0.3%) | 5 (1.5%) | 0 | 0 | 1 (0.3%) | 1 (0.3%) | 1 (0.3%) | 1 (0.3%) |
| Basal insulin | 0 | 0 | 0 | 0 | 6 (1.9%) | 5 (1.6%) | 8 (2.5) | 15 (4.6%) |
| Rapid insulin | 0 | 0 | 0 | 0 | 2 (0.6%) | 1 (0.3%) | 1 (0.3%) | 1 (0.3%) |
| Mixed insulin | 0 | 0 | 0 | 0 | 1 (0.3%) | 1 (0.3%) | 1 (0.3%) | 1 (0.3%) |
| ISGLT2 | 0 | 0 | 0 | 0 | 0 | 0 | 4 (1.25%) | 6 (1.8%) |
| Fibrates | 13 (4.0%) | 24 (7.5%) | 81 (25.3%) | 83 (25.9%) | 50 (15.6%) | 45 (14.0%) | 37 (11.6%) | 54 (16.8%) |
| Statins | 18 (5.6%) | 35 (10.9%) | 129 (40.3%) | 122 (38.1%) | 73 (22.8%) | 62 (19.3%) | 68 (21.2%) | 70 (21.8%) |
| Ezetimibe | 0 | 0 | 0 | 0 | 0 | 2 (0.6%) | 3 (0.9%) | 3 (0.9%) |
| Aspirin | 8 (2.5%) | 30 (9.4%) | 129 (40.3%) | 97 (30.3%) | 74 (23.1%) | 70 (21.9%) | 72 (22.5%) | 74 (23.1%) |
No significant differences between the groups.
The National Health Survey in Mexico (ENSANUT MC 2016) identified factors as barriers for nutritional plan. The most common were lack of money to buy fruits and vegetables (50.4%), lack of knowledge on how to cook healthy meals (38.4%), lack of time to cook or eat healthy meals (34.4%), lack of a healthy diet amongst the family (32.4%), preference for drinking sweetened beverages and energy-dense foods (pastries, candy, and junk food) (31.6%), lack of motivation (28.3%), and a distaste for the flavor (23%).7 Our survey was designed and used before publication of ENSANUT MC 2016, so it was not considered for the design in this study.
The main aim of this study was to identify the most frequent barriers and describe the changes over time for adherence to a nutritional plan in patients with DM2. The analyses revealed that, at the beginning, the main barrier was lack of information. After receiving the interventions other barriers became more relevant, such as “I eat away from home most of the time” or “Lack of time to prepare my meals”. These observations coincide with the barriers analyzed by ENSANUT MC 2016.
We found that 42.8% of participants have no nutritional barriers at 2 years. Yet, “I eat away from home most of the time” shows an increase from 19.7% at baseline (Visit 1) to 27.8% at 2 years (Visit 6). One reason for this increment is that patients become aware of their reality and the obstacles in their daily life.8 These translates to a behavioral deficit on how to solve problems in their environment. To make behavioral changes is difficult.9 Studies underscore the lack of long term support to help patients recently diagnosed with diabetes to handle the burnout of the disease.10 The CAIPaDi program seeks to generate long-term strategies in response to these topics. Furthermore, a strategy may be to impart a healthy cooking workshop. A workshop helps provide cognitive and behavioral tools for cooking meals. These tools may be extrapolated when eating at their workplace. They help as behavioral tools for a better decision making in uncontrolled environments, such as “eating away from home”. Modifying lifestyle includes behavioral changes for weight loss, nutritional education, and increasing physical activity.11 As Galasso et al. did, culturization of strategies should be sought, as a way to overcome barriers for adherence.4
One of the main contributions of our work is to have identified “lack of information” as a barrier. We also implemented actions to overcome such obstacle. Ouyang et al., found that more self-efficacy, better understanding, and a better attitude toward diabetes were associated with more self-care behaviors and within these the dietetic behaviors are of utmost importance.12 We observed that poor adherence to diet recommendations is an important contributor for poor metabolic control.3 Our study found that patients who identify barriers in their lives have higher out range metabolic parameters compared to those without barriers. This may be the result of perceiving obstacles that affect compliance with other areas too. The patient's identification of modifiable barriers in each visit helps health professional create specific strategies to favor compliance with the nutritional plan. This helps lose weight and long-term weight maintenance. Thus, changes in nutritional patterns, from food selection, cooking and frequency of eating represent a great challenge. With the intervention applied since the first visit, we promote an individualized approach for nutritional recommendations. The results observed in our study seem encouraging since at two years follow-up, 42.8% of participants report no barriers. This shows that a structured program based on nutritional education is of great importance. It helps the health professional to give priority to specific areas and create strategies to overcome barriers. The solution of problems using viable strategies increases adherence. When elaborating a nutritional intervention, food availability and the patient's economic access must be considered.13 We need to develop strategies by the patient's resources, and not with the health team's convenience. This fact is usually adjuvant to overcome barriers and increase adherence to treatment. With this, motivation for compliance to a nutritional plan starts to diminish. Most people understand the health benefits associated with compliance. Unfortunately, participants’ adherence to health promoting behaviors is directly affected by several factors. If participants are not endowed with the necessary skills for self-care in adverse situations, they will have a hard time making the right decisions about health. Identification of barriers that may have an influence in adherence to a nutritional plan will lead us to search for the best strategies. The strategies should search priority to their nutritional needs, minimizing health risks.
ConclusionsThe results of this study show that empower patients with knowledge and behavioral skills to implement strategies to make better decisions when eating, nutritional education in diabetes is an effective way to overcome barriers for adherence to nutritional medical treatment. Identifying barriers allows health professionals design interventions with the specific behavioral components needed to overcome such barrier. Early identification of barriers allows the development of low-cost material. These tools may be regionalized in accordance to individual likes and preferences. This gives patients independence when choosing, cooking and eating their foods. At the same time makes them responsible for the decisions taken about nutrition. This study also highlights the importance of evaluating these barriers during nutritional intervention because we can get results on the efficacy of such strategies, so that long-term metabolic control may be achieved.
FundingThe CAIPaDi program has received grants from Astra Zeneca, Fundación Conde de Valenciana, Novartis, Consejo Nacional de Ciencia y Tecnología (“Proyectos de Desarrollo Científico para Atender Problemas Nacionales 2013 project 214718), Nutrición Médica y Tecnología, NovoNordisk, Boehringer Ingelheim, Dirección General de Calidad y Educación en Salud, Eli Lilly, Merck Serono, MSD, Silanes, Chinoin and Carlos Slim Health Institute. There are no other potential conflicts of interest relevant to this article.
Authors’ contributionAll authors were involved in the redaction of the paper, and all authors read and approved the final manuscript.
Conflict of interestThe authors declare no potential conflicts of interest with respect to the research, authorship and/or publication of this article.
Claudia González-Jáuregui, Norma Areli Rivera-García, Ximena Cerón-Ramírez, Gema Arteaga-Camarillo, Valeria Miranda-Gil, Edith Domínguez-Lara, Rocío Chontal-Fonseca, Fernanda Islas-Anzures, Patricia Santos-Pedro, and Crisol León-Reyes.
Denise Arcila-Martínez, Rodrigo Arizmendi-Rodríguez, Oswaldo Briseño-González, Humberto Del Valle-Ramírez, Arturo Flores-García, Eduardo González-Flores, Fernanda Garnica-Carrillo, Mariana Granados-Arcos, Héctor Infanzón-Talango, Claudia Lechuga-Fonseca, Arely López-Reyes, Angélica Palacios-Vargas, Eder Patiño-Rivera, Liliana Pérez-Peralta, David Rivera de la Parra, Francis Rojas-Torres, Marcela Ruiz-Cervantes, Vanessa Ruiz-González, Sandra Sainos-Muñoz, Alejandra Sierra-Esquivel, Erendi Tinoco-Ventura, Luz Elena Urbina-Arronte, María Luisa Velasco-Pérez, Andrea Villegas-Narvaez, Verónica Zurita-Cortés, Carlos Alberto Aguilar-Salinas, Francisco Javier Gómez-Pérez, David Kershenobich-Stalnikowitz
